
Executive Summary
CCC’s 2026 Crash Course report reflected on the numerous underlying and consequential shifts affecting the industries we serve and the results that we observe: affordability pressures, an aging vehicle fleet, changing claim behaviors, rising total loss frequency, and greater vehicle technology. All continue to alter the composition of claims and the economics of repair.
Since publishing Crash Course 2026 in March, we’ve continued to track the report’s key data points and influencing or contributing factors.
The following updates demonstrate how complexity is becoming more concentrated across the industry, driven by higher-cost claims, older vehicles driving increased total loss results, technology-rich newer vehicles, and consumers with less financial flexibility to absorb an unexpected loss.
1. Claims volume declines are moderating
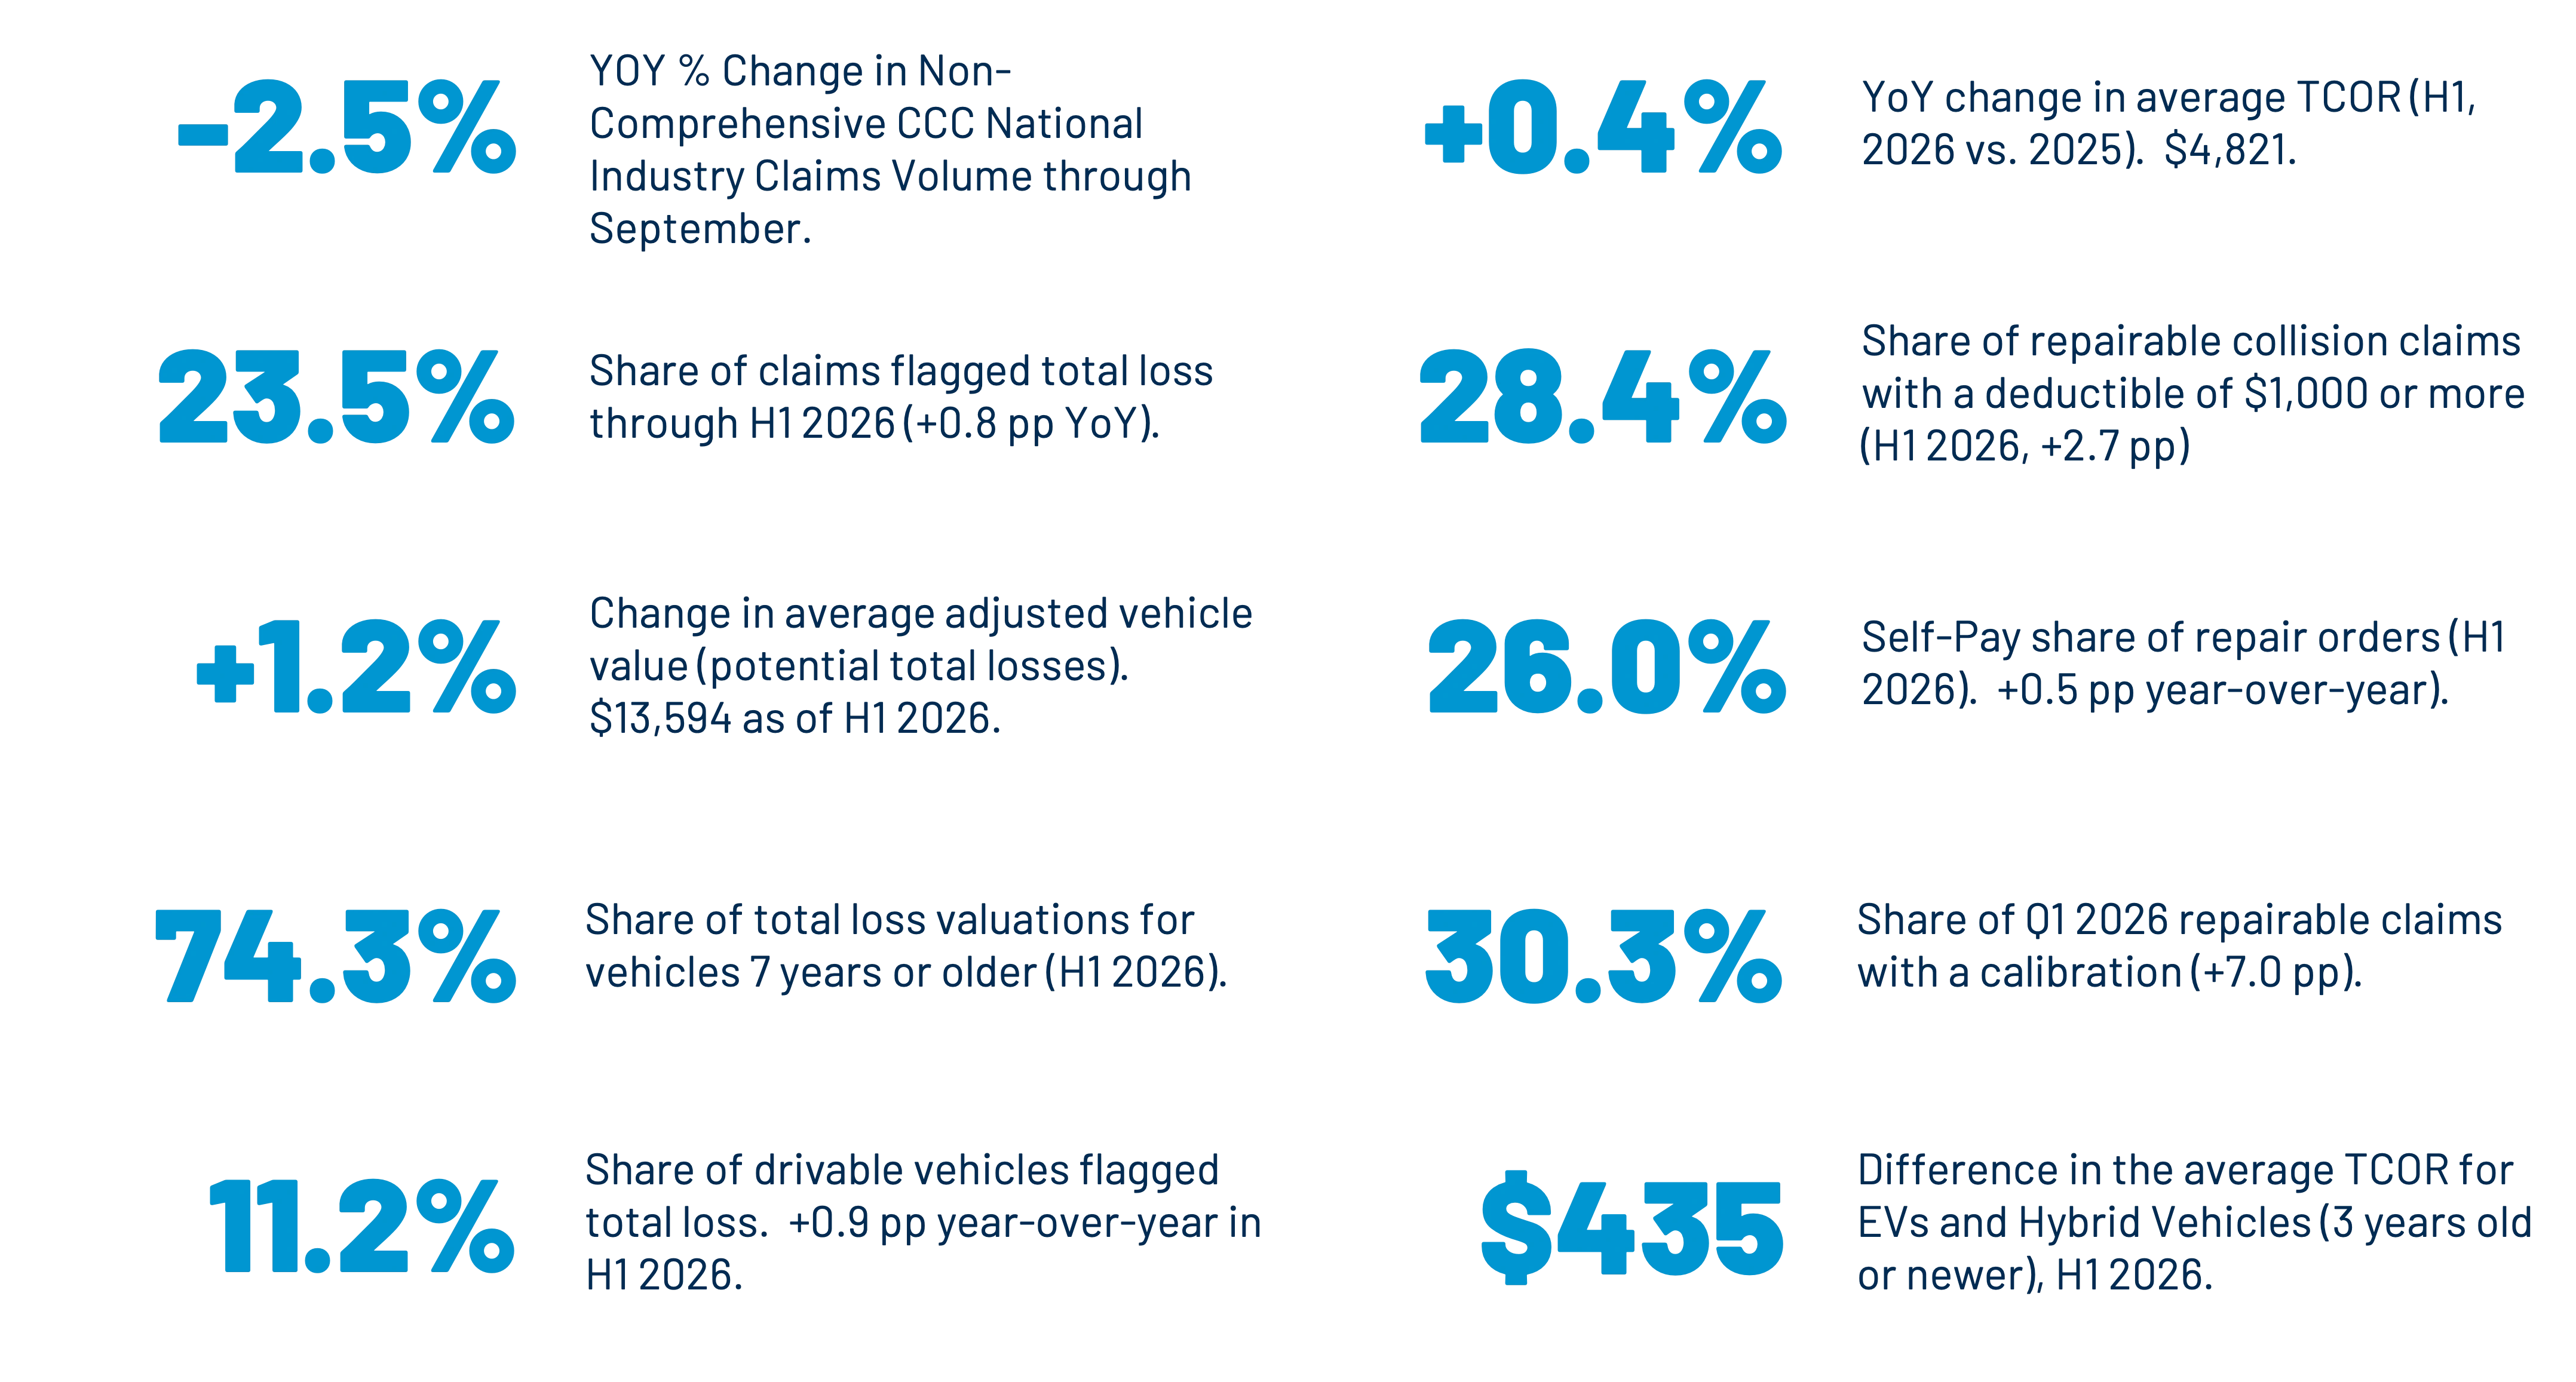
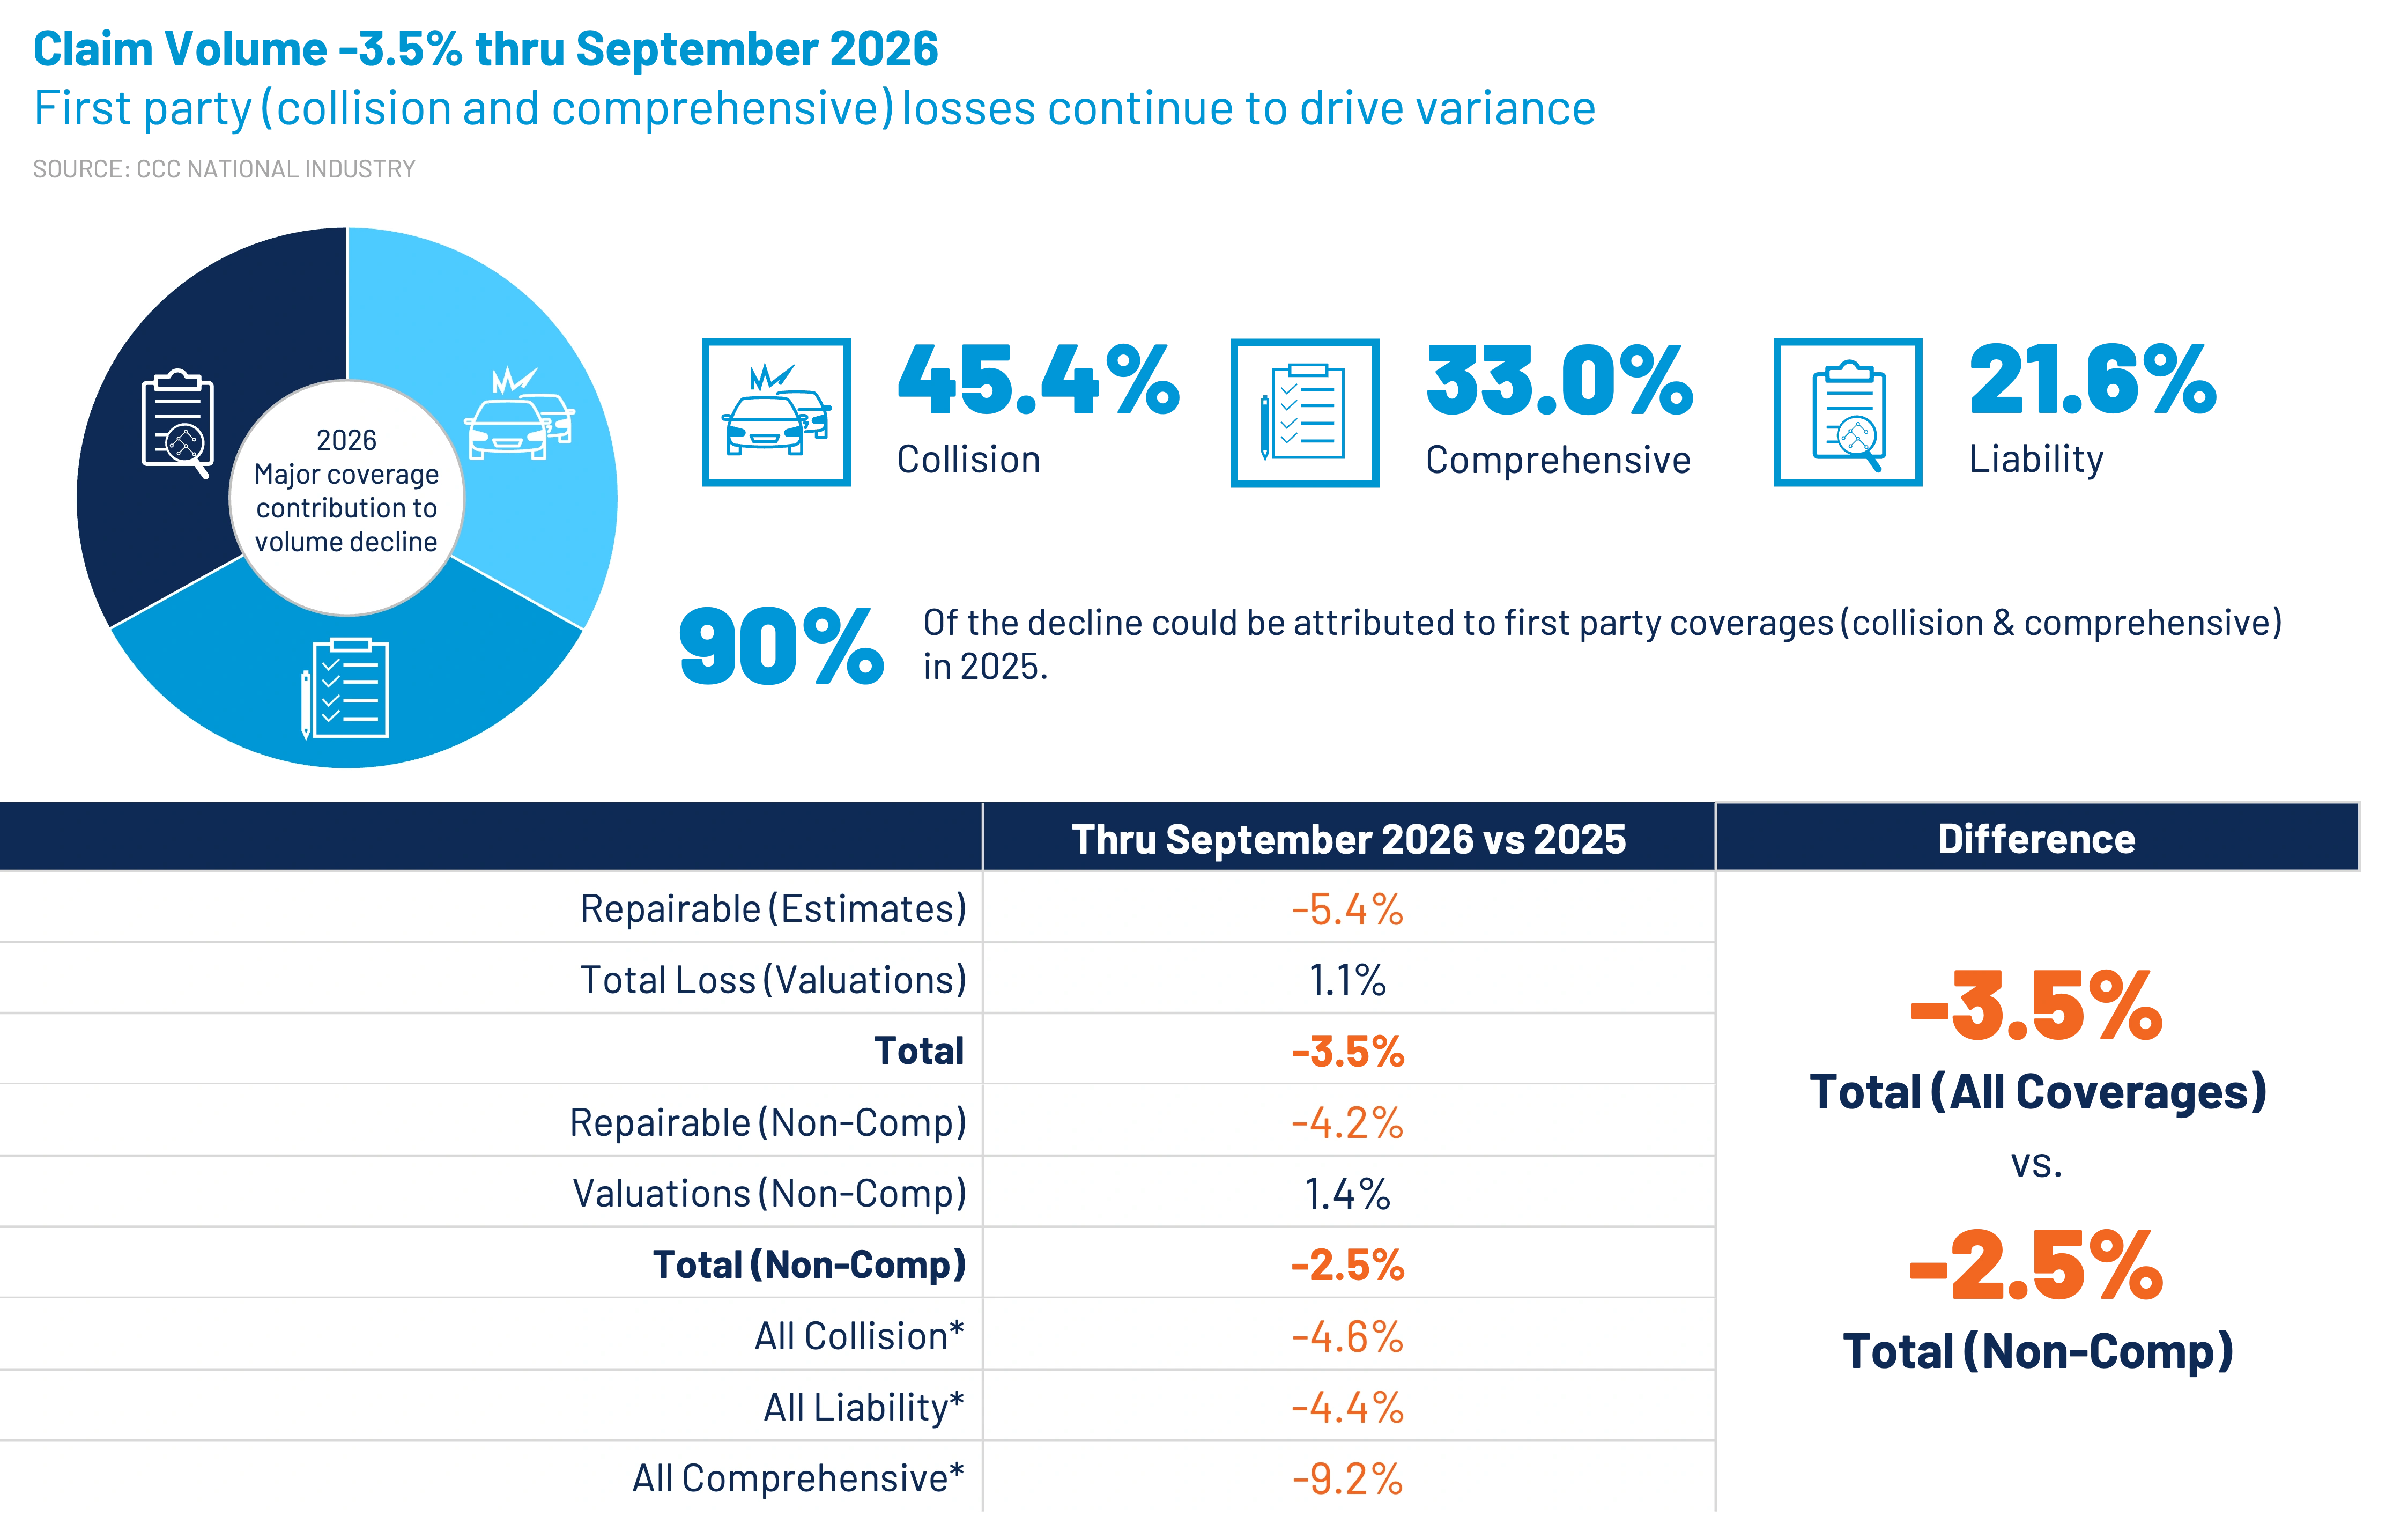
Through September, claims frequency was down 3.5% compared with an 8.3% decline through the same period in 2025. Repairable estimates declined 5.4%, compared with a 10.4% decline a year earlier, while total loss valuations increased 1.1% after declining 3.1% through September 2025.
A similar pattern was observed when comprehensive claims were excluded. Non-comprehensive volume was down 2.5% through September, compared with a 6.6% decline at the same point in 2025. Non-comprehensive repairable claims declined 4.2%, compared with a 8.9% decline a year earlier, while total loss valuations increased 1.4% after declining 1.2% through September 2025.
The composition of claim volume changes also shifted somewhat in 2026, with collision and comprehensive claims accounting for approximately 80% of total volume reduction, compared with about 90% in 2025.
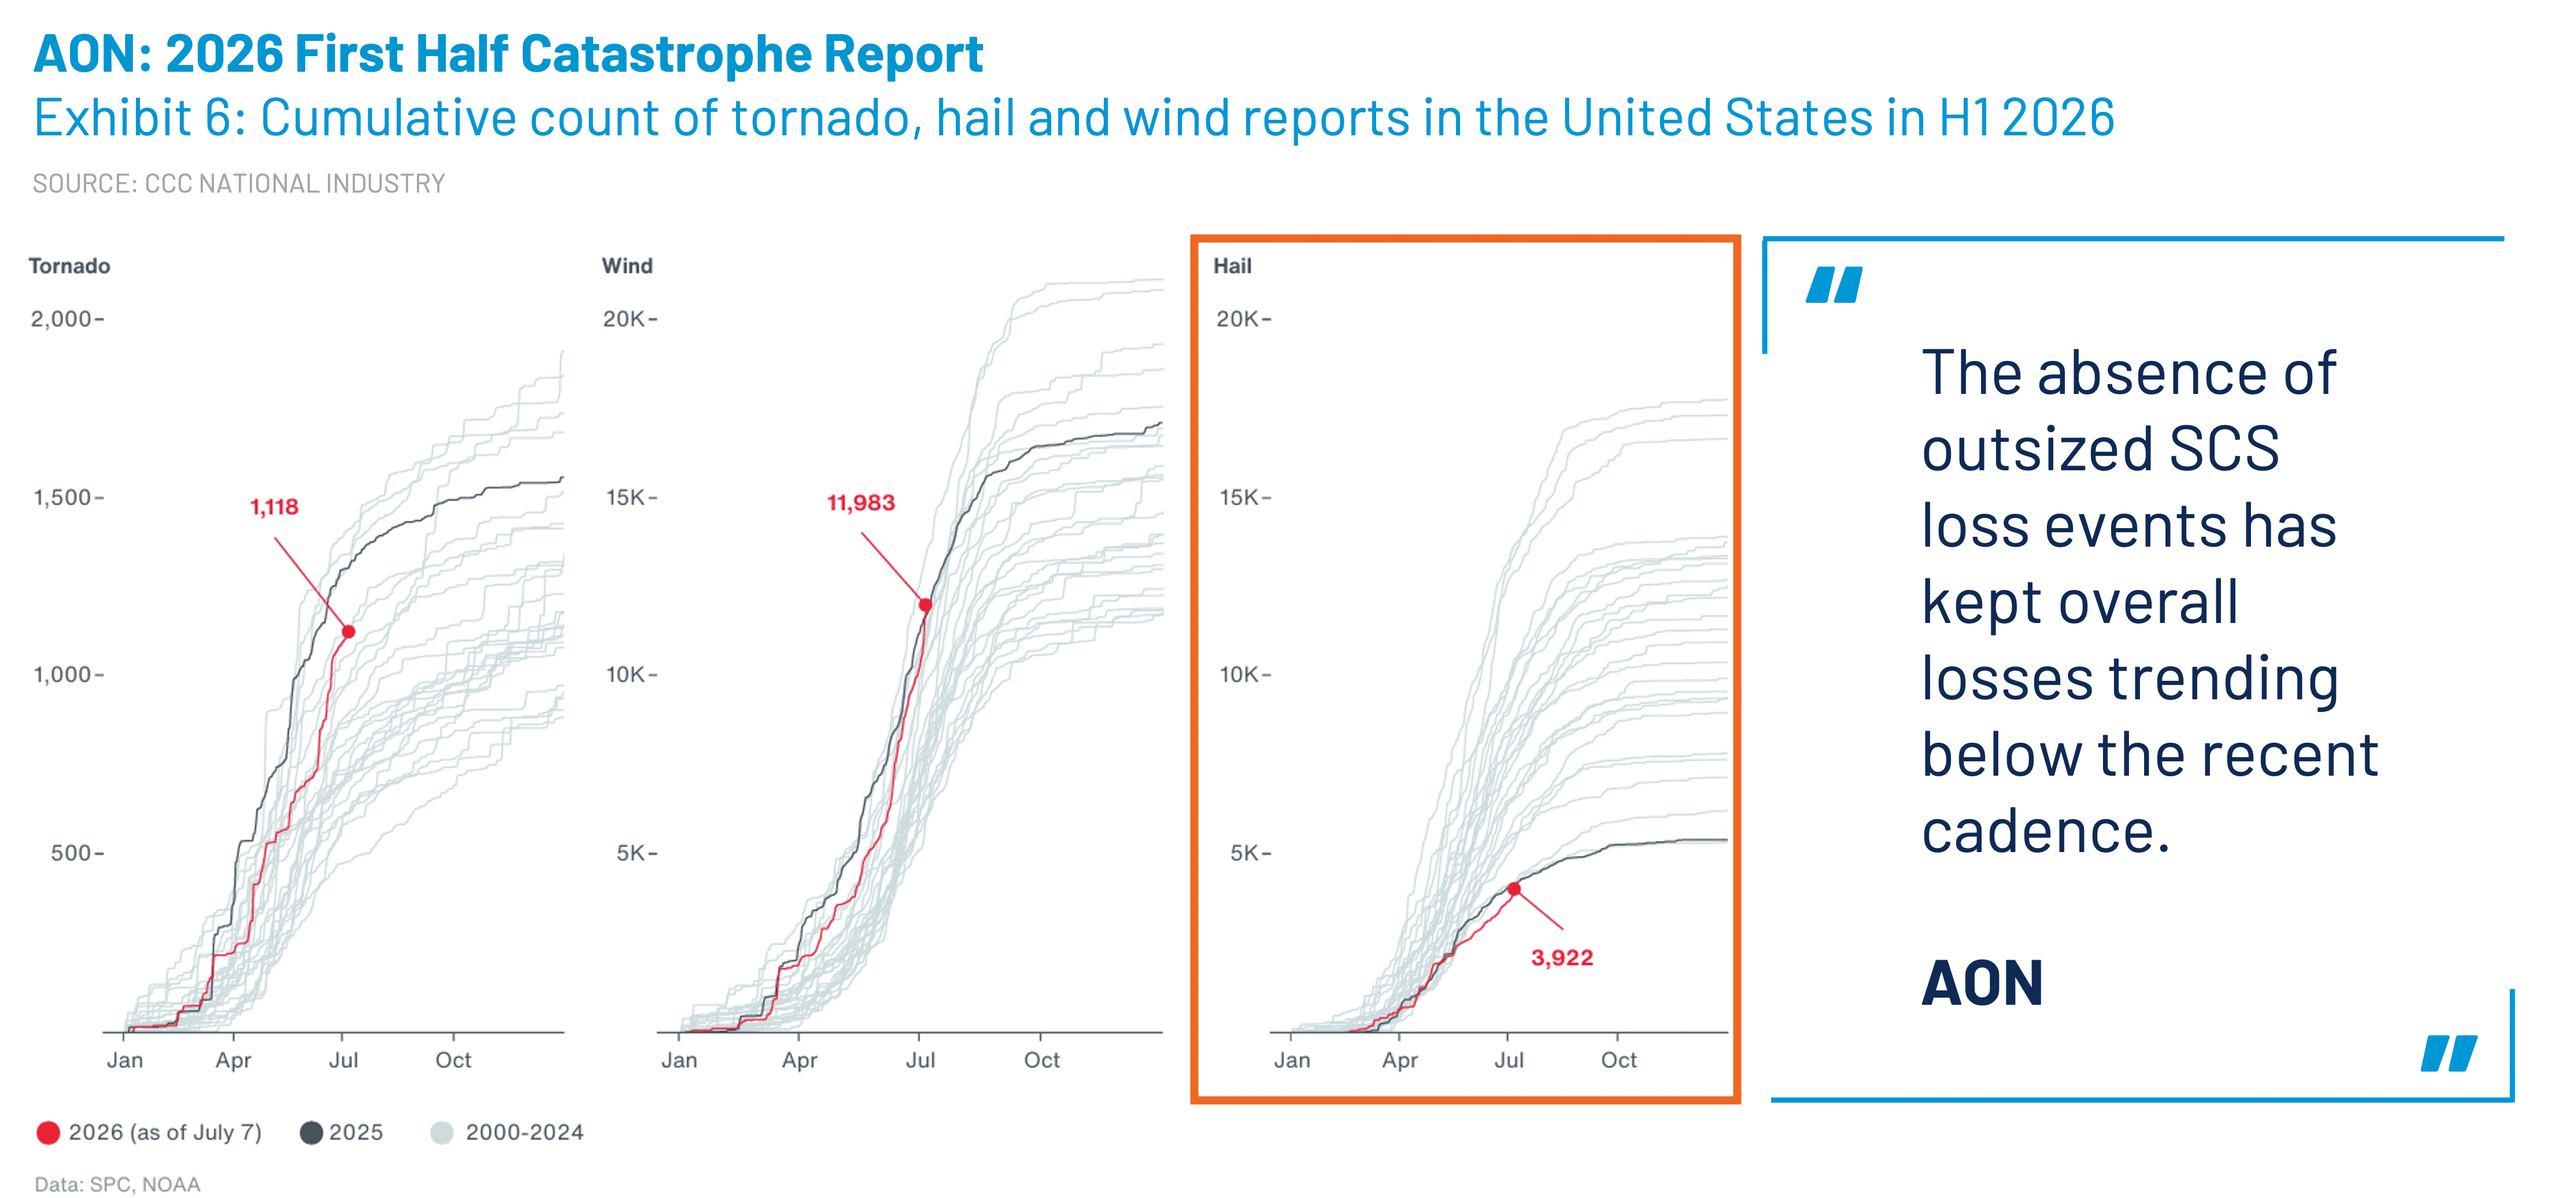
Comprehensive volume remains down by almost 10% through September, driven by relatively isolated catastrophic claims activity and fewer vehicle thefts. These same factors accounted for a 16.1% decline in comprehensive claims volume in 2025. While there have been isolated catastrophic weather events in 2026, AON’s First Half Global Catastrophe Recap identified a notable decline in U.S. hail events in both 2025 and the first half of 2026, affirming the continued decline in comprehensive claims volume.
First-party filings also continue to be influenced by increased deductibles, premium sensitivity, and consumers' willingness to absorb smaller losses themselves. The result is a system processing fewer claims, but a mix increasingly concentrated toward losses that are less discretionary.
2. Repair cost inflation has flattened, not disappeared
The average total cost of repair (TCOR) reached approximately $4,821 in the first half of 2026, only 0.6% above the first half of 2025. This is a significant deceleration from the 15.7% increase recorded in H1 2022. Since 2020, however, the average has still risen from approximately $3,331 to more than $4,800.
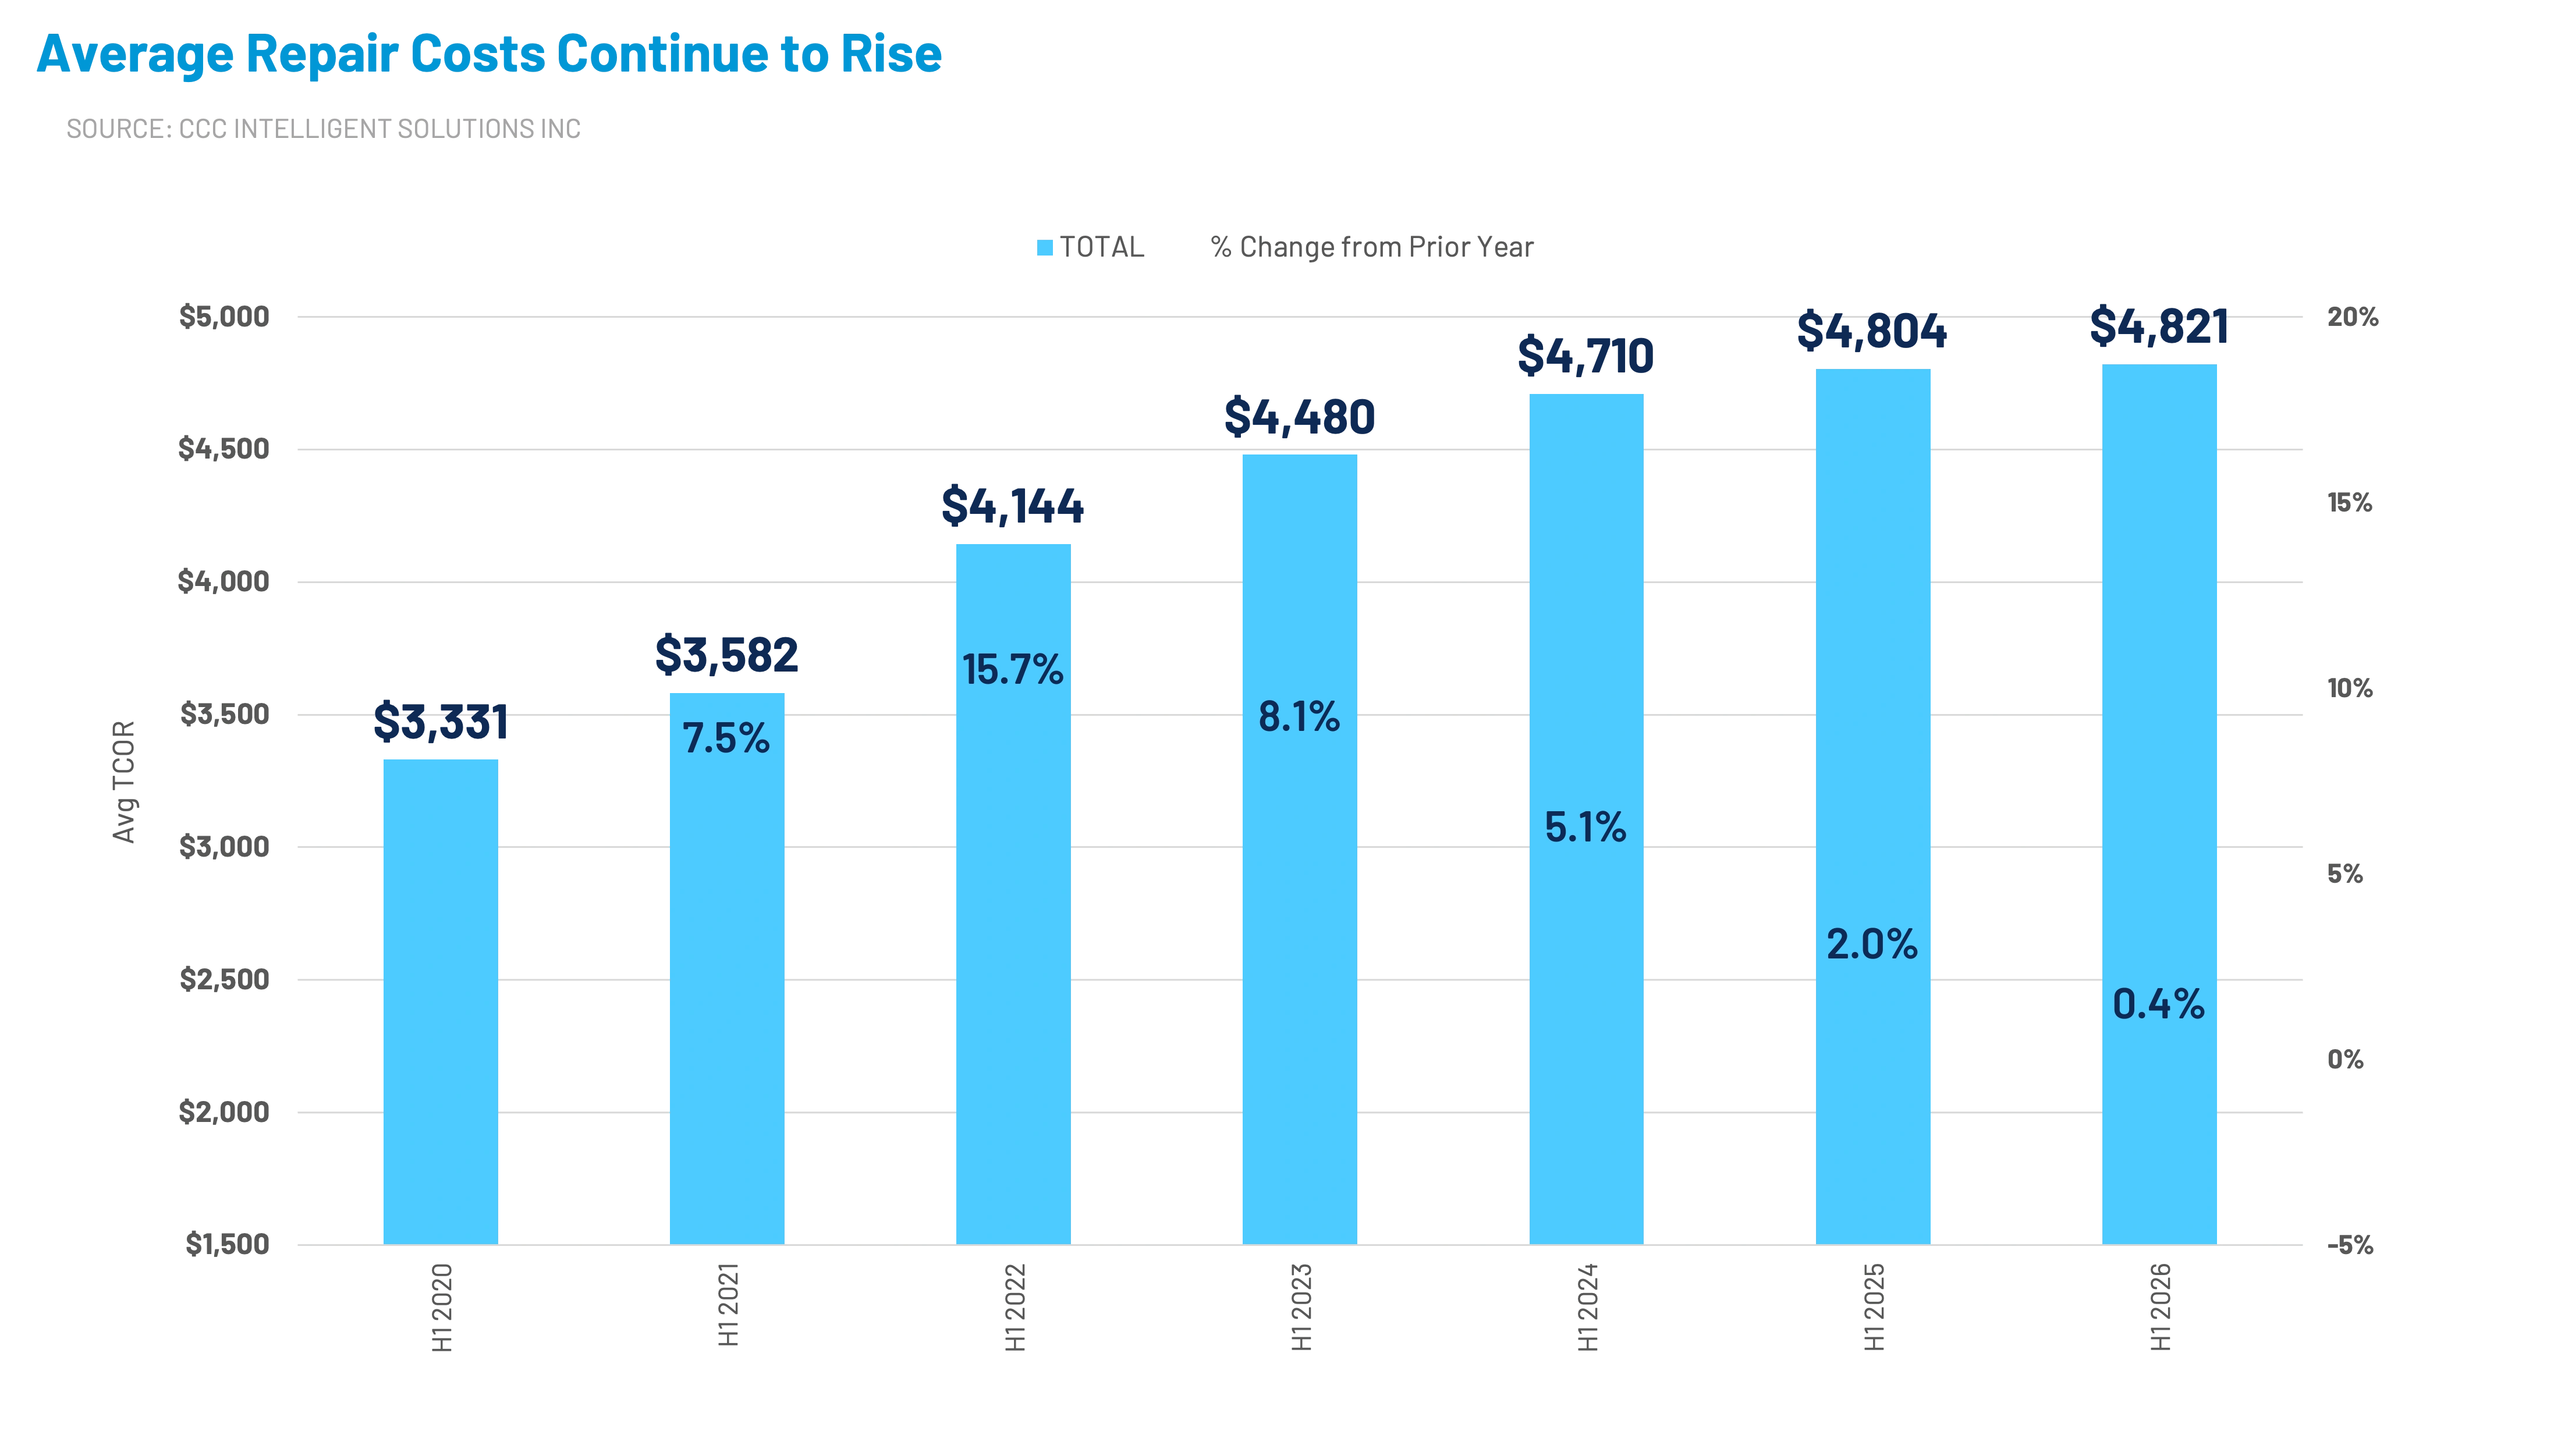
This reflects claims composition as much as easing input costs -- average part prices remained approximately 8% higher year-over-year through early 2026, while labor rates increased by 1.5%.
The increases in average price per part are generally aligned with tariff activity, the landscape of which continues to evolve in 2026. Most notably, the White House has announced 50% tariffs on Canadian automobiles and auto parts under Section 338 of the Tariff Act of 1930, beginning January 1, 2027. If they are implemented like current Section 338 measures, they would apply in addition to existing duties, with no exemption for USMCA-qualifying goods.
As of 2024, Canada represented ~11% of all imported auto parts (dollars) and ~13% of imported vehicles (both volume and dollars).
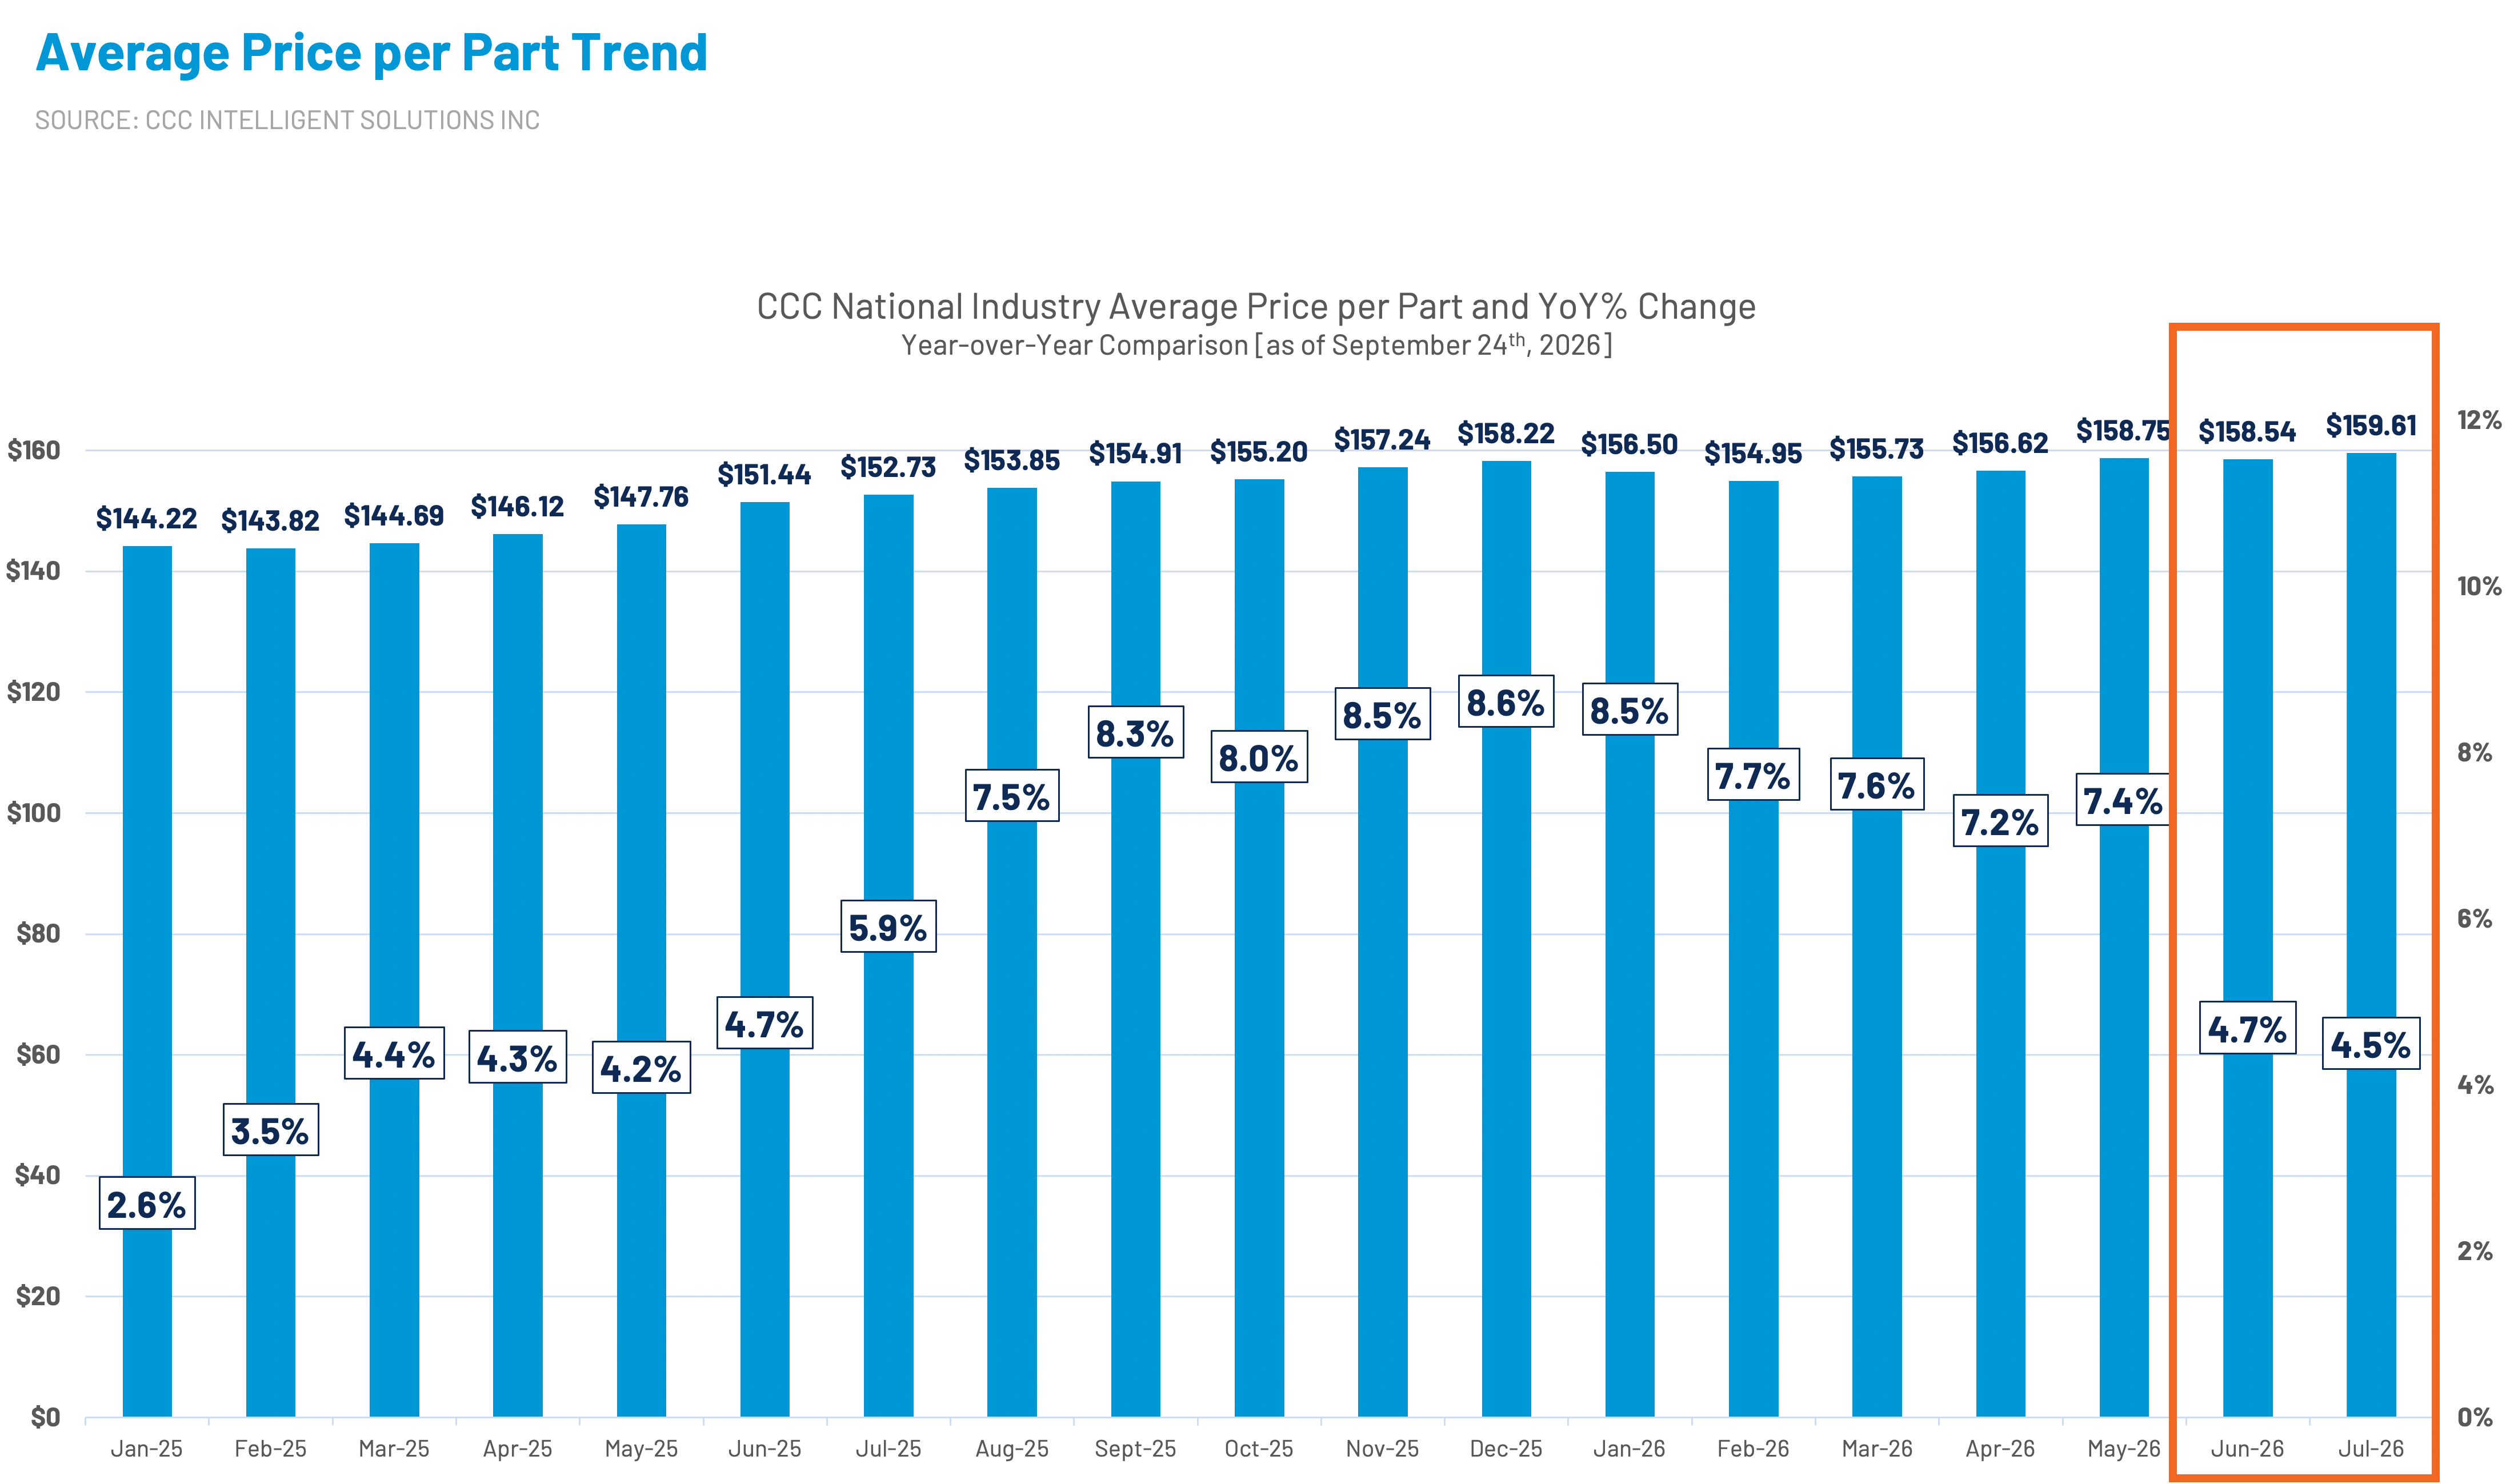
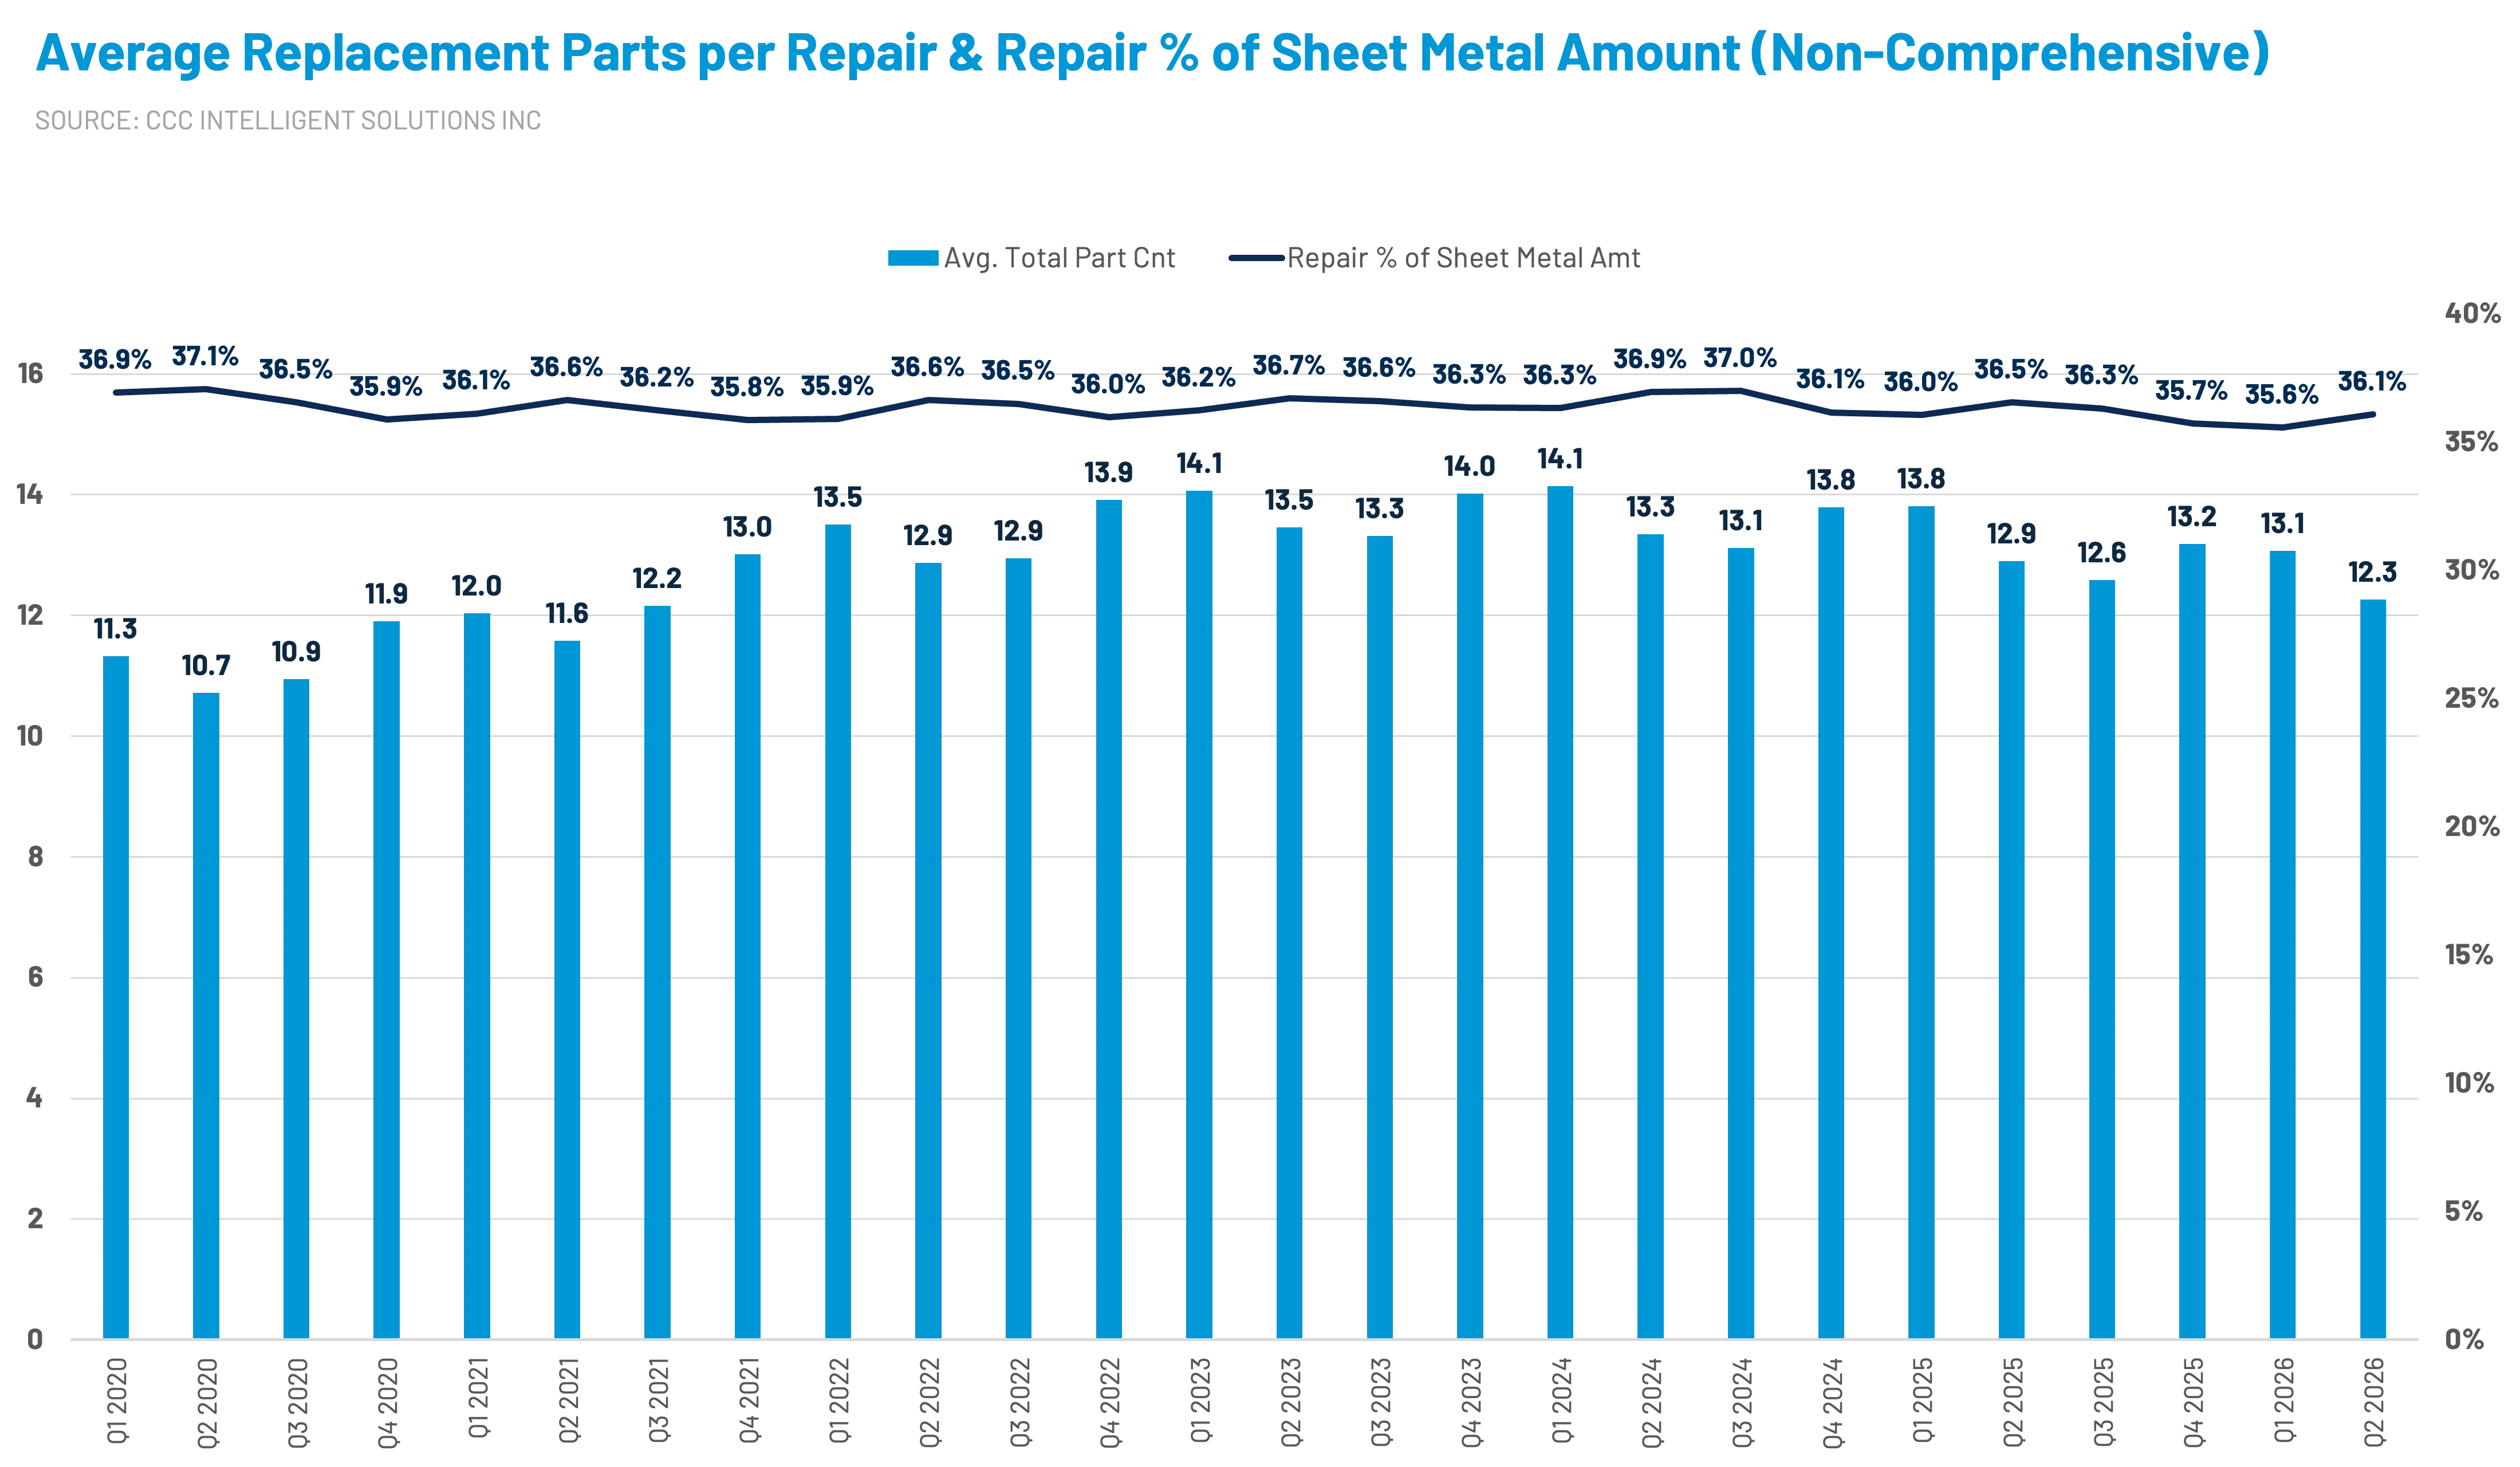
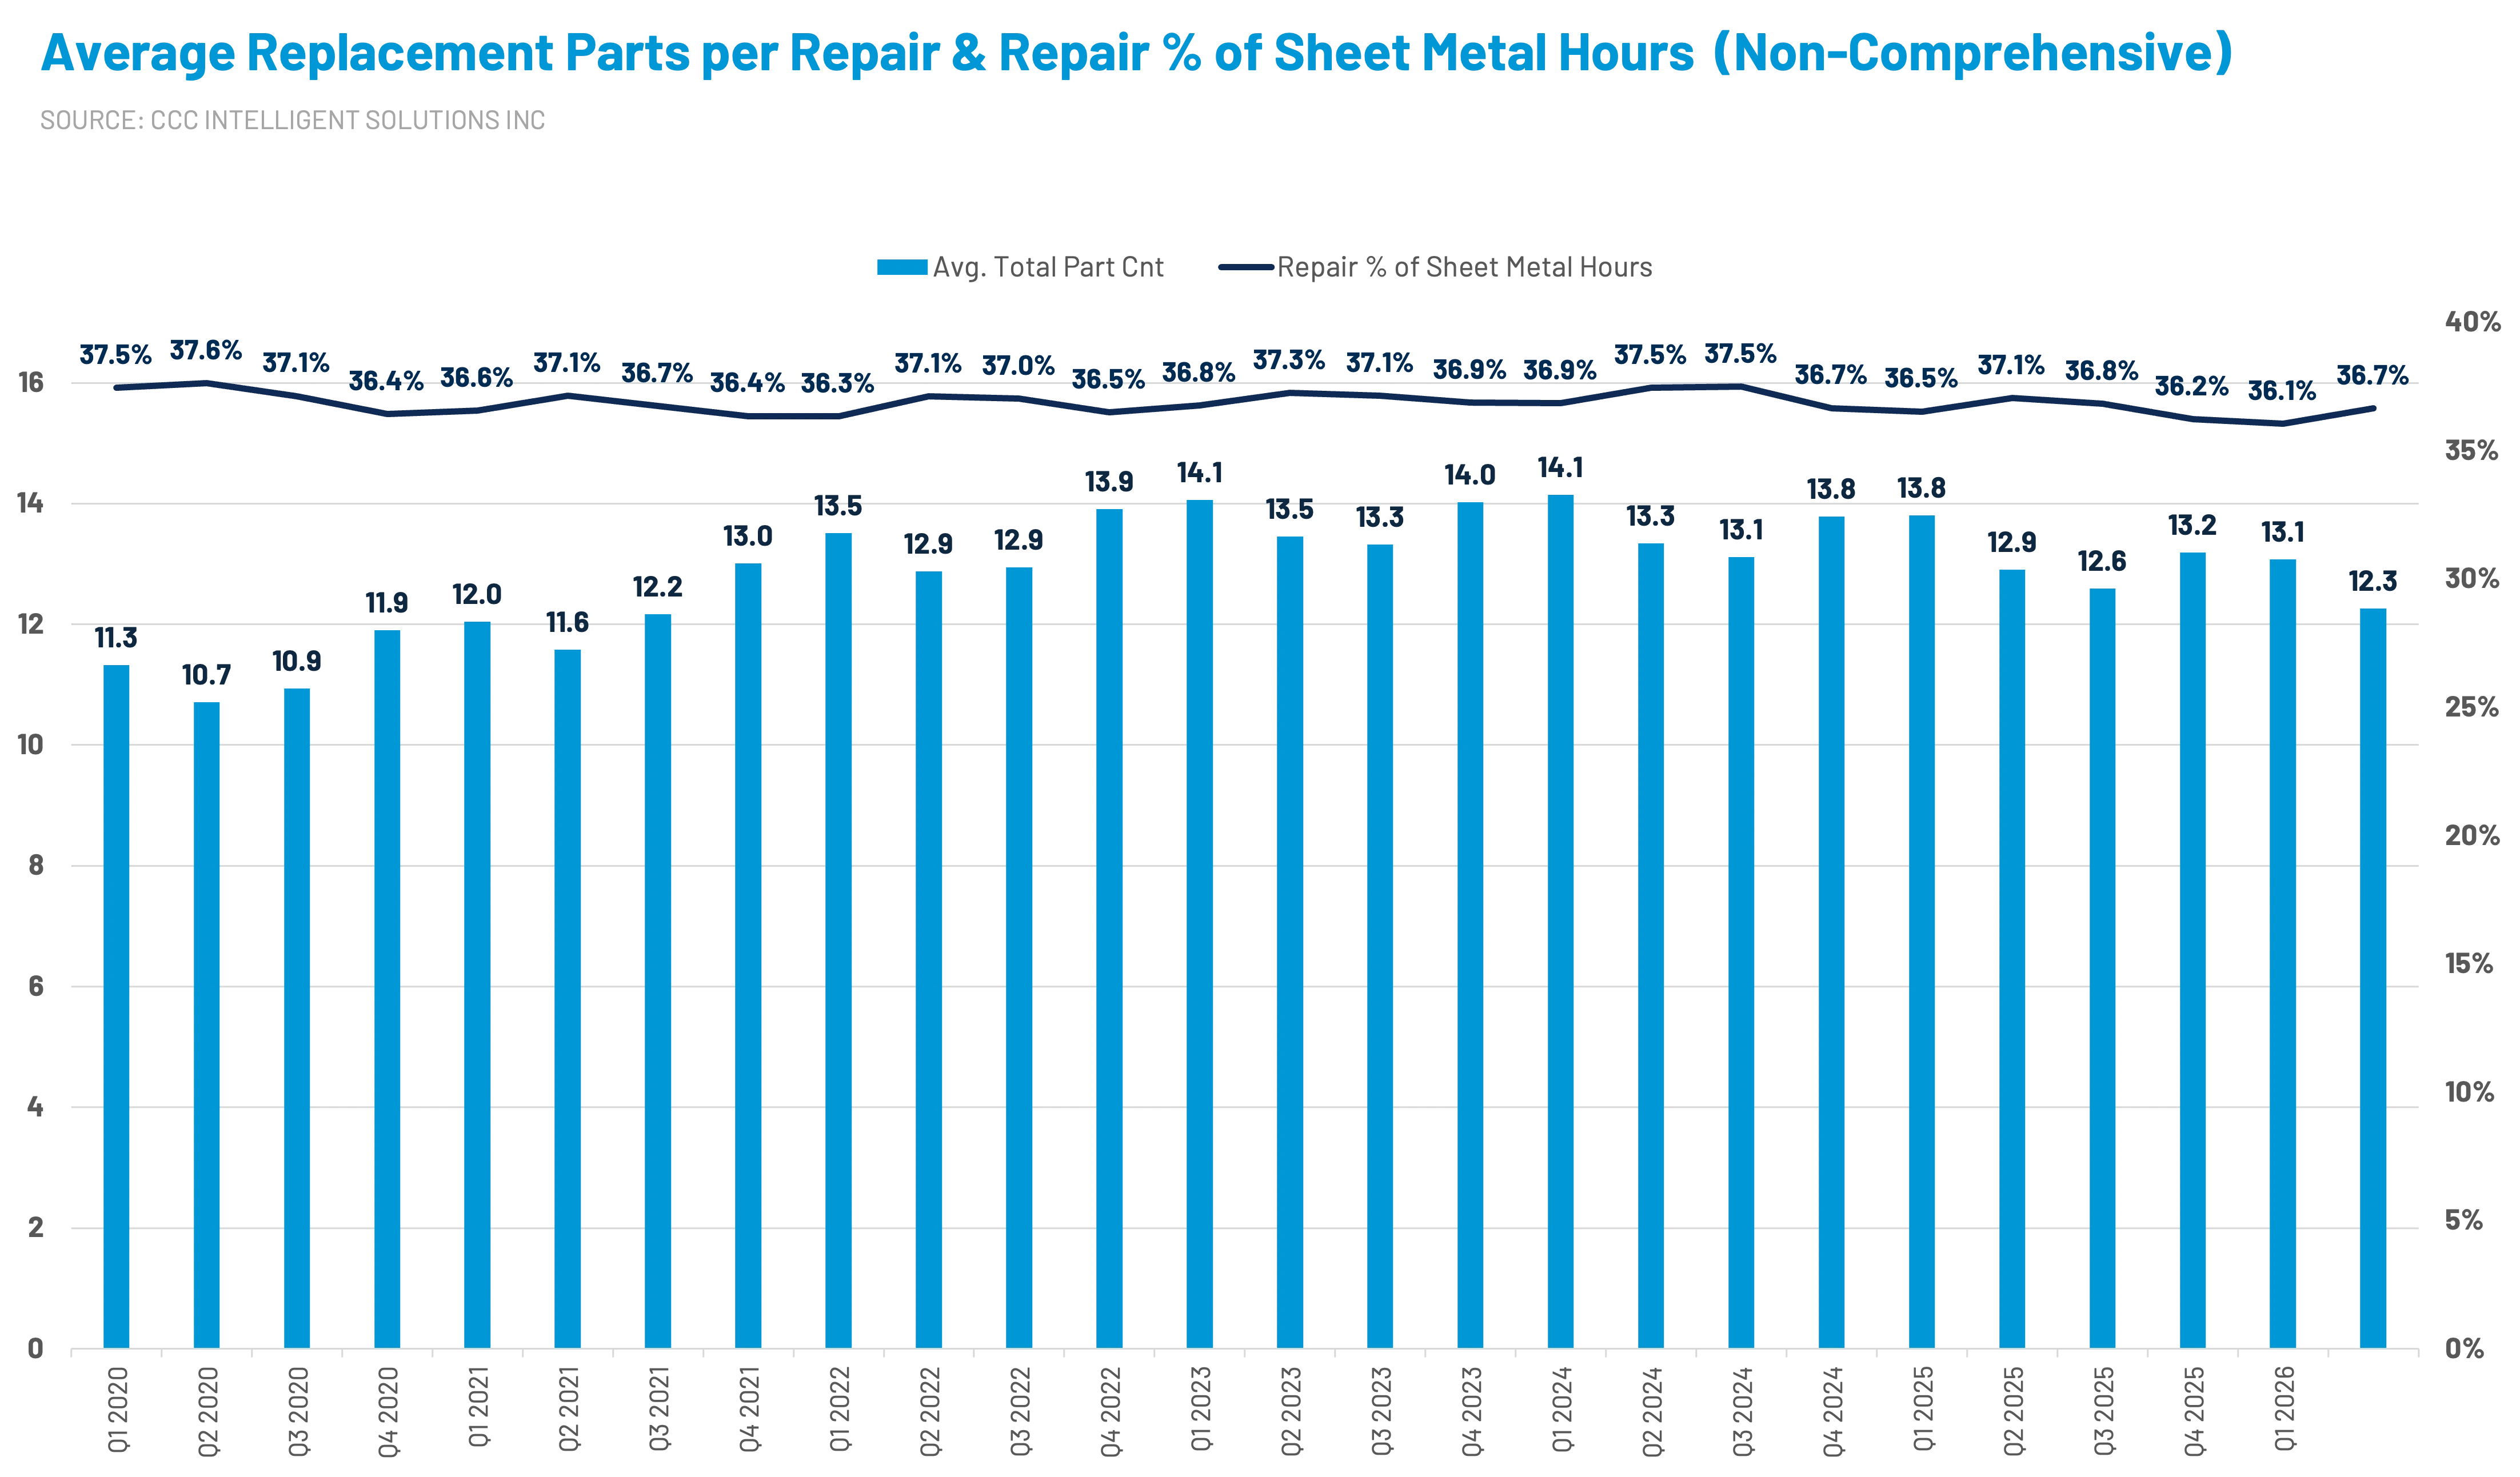
At the same time, claims contained fewer parts and labor hours than at their recent peaks in 2023 and 2024. Approximately 27% of Q1 non-comprehensive claims included more than 15 parts, and fewer than 32% exceeded 30 labor hours, with both measures shifting toward less-intensive repair bands. This distinction matters. Repair inflation may have normalized, but the underlying cost base remains more than 40% above 2020 levels.
3. Higher deductibles are becoming a structural feature of claim behavior
The share of repairable collision claims carrying deductibles of $1,000 or more reached 28.4% in the first half of 2026, up from 25.7% one year earlier and 20.3% in the first half of 2022.
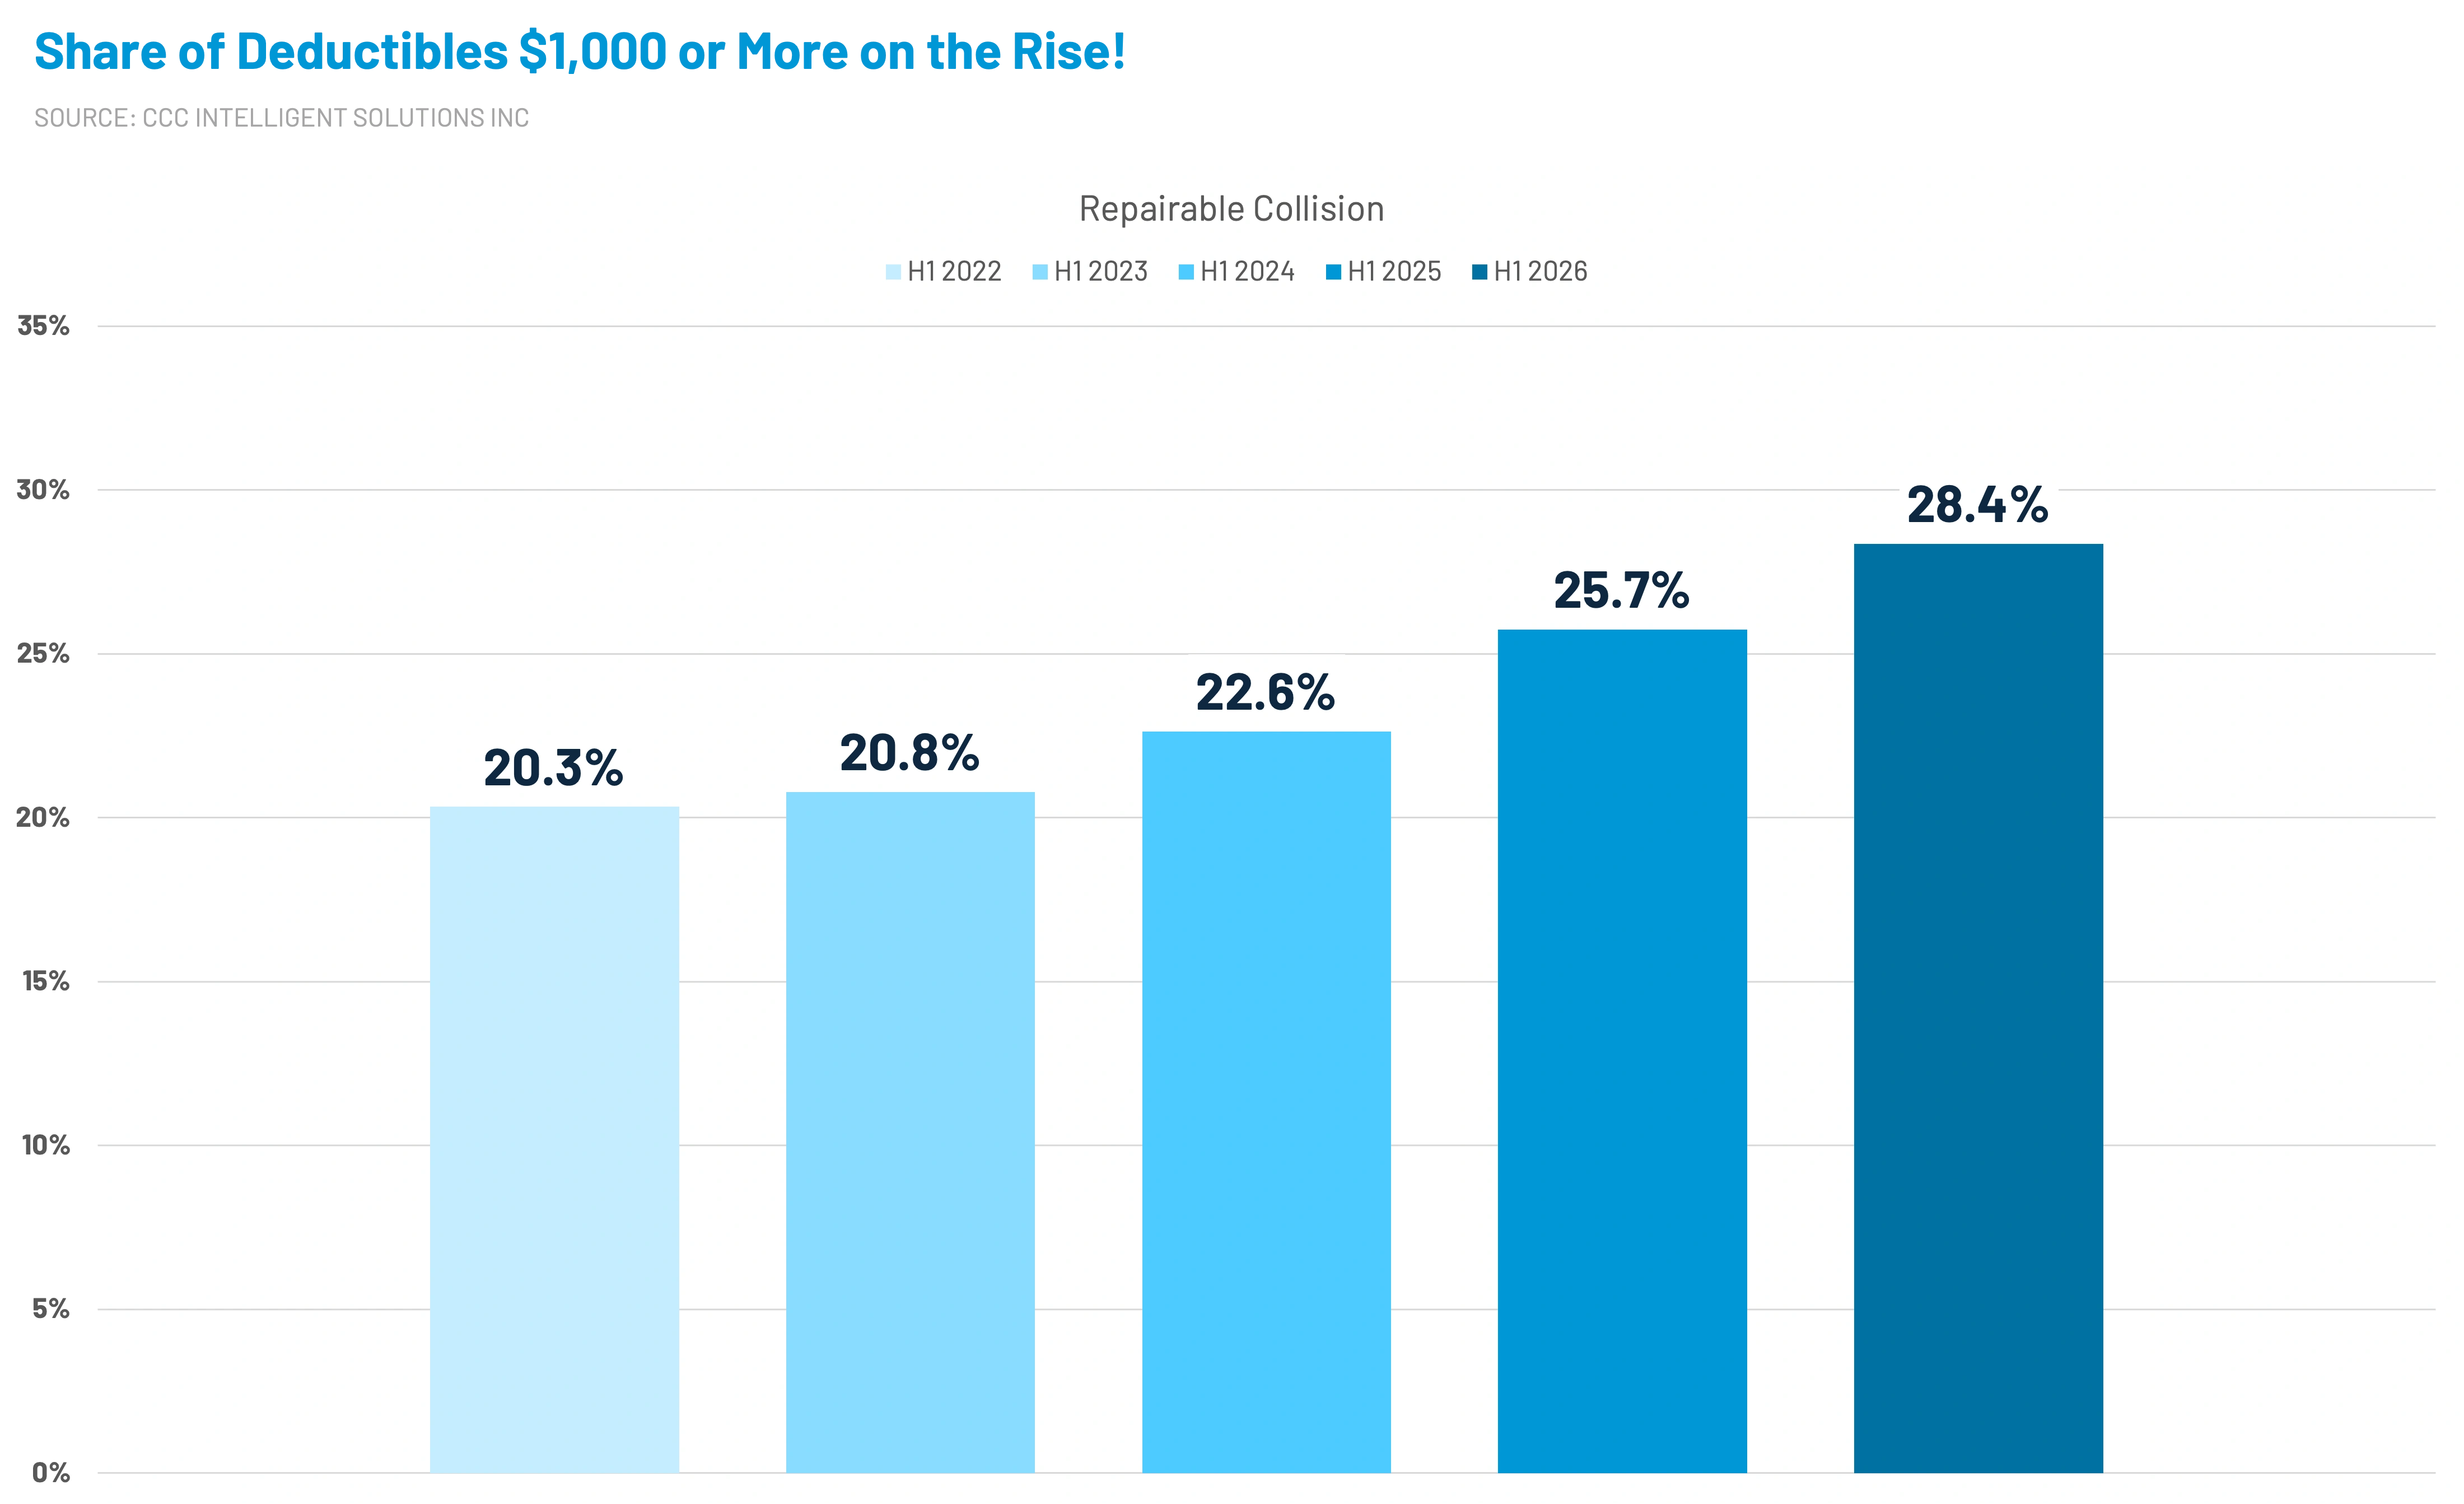
For consumers, a higher deductible can provide immediate premium relief. For the claims ecosystem, it changes the economics of filing. A $1,000 (or higher) deductible makes relatively minor damage easier to postpone, self-fund, or leave unrepaired. That removes smaller claims from the population and raises the apparent severity of those that remain, not to mention exacerbating the share of total losses.
H1 2026 data suggests that affordability-driven coverage decisions are becoming embedded in the claims mix rather than representing a temporary response to premium increases.
While a higher deductible can present some premium relief to consumers, $1,000 or higher deductibles can present another barrier to filing claims. According to a recent VIU by Hub Insurance survey found that 67% of policyholders say covering a $1,000 unexpected home or auto expense would be a struggle, with about 1 in 5 of them (21%) calling it “a serious hardship” or “significant struggle.”
4. Total loss frequency has reached another high
Through the second quarter of 2026, 23.5% of claims across all loss categories were flagged as total losses, up 0.8 percentage points year over year. Non-comprehensive total loss frequency reached 24.1%. Both results extend the climb from the 2022 lows of 18.2% and 19.4%, respectively.
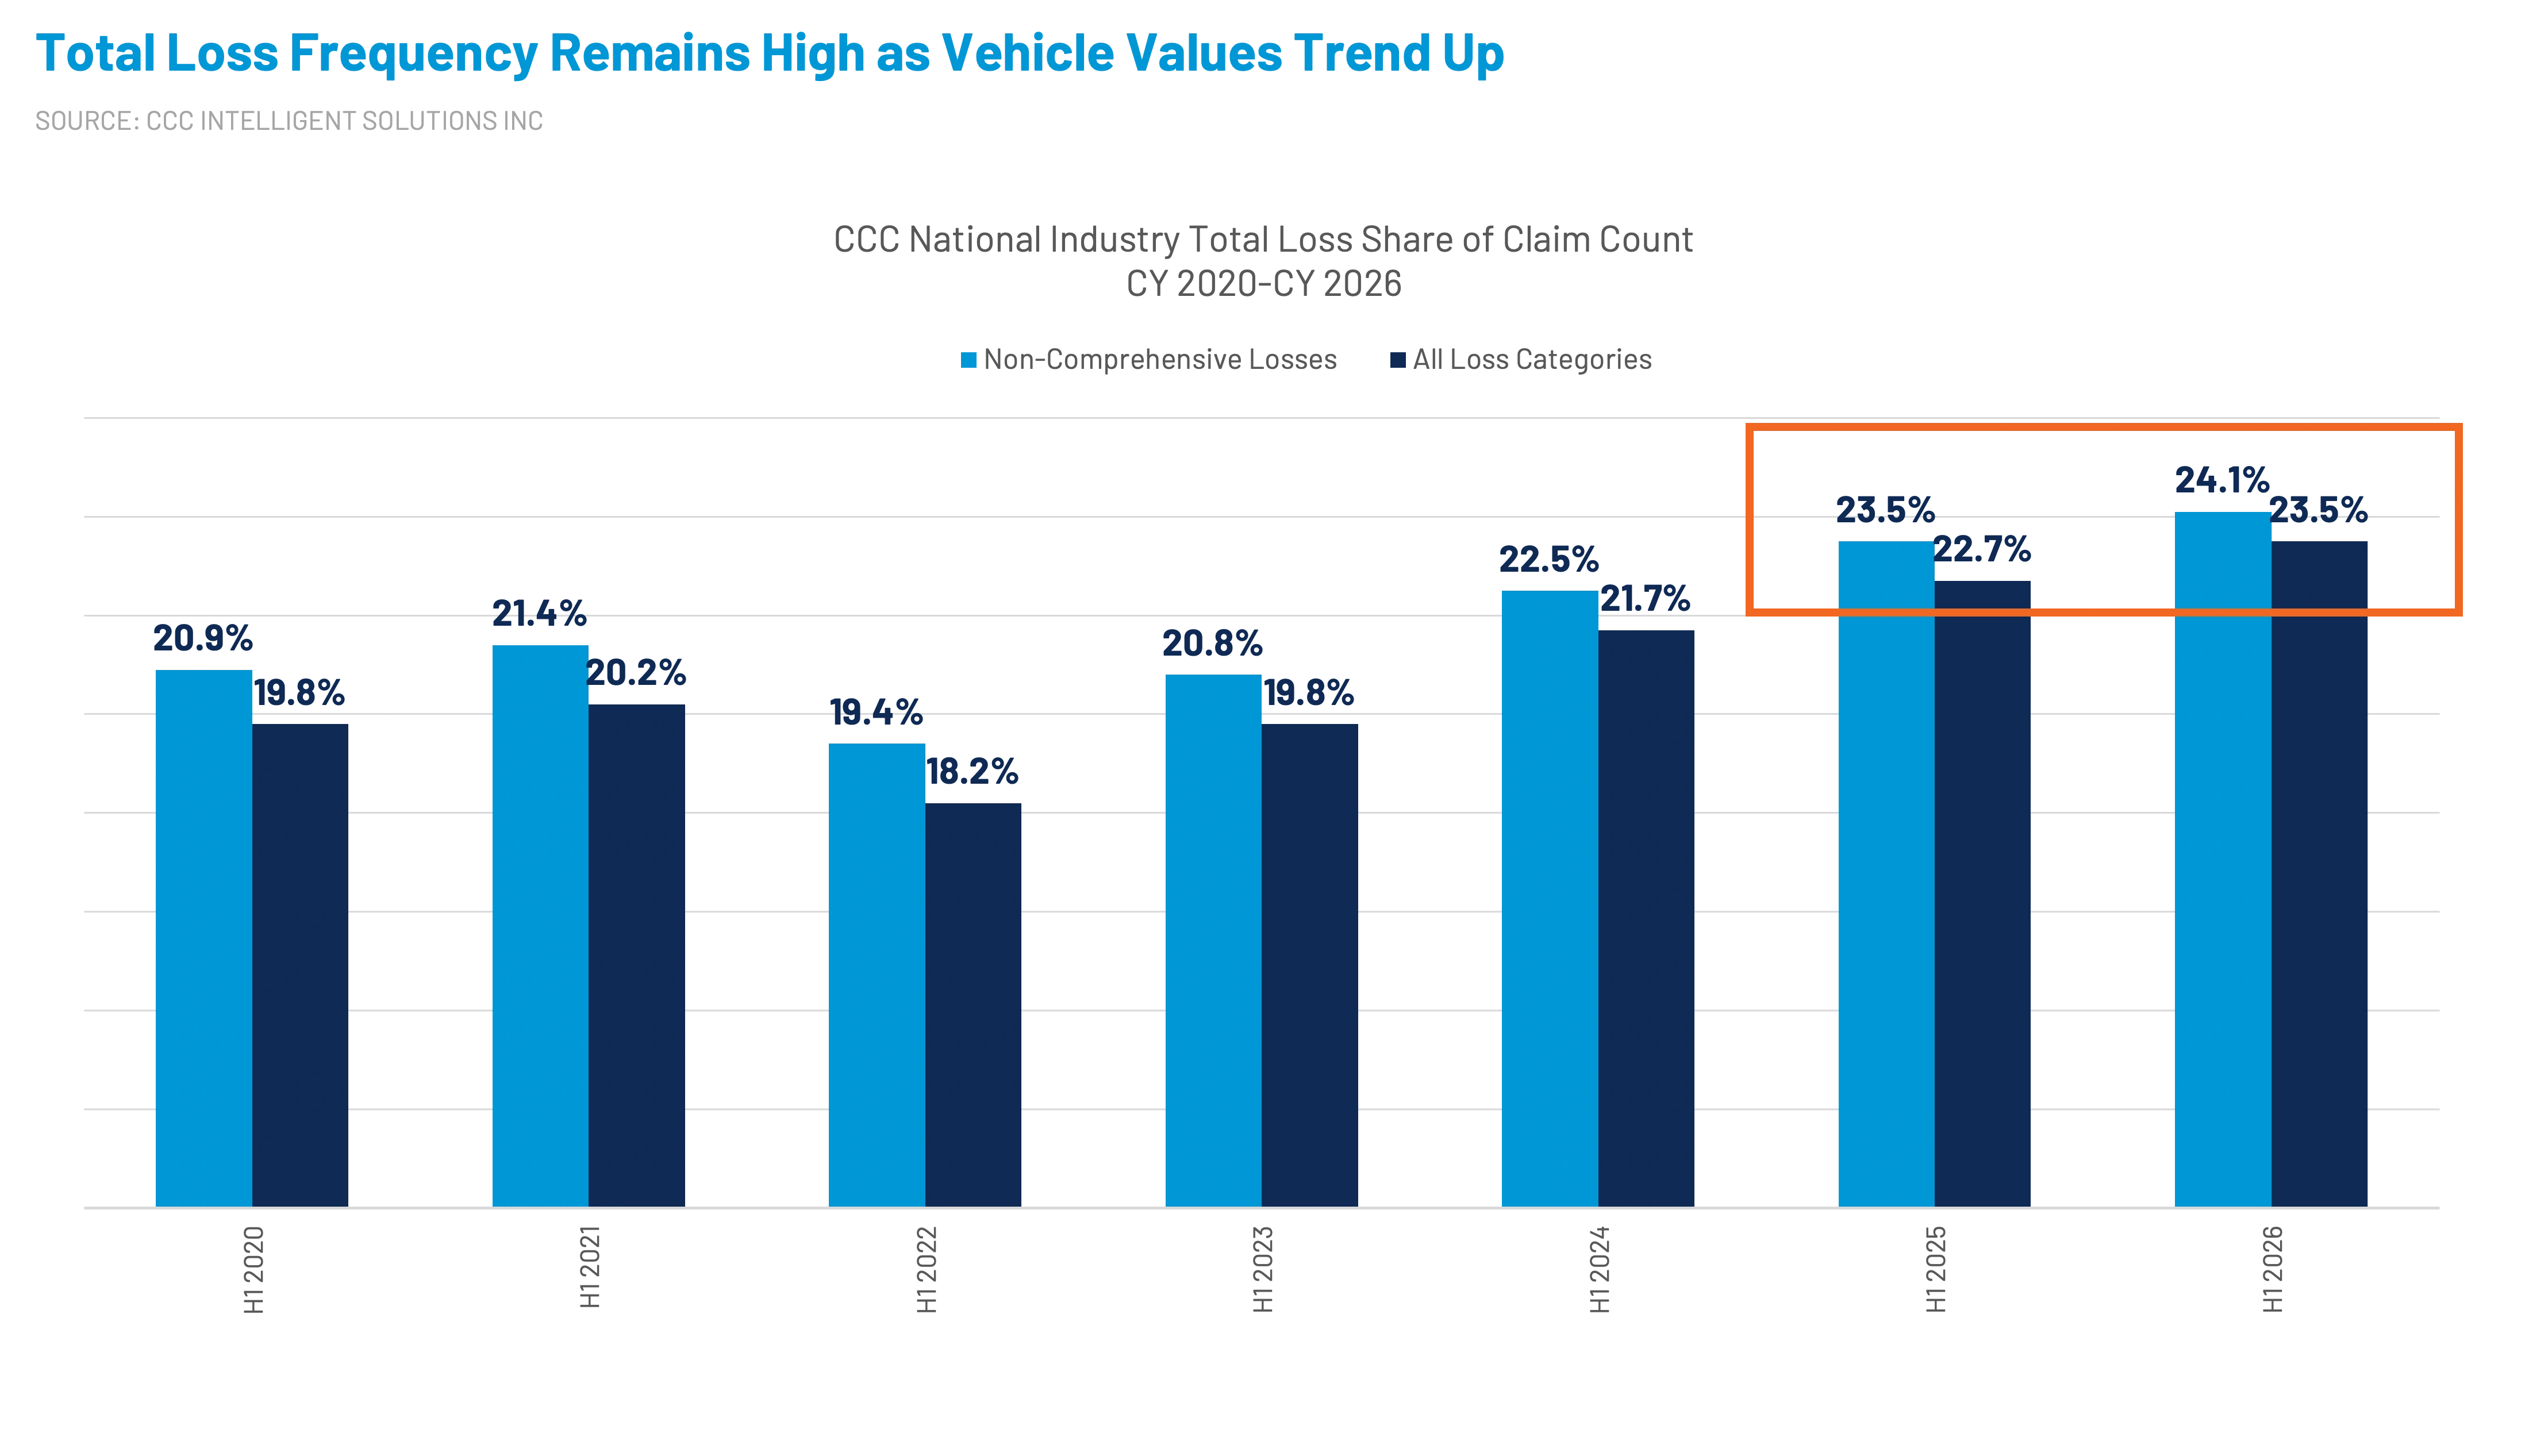
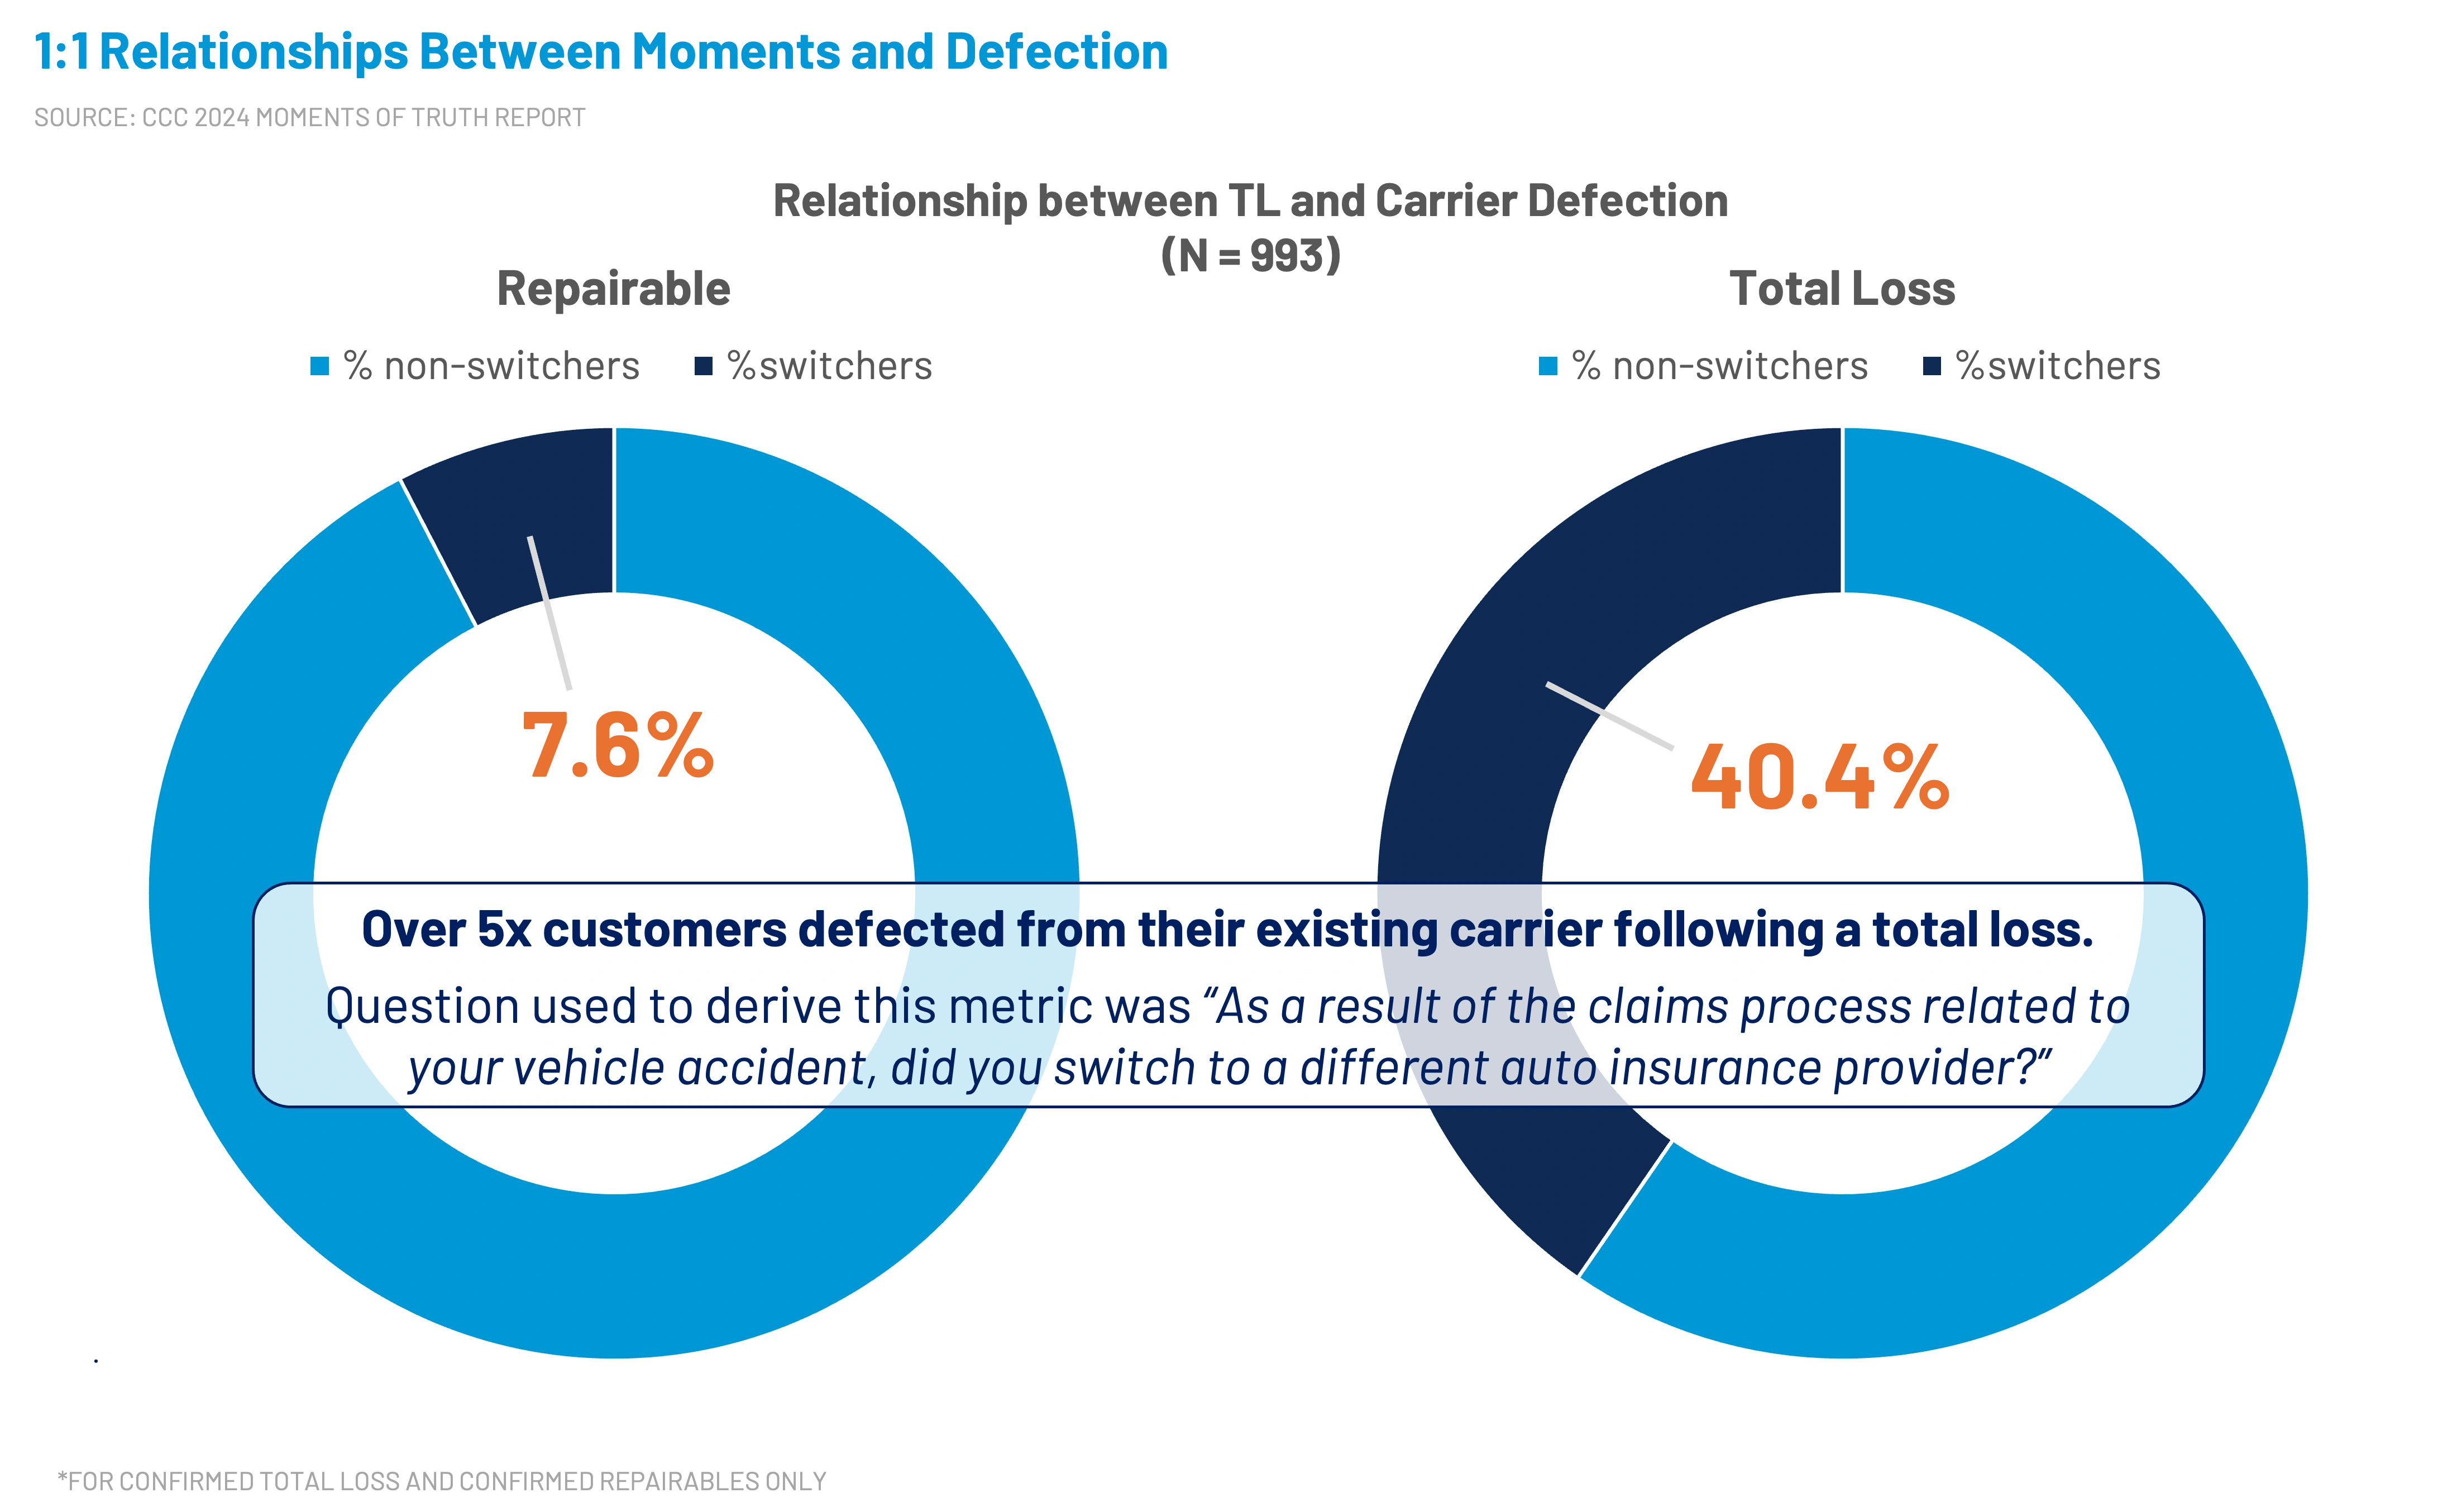
Higher total loss frequency is partly a product of loss economics, but filing behavior also affects the denominator. When lower-severity first-party claims are not reported, fewer small repairable claims remain to dilute the total loss share. The customer implications are material. CCC's Moments of Truth study found that 40.4% of insureds with a confirmed total loss switched carriers, compared with 7.6% following a repairable claim. As personal auto competition increases, total loss handling becomes not only an operational challenge but also a retention issue.
5. The aging vehicle fleet is now visible throughout the loss mix
Vehicles aged seven years or older represented 74.3% of total loss valuations in the first half of 2026 with vehicles between seven and 12 years old alone accounted for approximately 41%, compared with 33.4% in 2020.
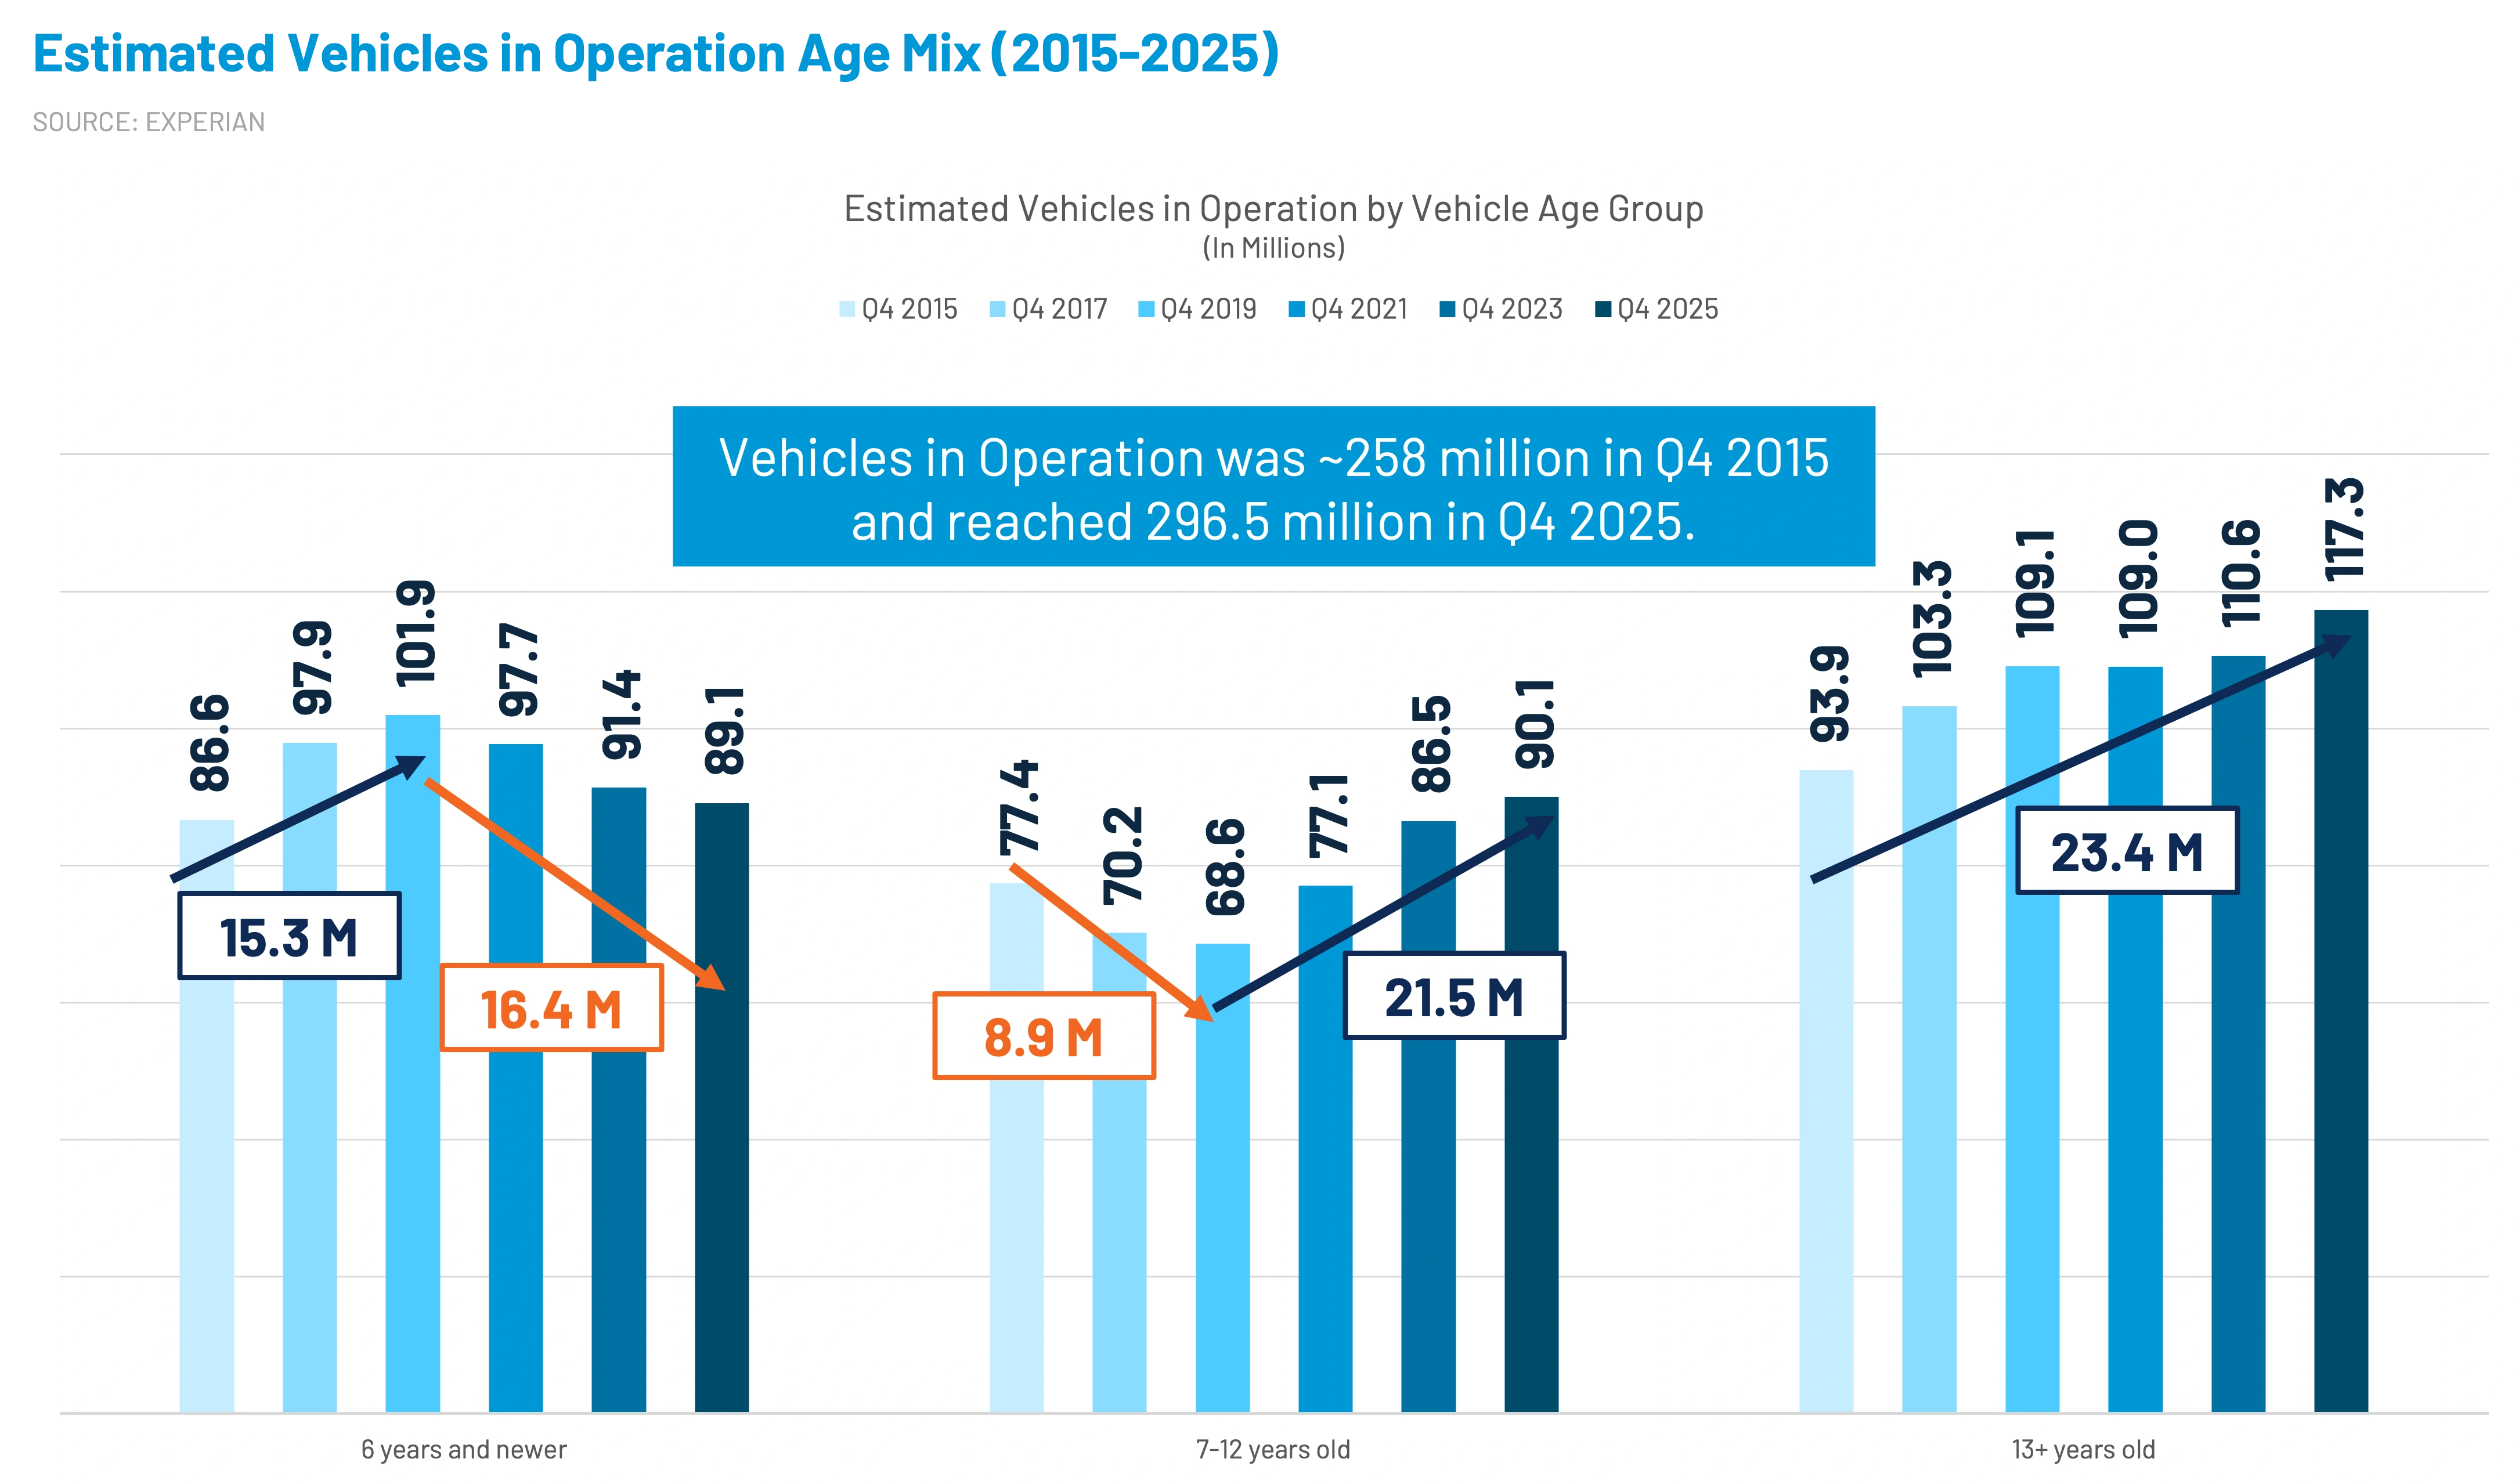
This mirrors a broader change in the U.S. vehicle population. Vehicles in operation grew from approximately 258 million in 2015 to 296.5 million in 2025, but vehicles 13 years or older increased by 23.4 million while the population six years or newer ended the decade at 89.1 million. An older fleet does not automatically mean a simpler claim. Older vehicles carry lower adjusted values and can cross total loss thresholds quickly, even after damage that leaves them operable. At the same time, many still contain technology that requires diagnostics or specialized procedures.
6. Driveable total losses expose conflicting vehicle values and repair costs
The share of driveable vehicles flagged as total losses reached 11.2% through the first half of 2026, up from 10.3% one year earlier and 6.3% in 2022. Historically, over 80% of all driveable vehicles flagged total loss are 7 years or older. Non-driveable total loss frequency also rose, reaching 52.5% across all loss categories.
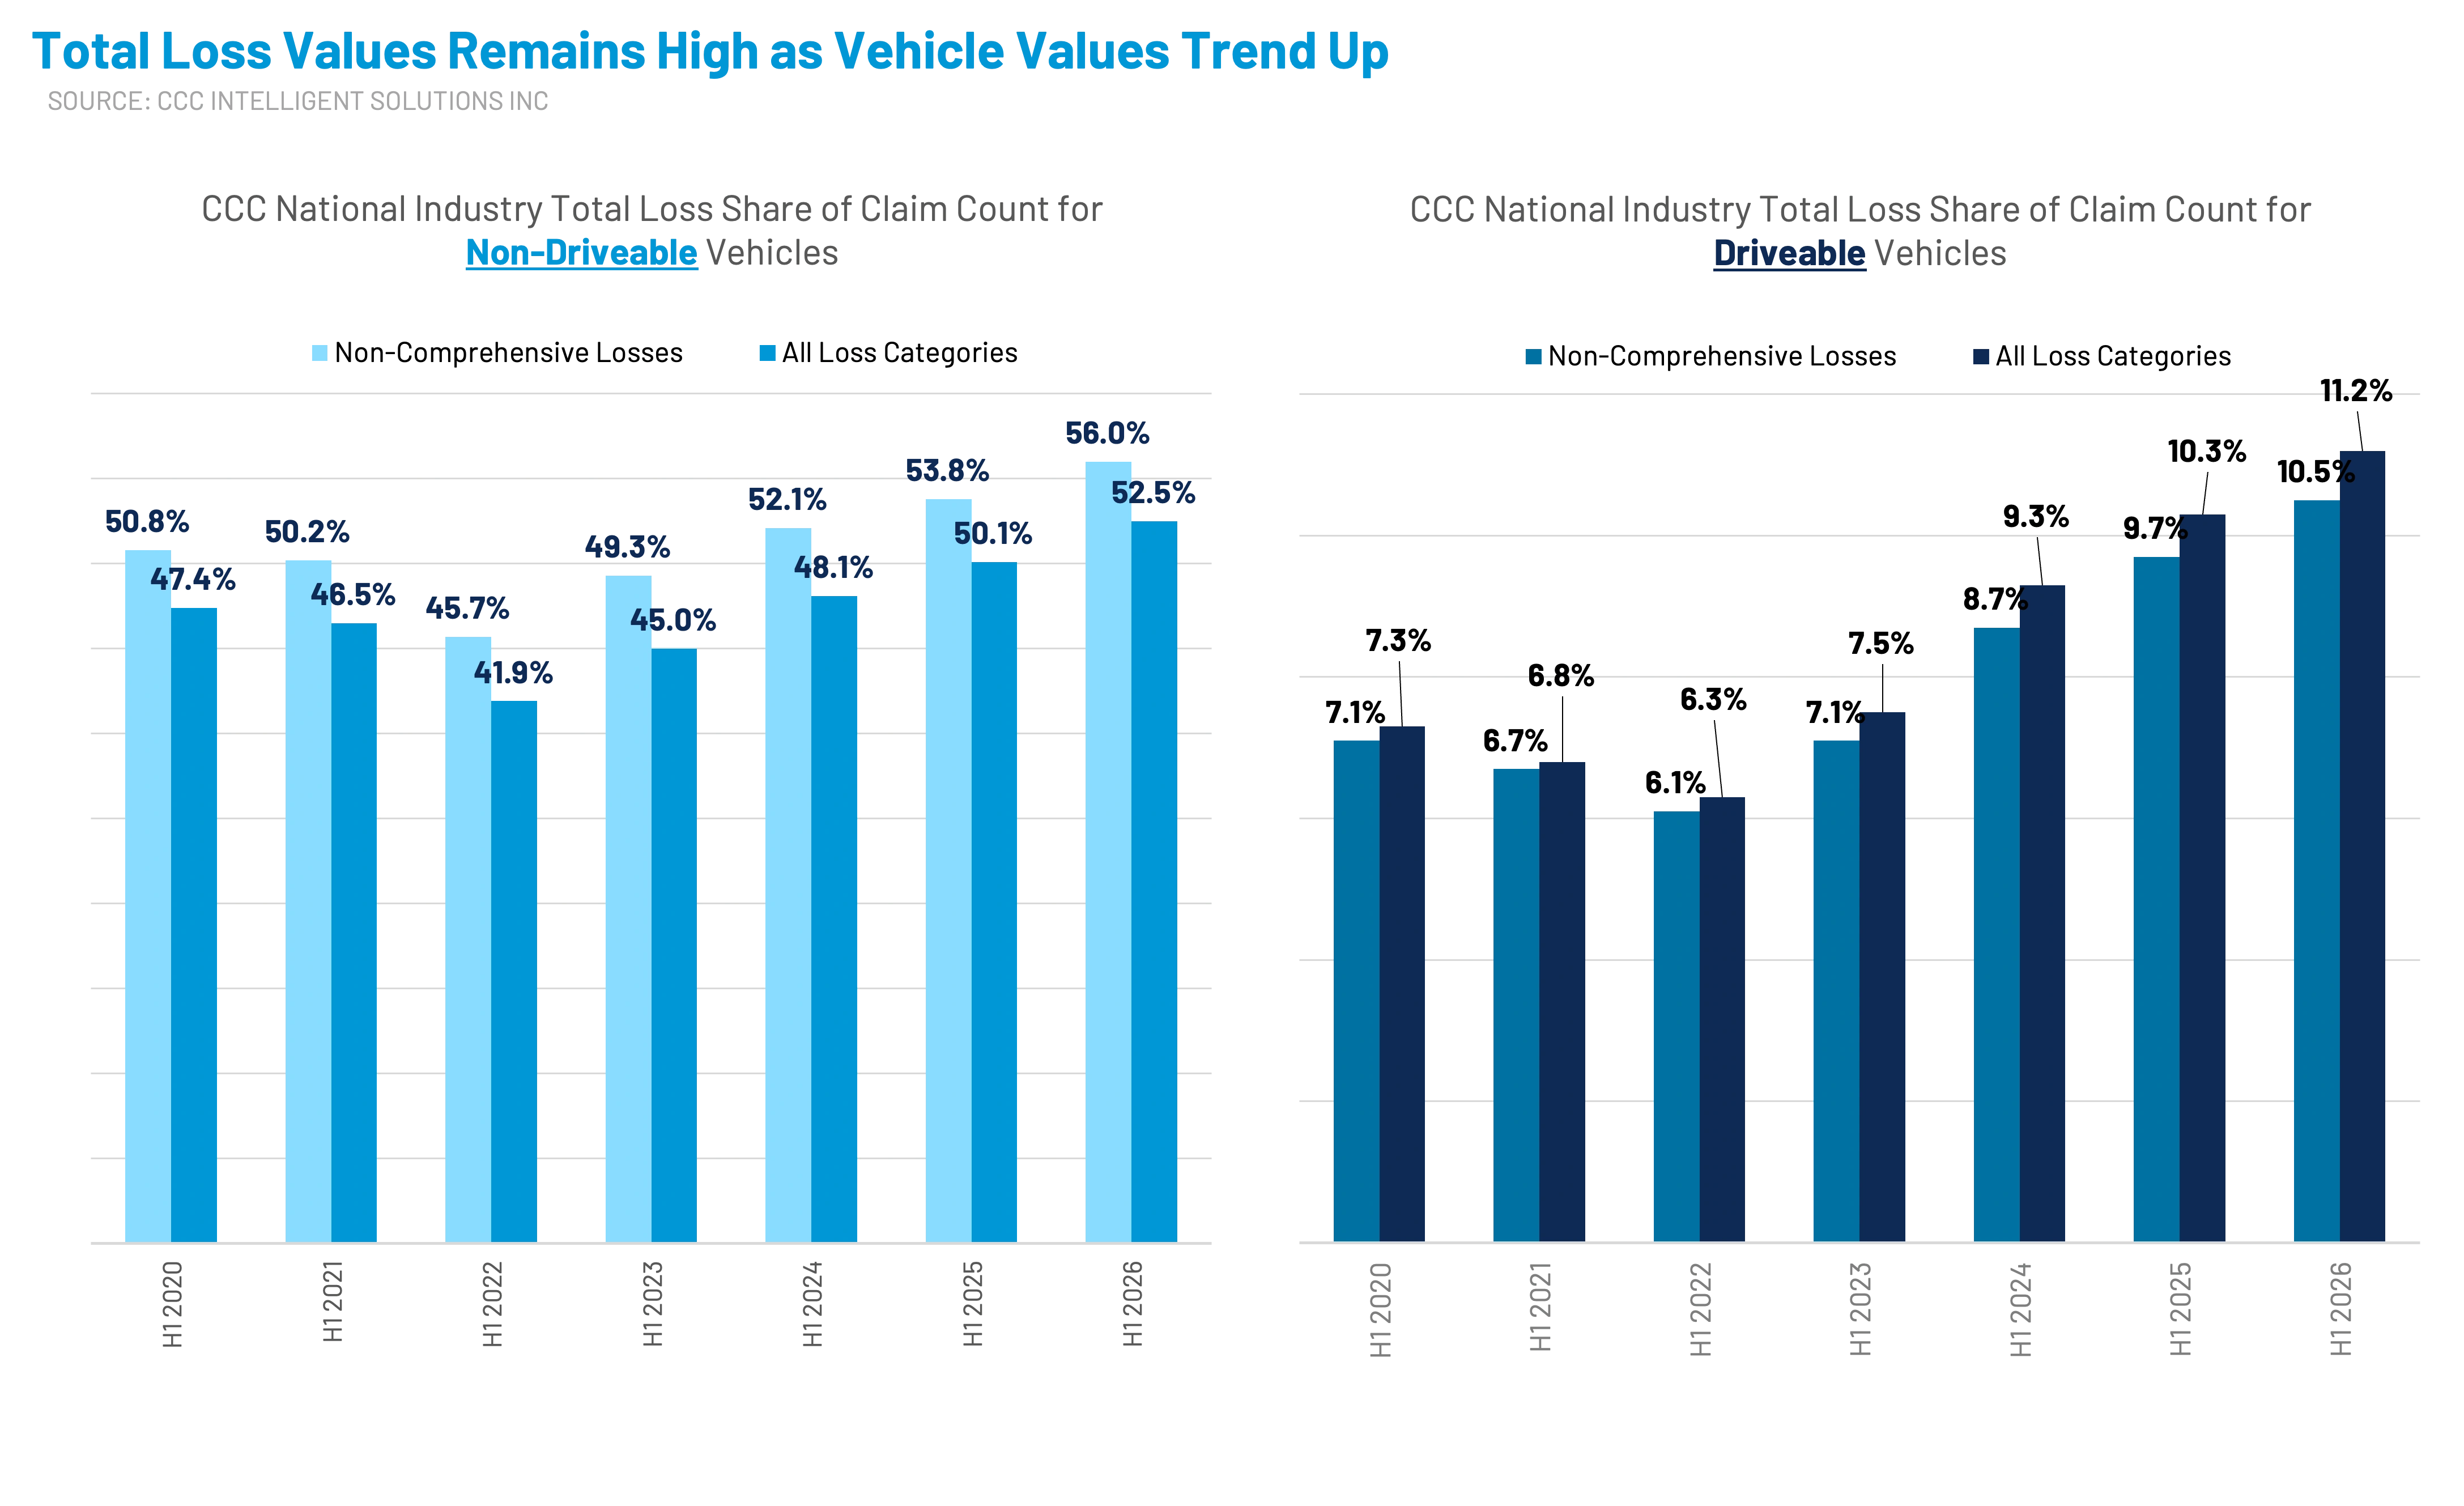
The driveable trend is particularly revealing because these vehicles can still arrive under their own power. The total loss determination is therefore largely an economic decision: the projected repair cost has become too high relative to the vehicle's value.
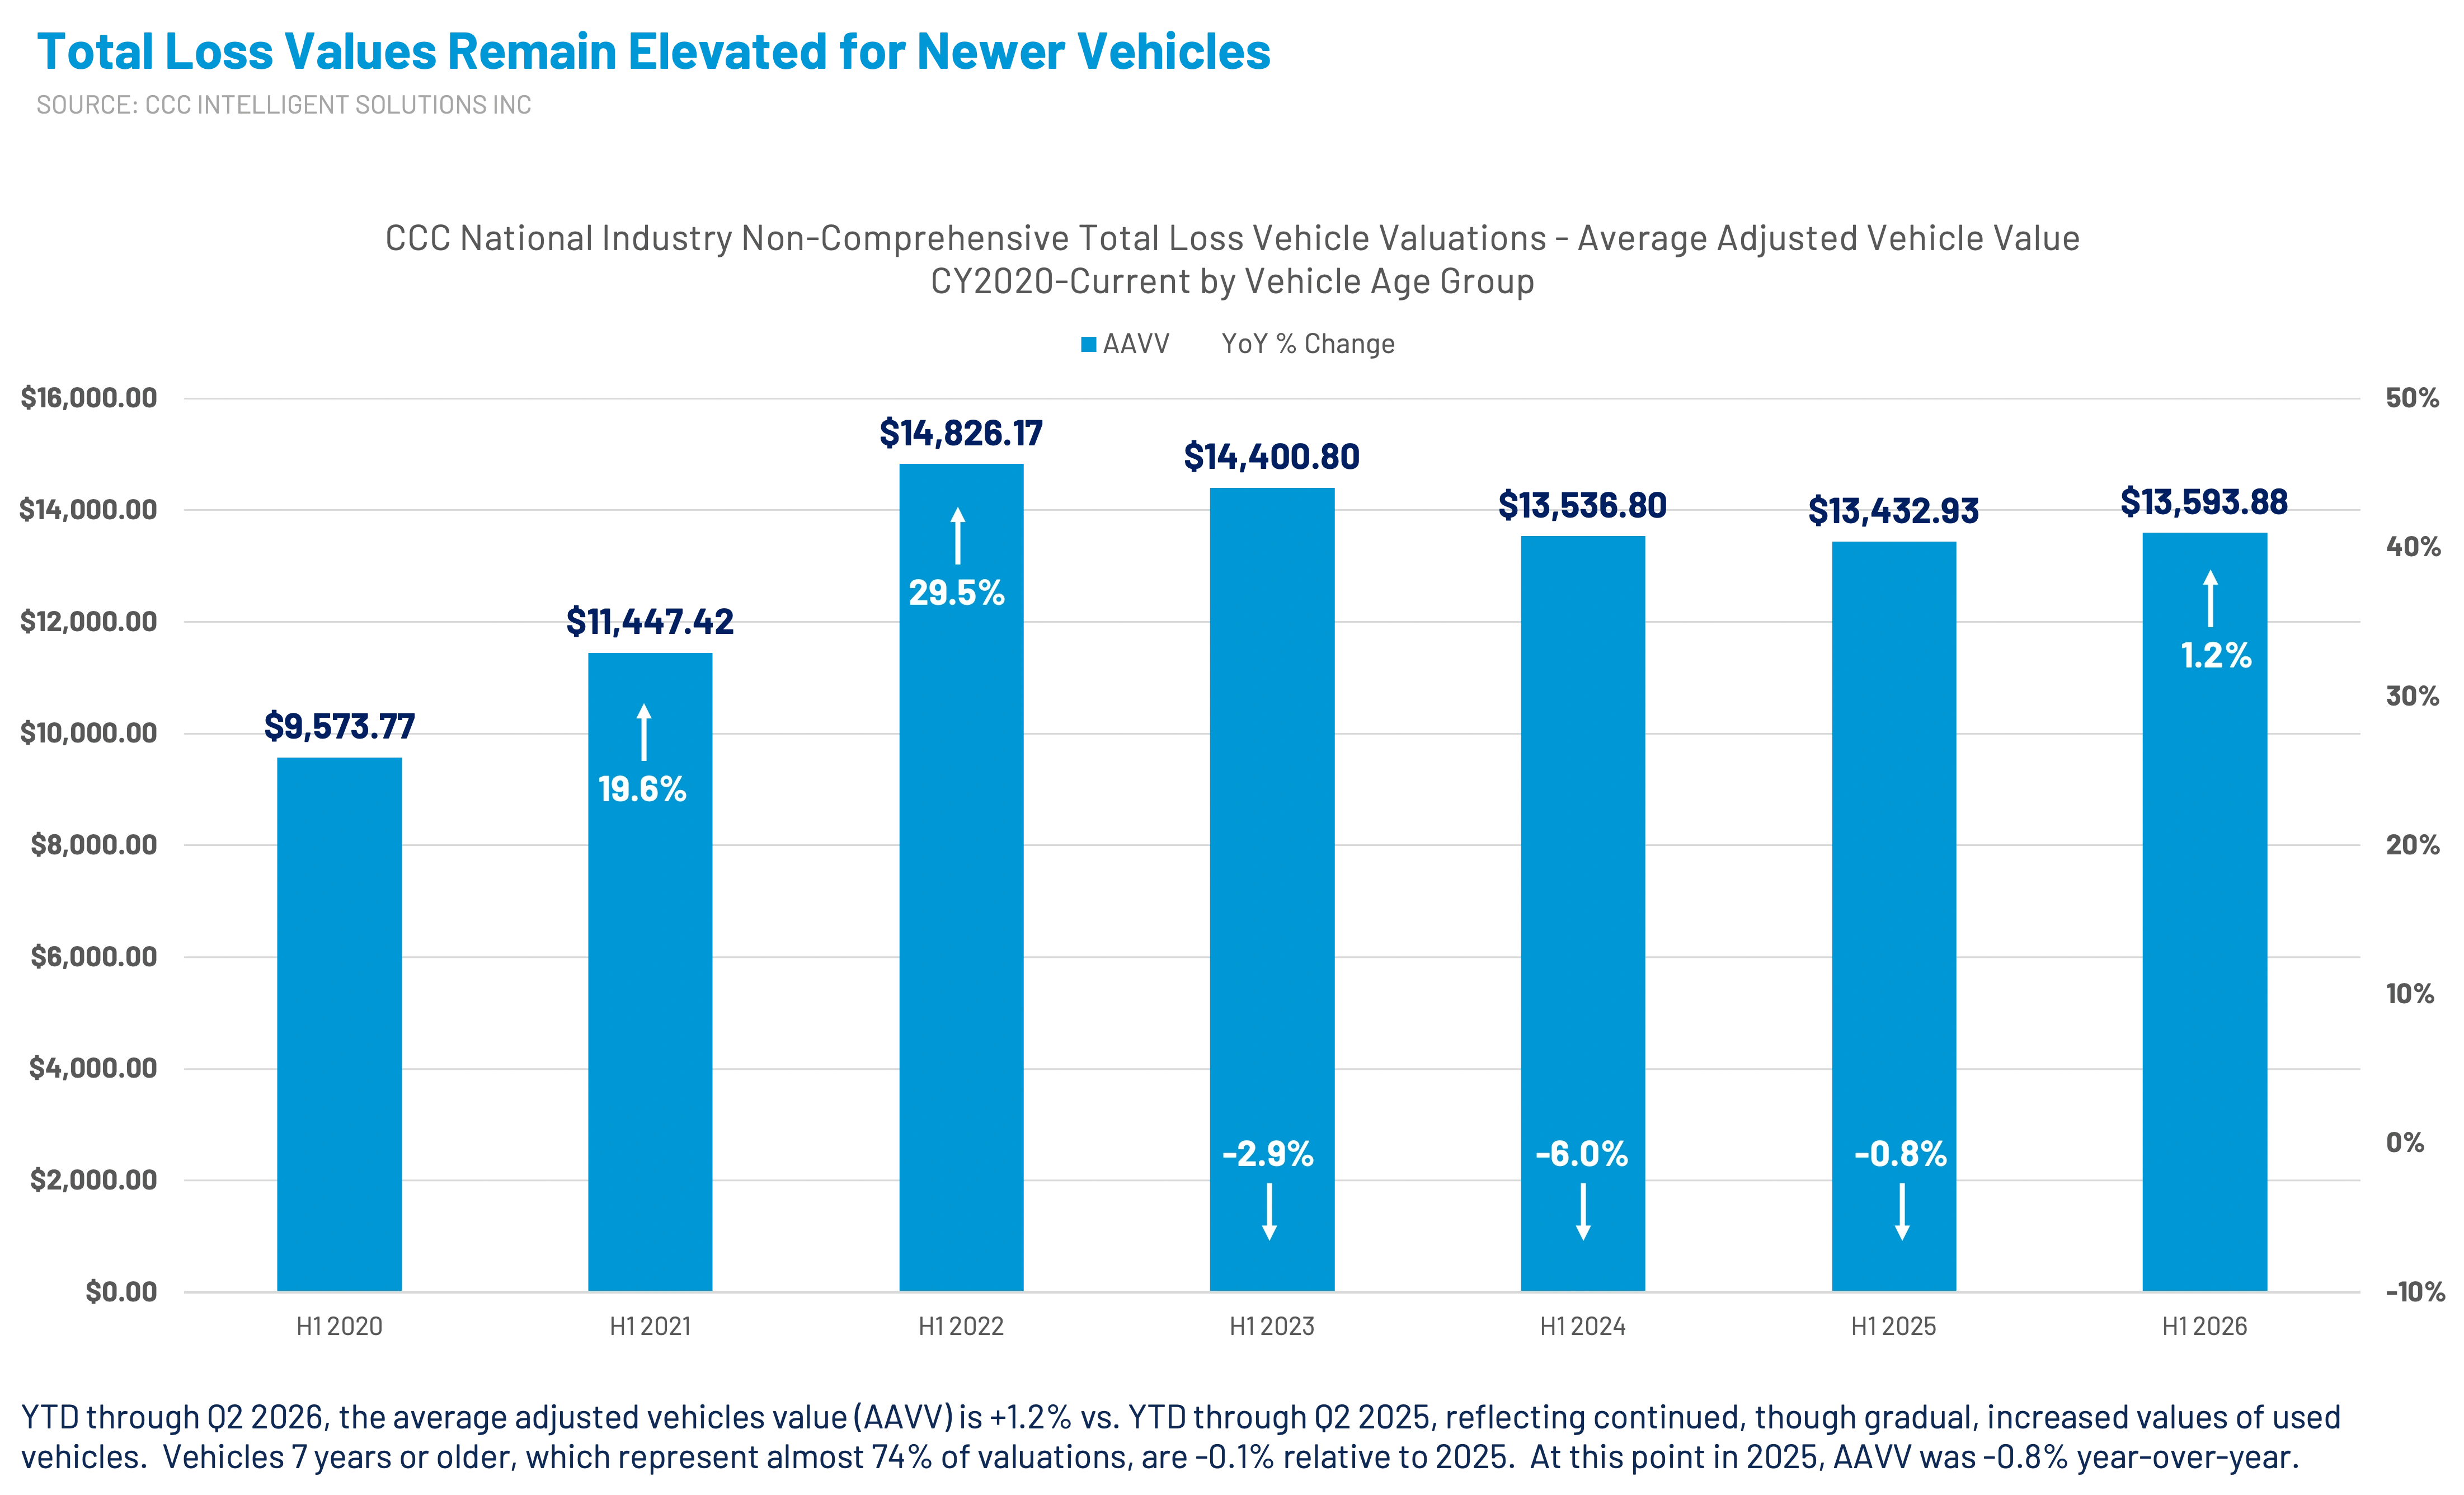
Average adjusted vehicle value increased 1.2% to $13,594 through the second quarter, but vehicles seven years or older, nearly three-quarters of valuations, experienced essentially flat values. Modest value recovery is not enough to offset the interaction of an older fleet and a repair-cost base that remains significantly above pre-pandemic levels.
7. Self-pay repair is becoming a meaningful parallel market
Self-pay represented 26% of repair orders in the first half of 2026, up 0.5 percentage points year over year, with an average ticket of approximately $1,941. By comparison, the average repairable insurance claim was $4,821. More than 71% of self-pay orders were below $2,000, while approximately 75% of insurance repairable claims exceeded that amount.
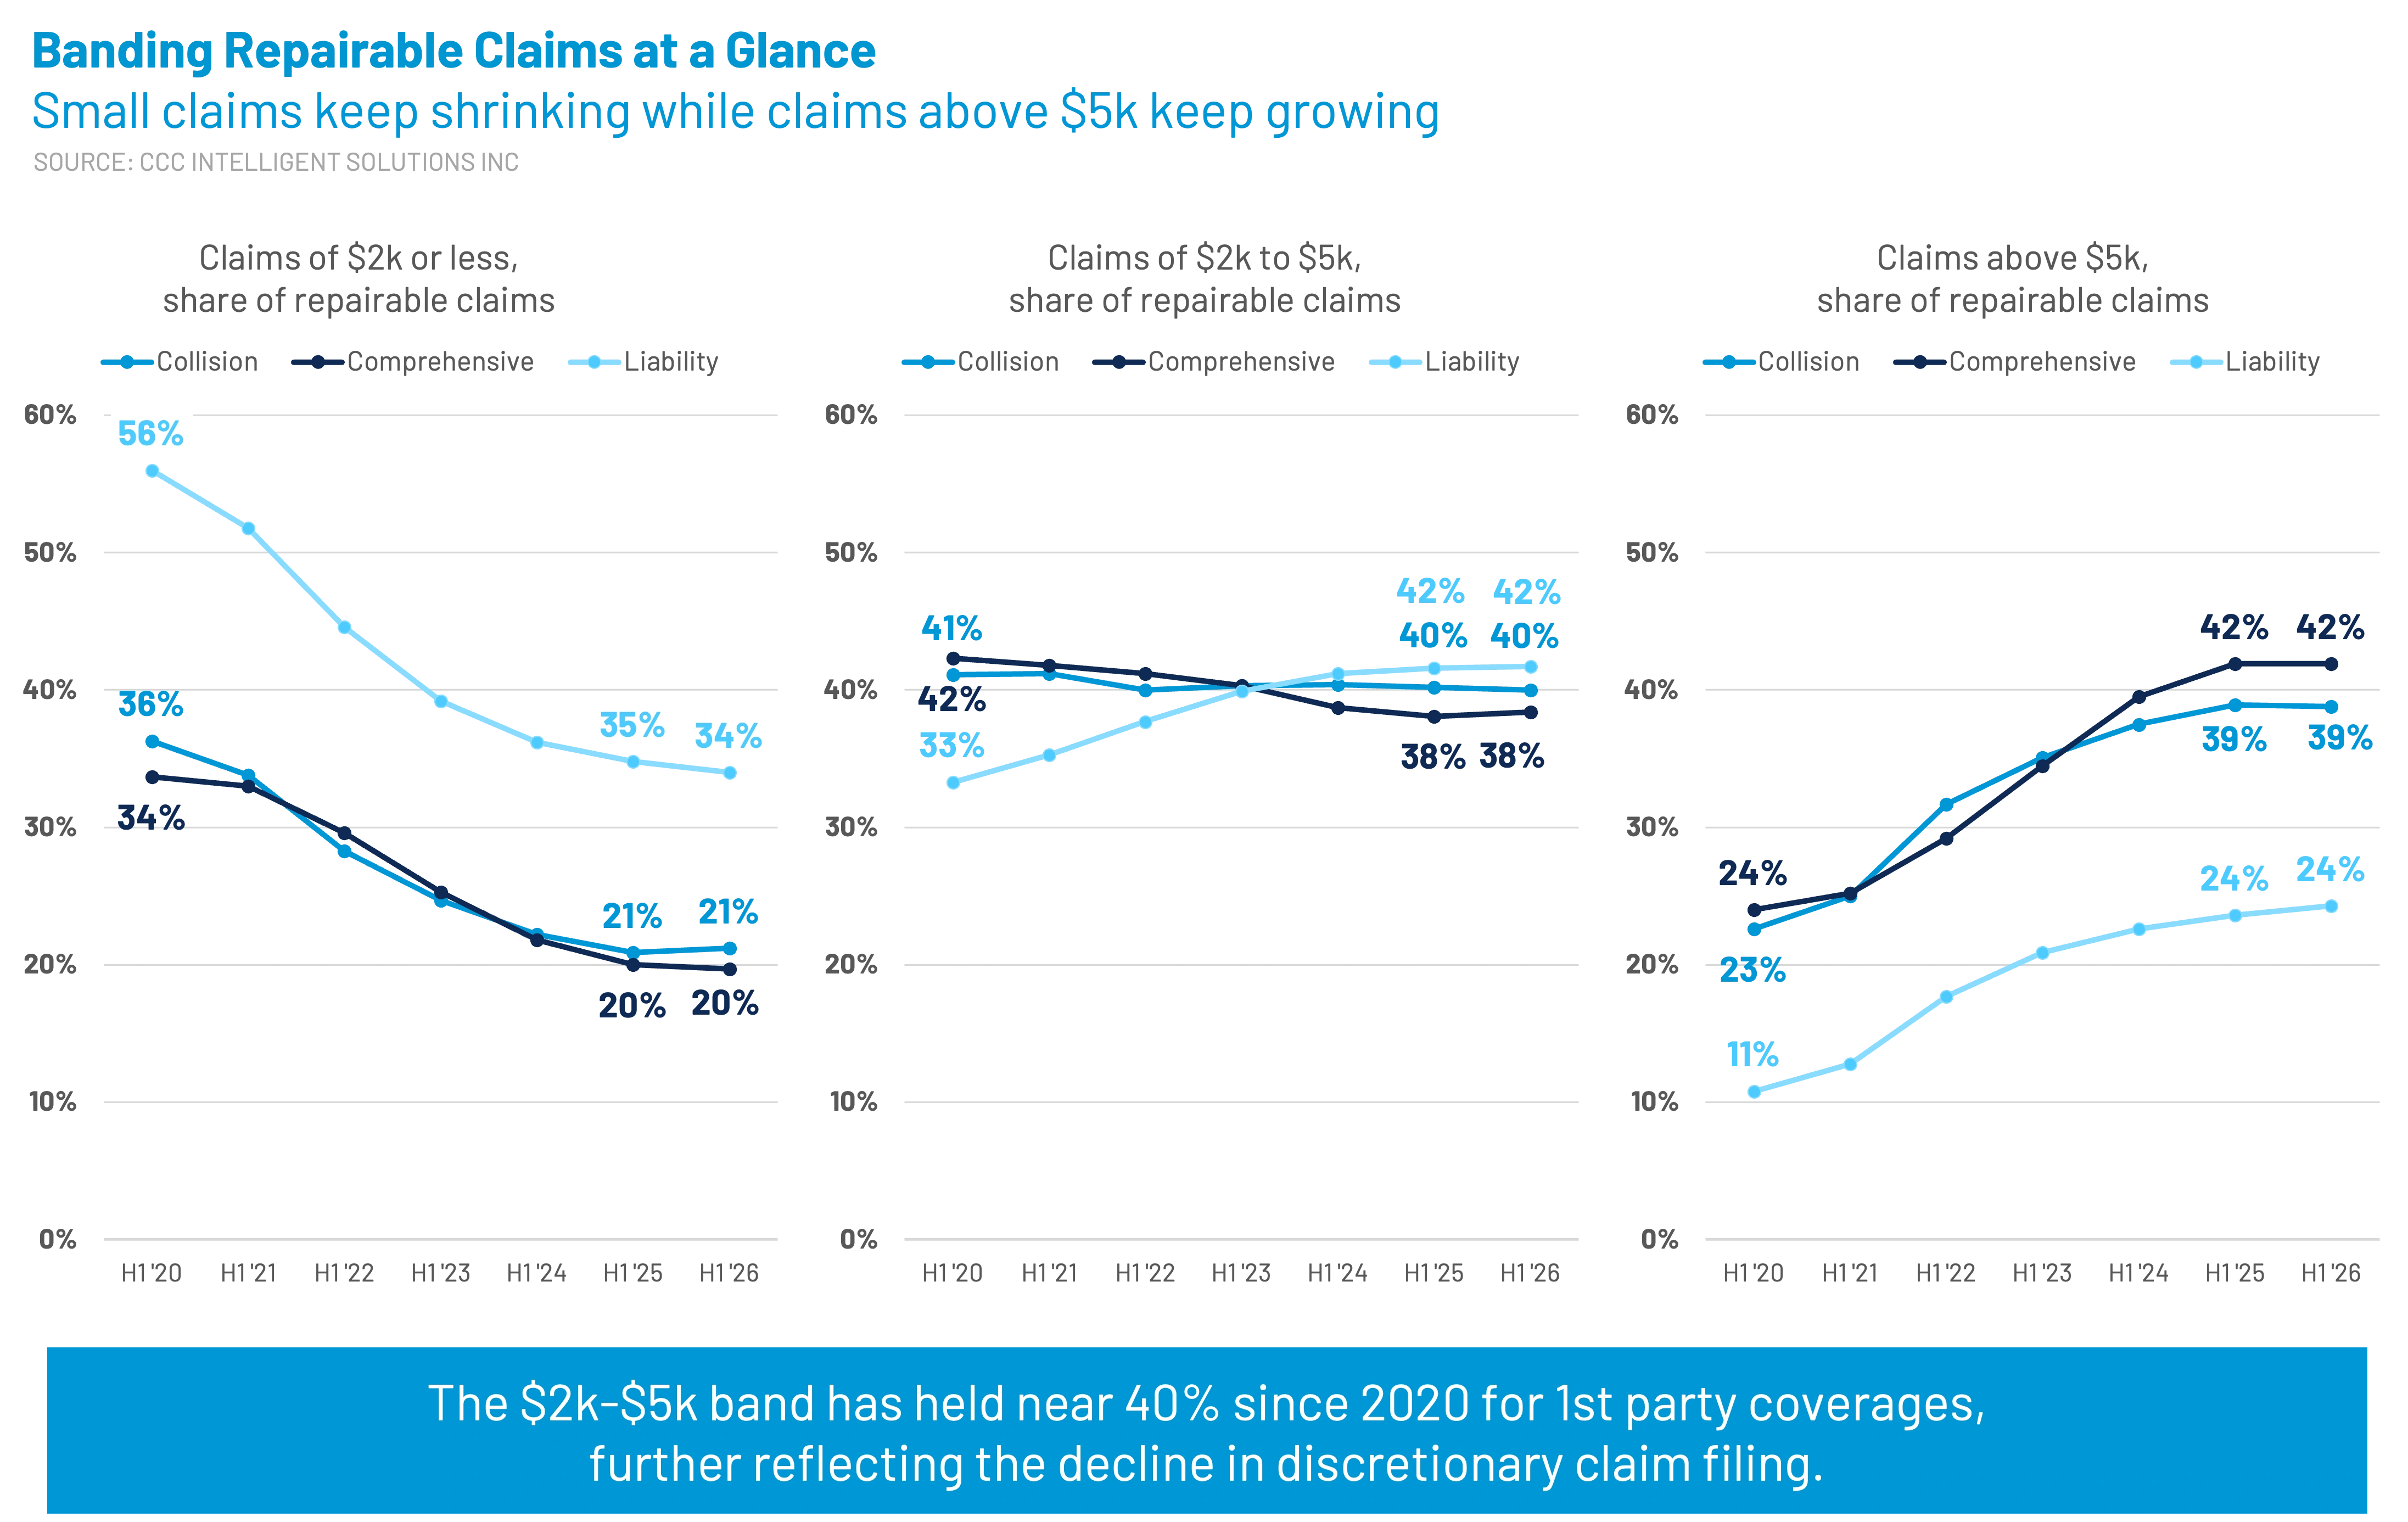
As self-pay repairs continue to gradually increase in share of repair orders, the corresponding share of lower-dollar repairable claims continues to decrease across all coverages. Approximately 20% of claims for repairable first-party coverages (collision and comprehensive) are less than $2,000, down from around 35% in 2020. Liability (third party property damage) claims have declined by over 20 percentage points during that same period. Notably, the share of repairable claims between $2,000 and $5,000 shrank slightly for collision and comprehensive coverages, while liability increased by 9 points.
This is representative of both the inflationary effect on less-discretionary liability claims and the discretionary nature of first party claims that fall into repair bands less than $5,000, and particularly those that are less than $3,000. (Repairable collision claims that are less than $3,000, for example, have decreased by over 18 percentage points since 2020 and now represent only 36.6% of the repairable collision mix.)
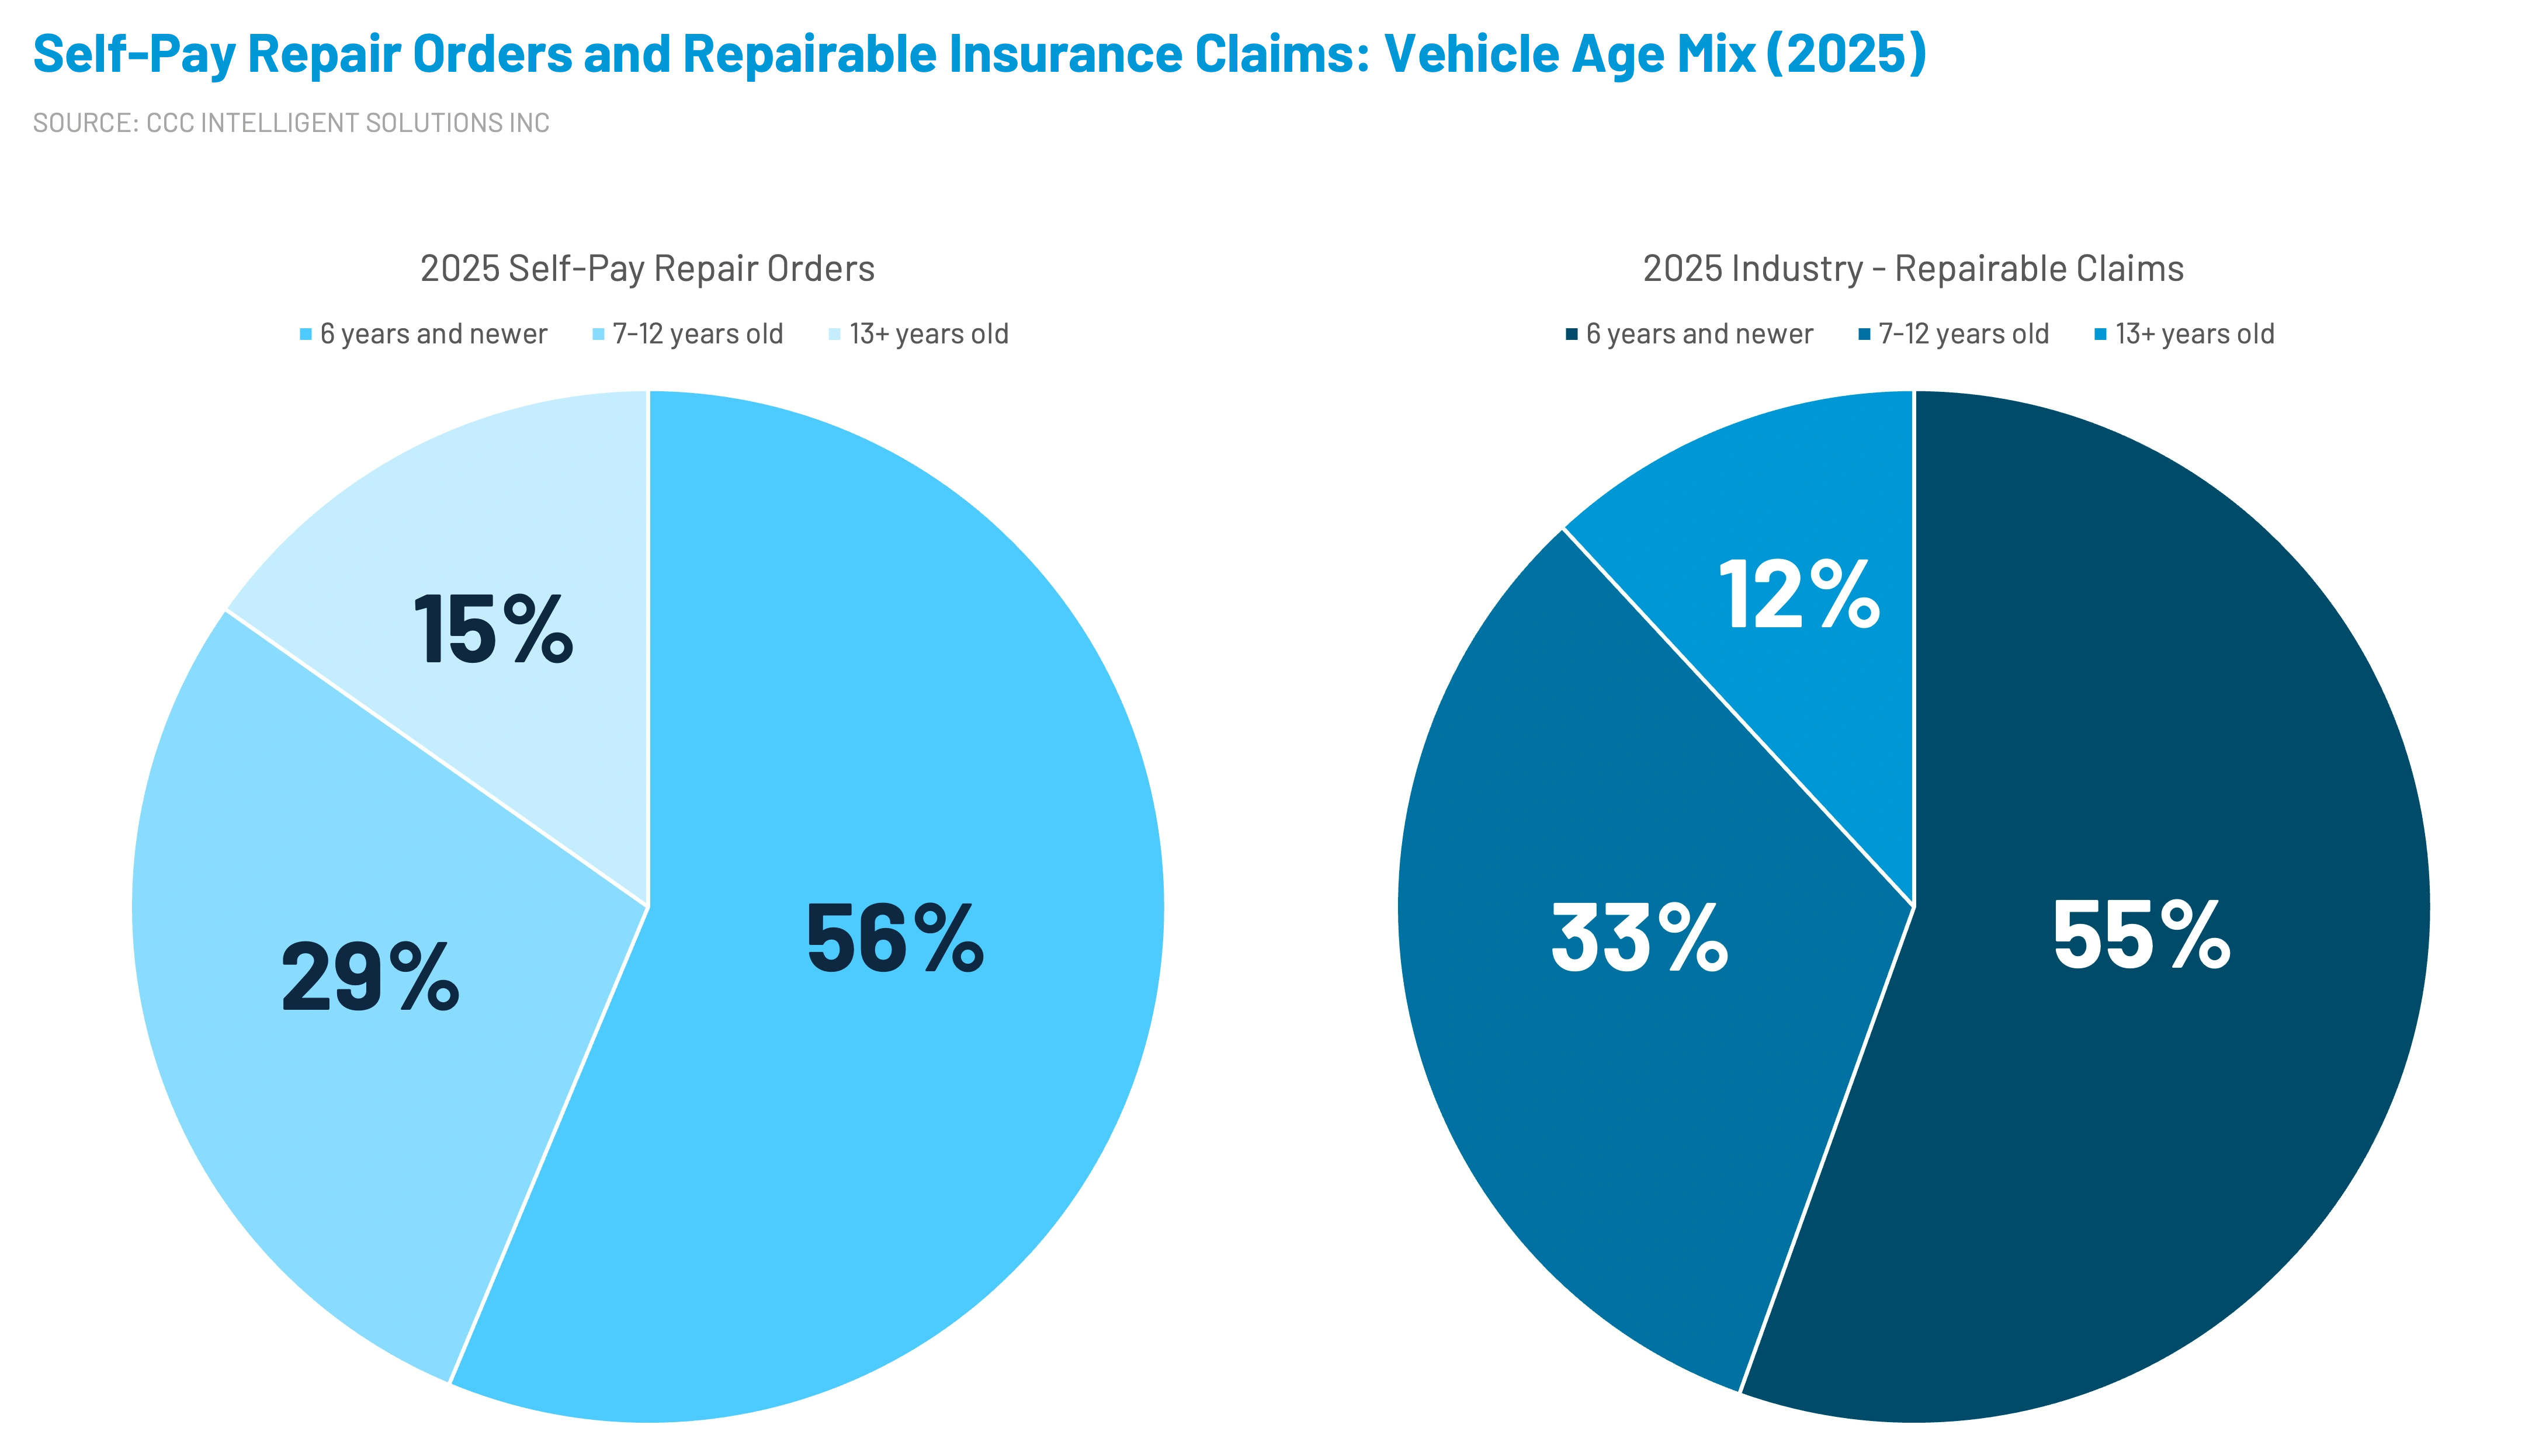
Self-pay is not limited to owners of older vehicles. Vehicles six years or newer represented approximately 56% of self-pay repair orders, nearly identical to their share of insurance repairable claims. That similarity suggests self-pay is not only a coverage issue. It is also a deliberate claims-management decision by consumers seeking to avoid a deductible, preserve their claims history, or reduce the possibility of future premium increases.
8. Diagnostics are moving rapidly into the standard repair workflow
In the first quarter of 2026, 74.8% of repairable appraisals included a scan and 29.9% included a calibration, up from 70.9% and 23.3%, respectively, one year earlier. Among DRP appraisals, scan penetration reached 89.8% and calibration penetration reached 40.6%.
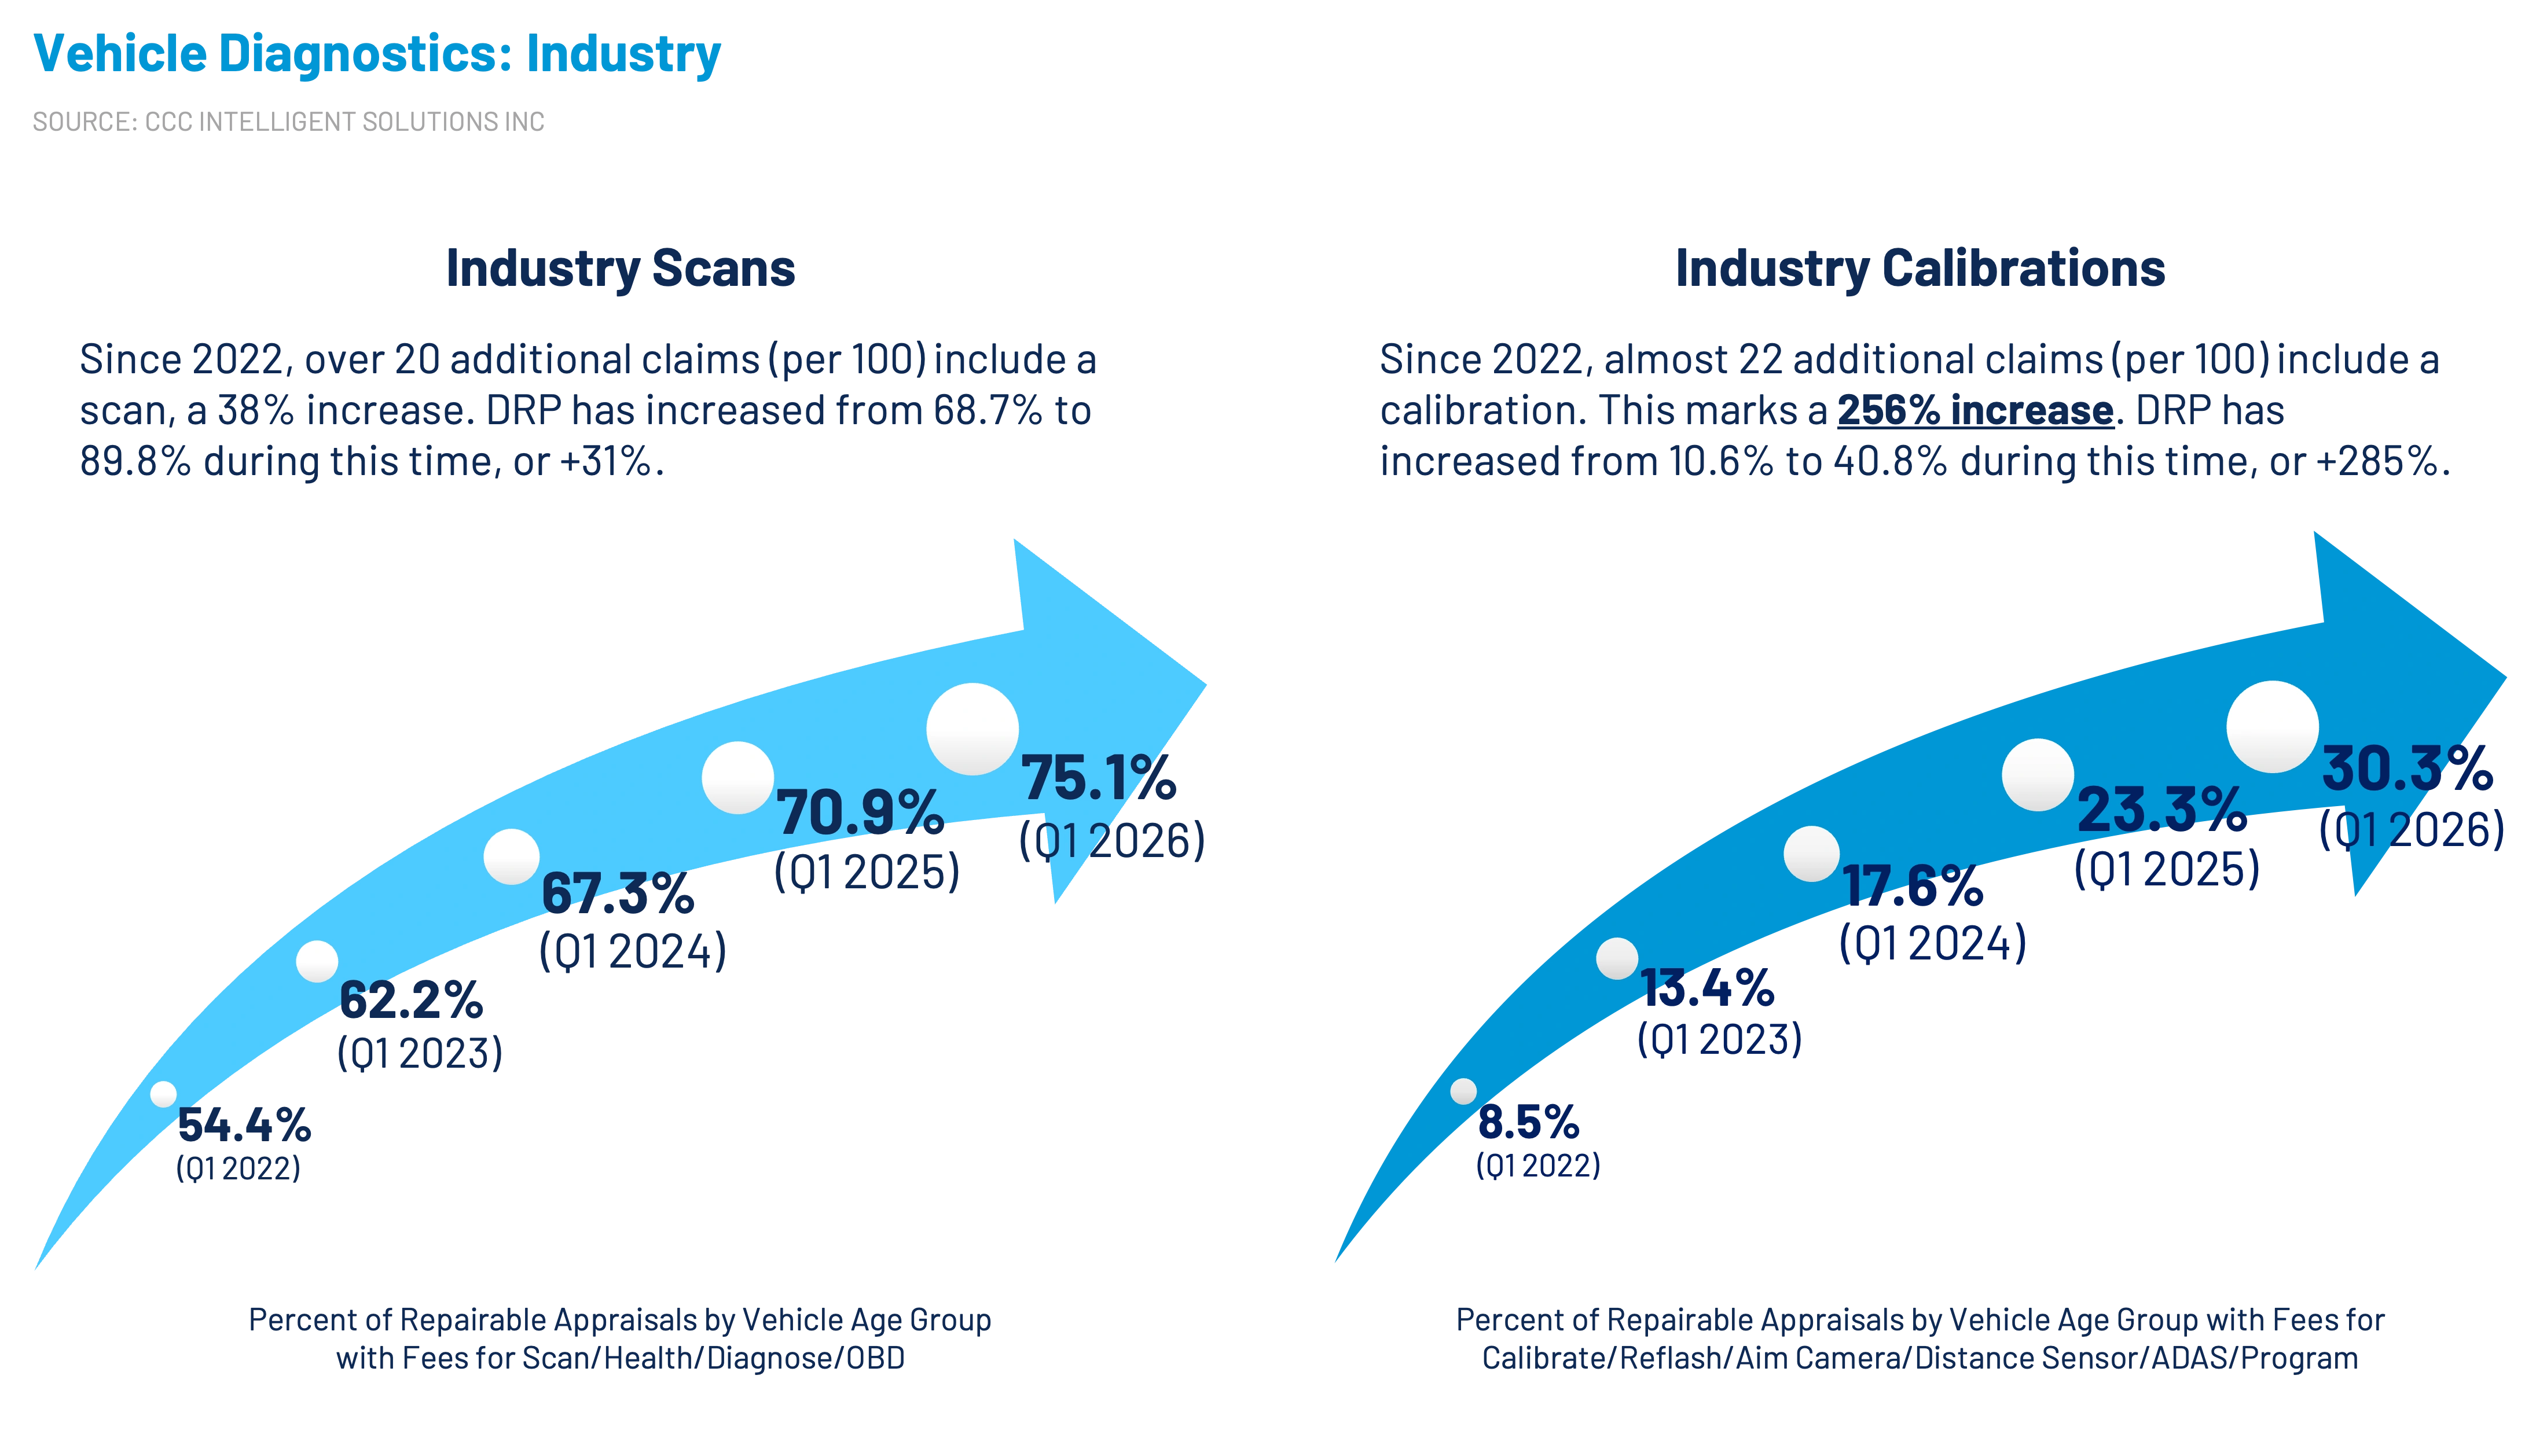
The placement of these operations is shifting as well. More than 83% of industry scans appeared on the initial estimate, while 47% of calibrations were captured there. For DRP claims, 93.1% of scans and 50.9% of calibrations appeared on the initial estimate. This suggests diagnostics are becoming less of an exception discovered later in the repair and more of a recognized requirement at intake.
9. Hybrids are becoming the most consequential alternative-fuel claims segment
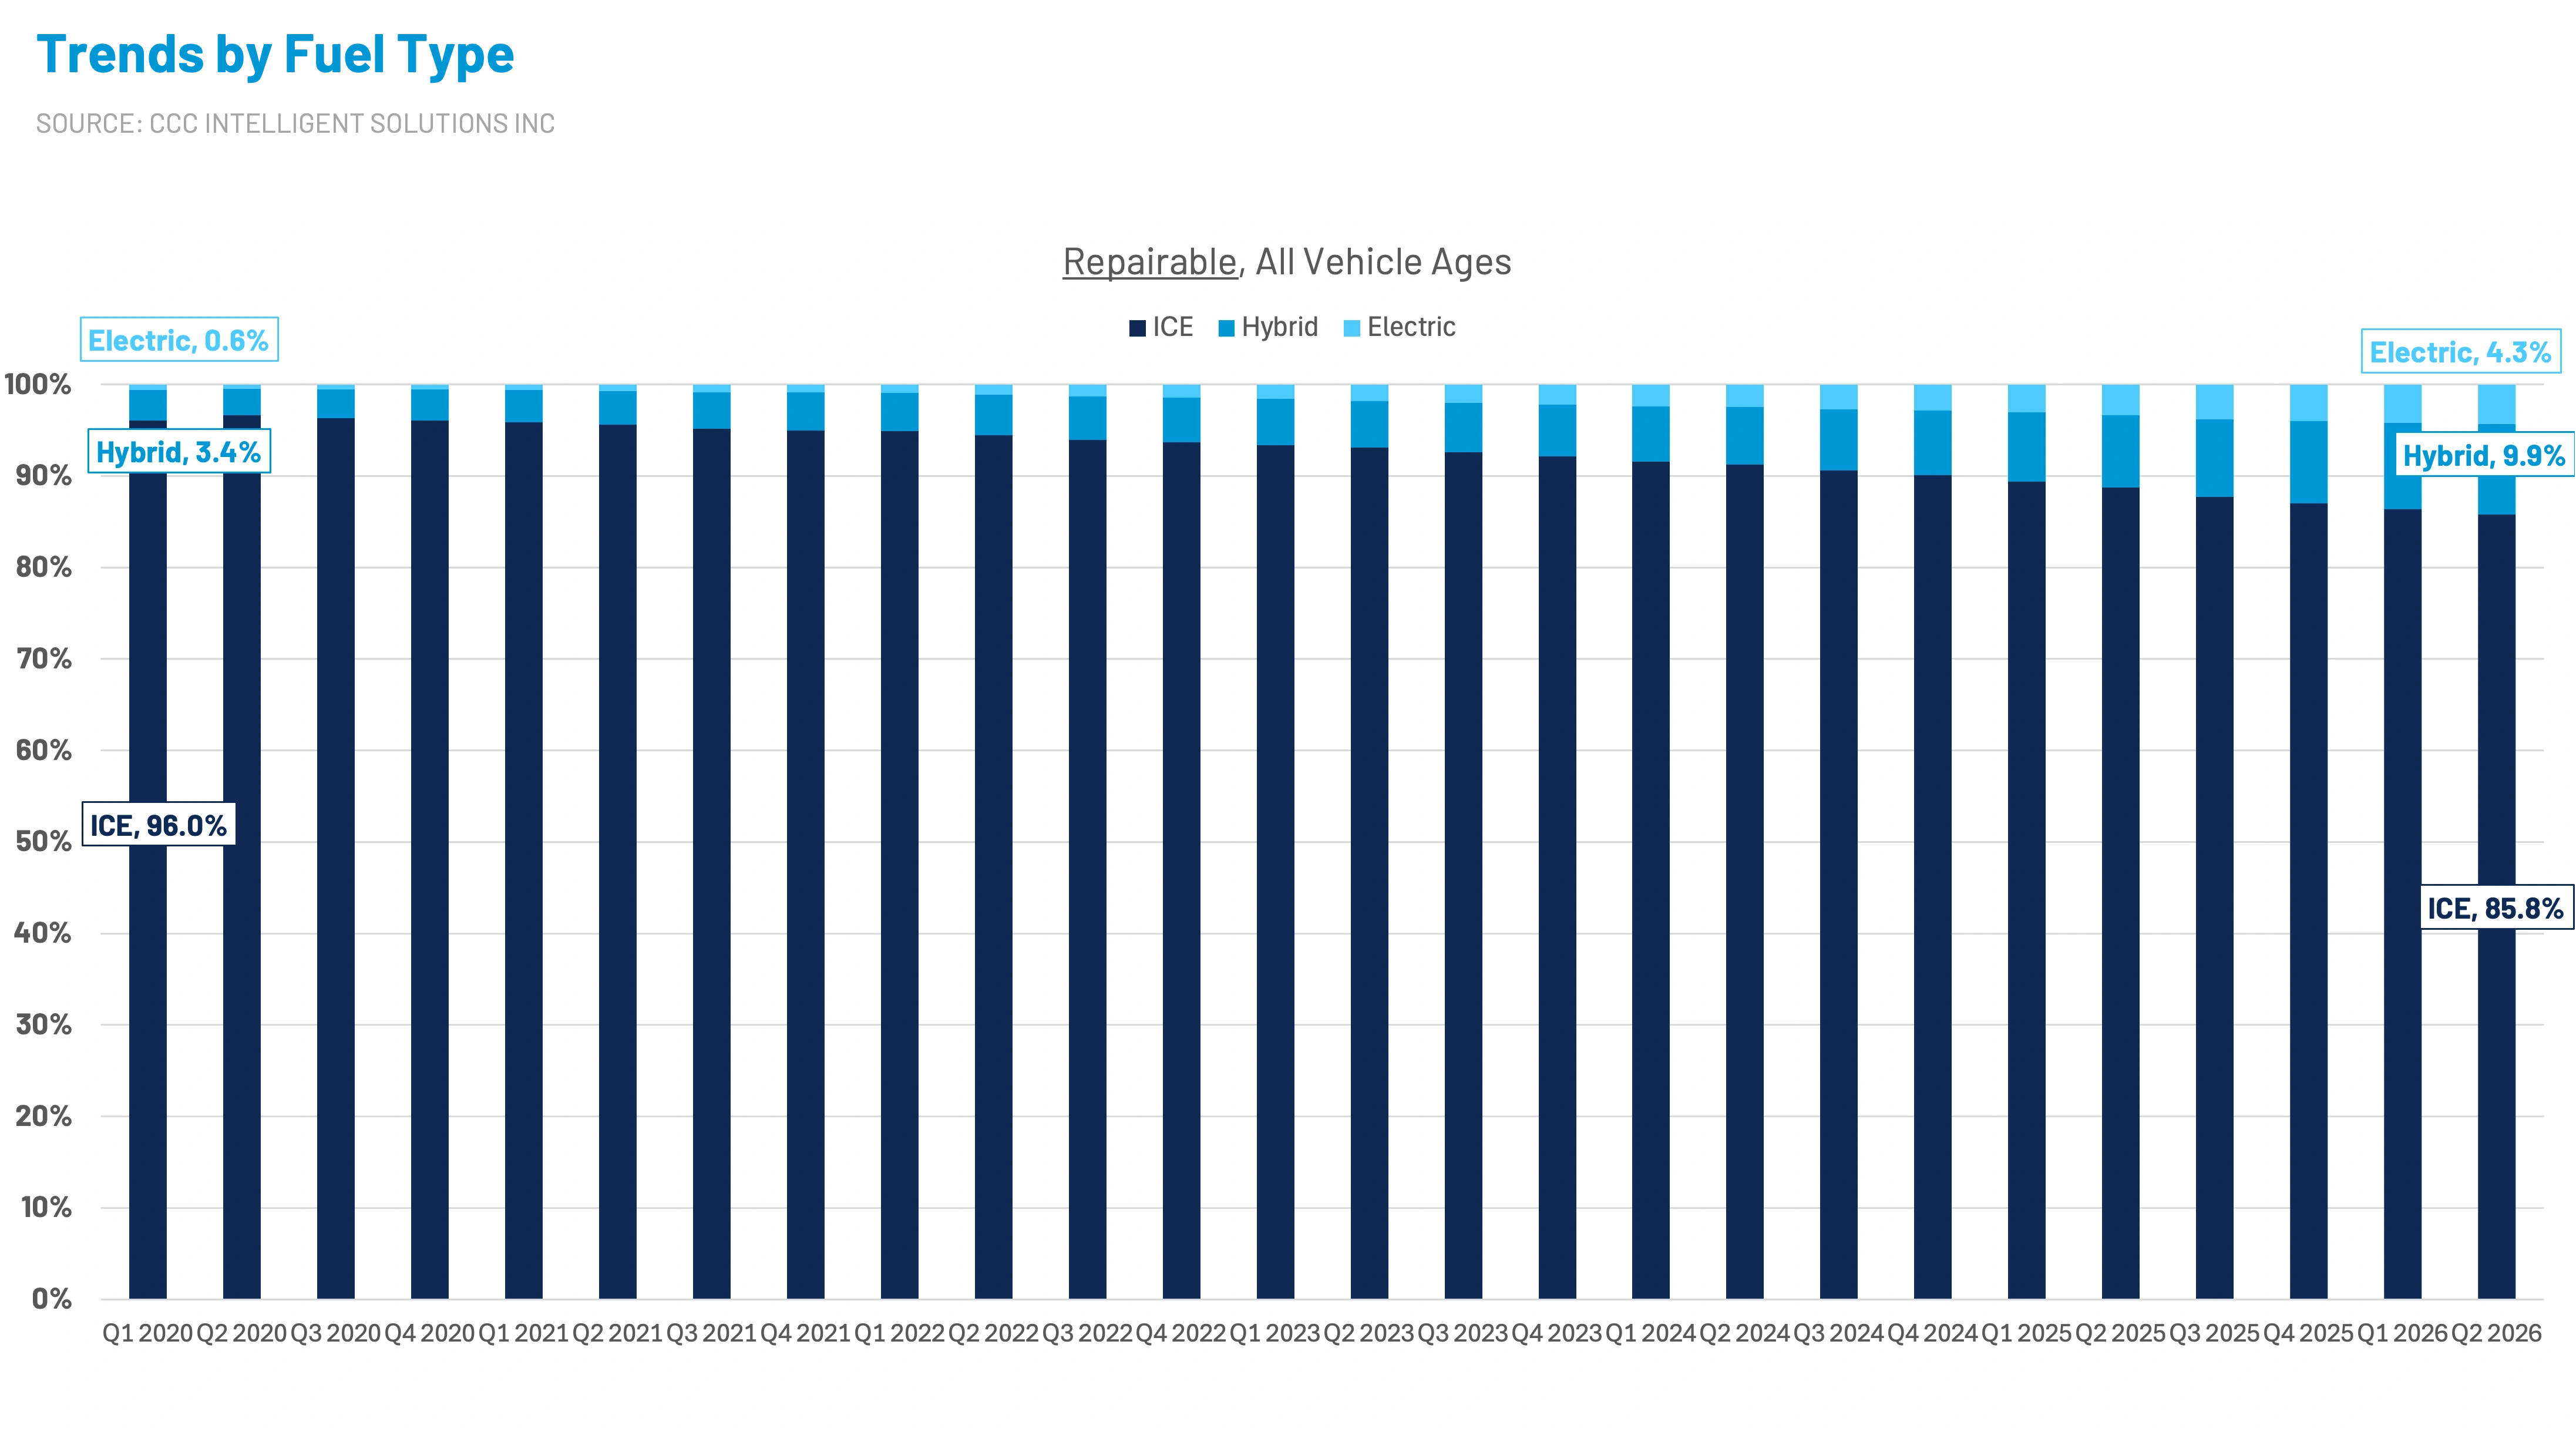
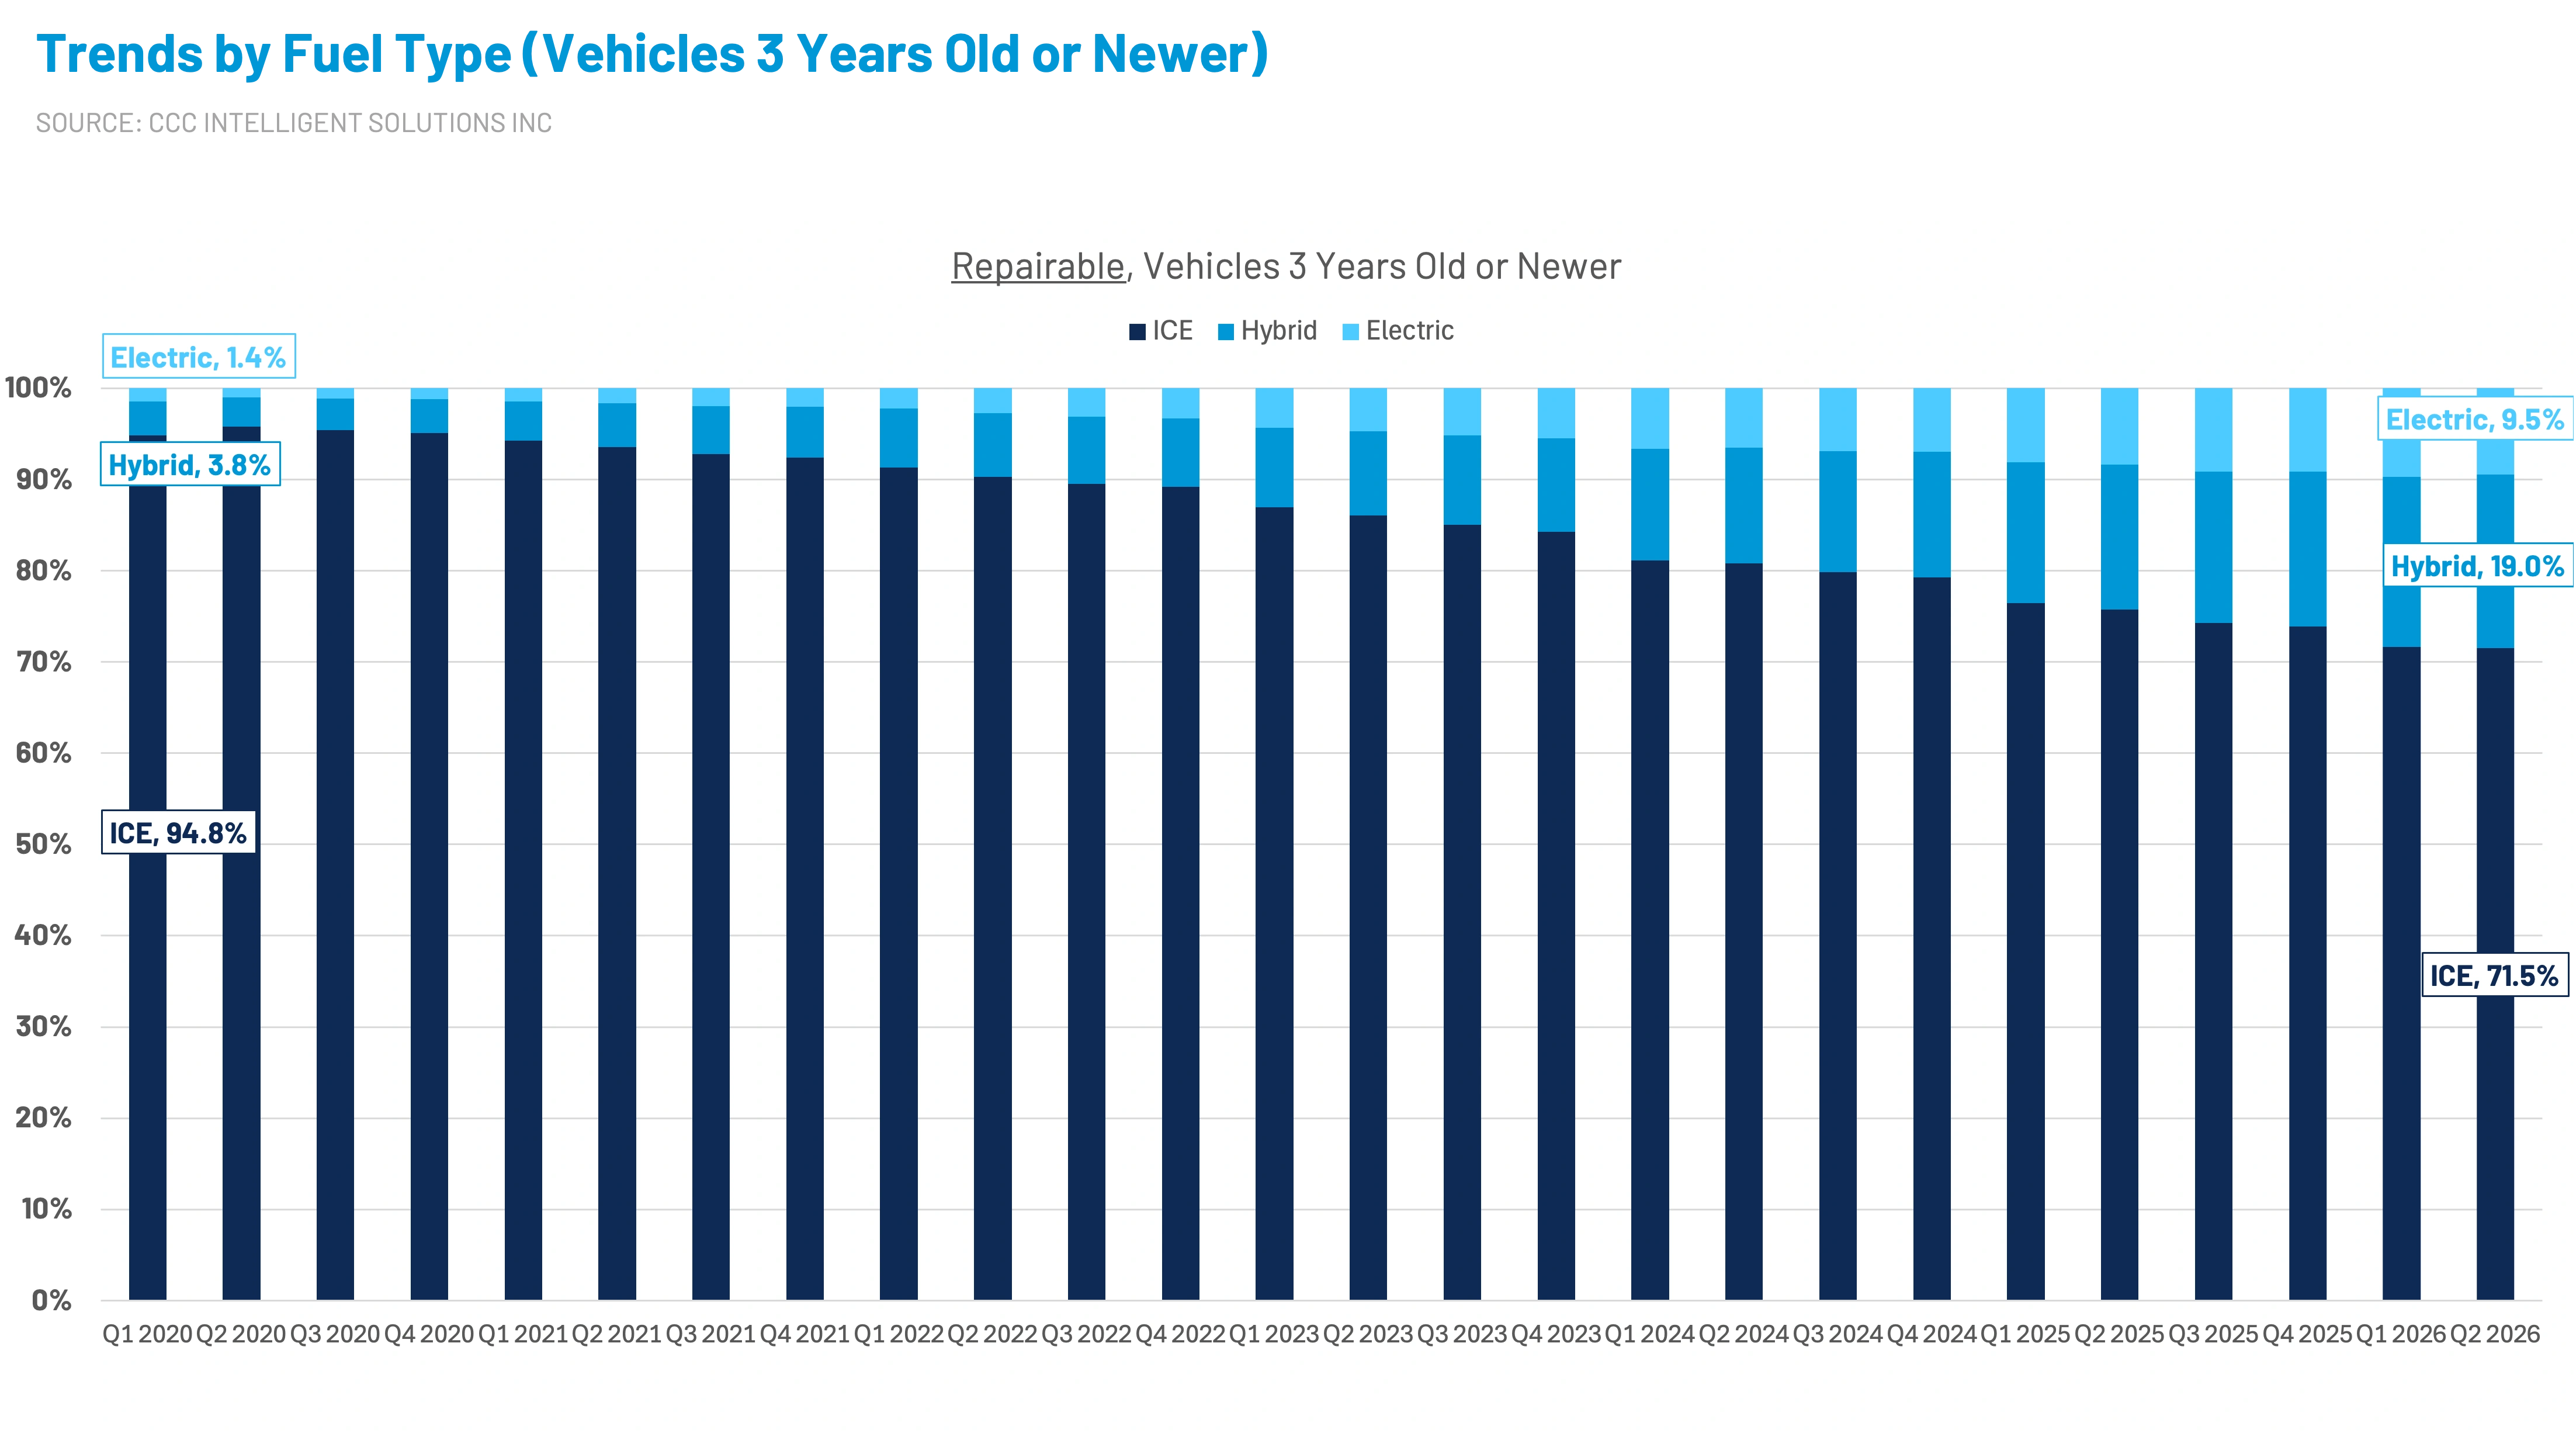
Across all vehicle ages, hybrids represented 9.9% of repairable claims in the second quarter of 2026, compared with 4.3% for electric vehicles. Among vehicles three years old or newer, hybrid share reached 19.0%, while EVs accounted for 9.5%.
Repair costs are converging as well. For vehicles three years old or newer, average hybrid TCOR reached $6,415, just $435 below the EV average of $6,850. Since 2020, hybrid repair costs have increased 53.6%, compared with 16.3% for EVs. EVs remain the most expensive fuel type in this age group, but hybrids now carry substantially greater claim volume. For near-term portfolio planning, hybrid repair economics may therefore have more influence than the narrower question of EV severity alone.
2026 in 5 words: Fewer, but more complex claims.
Now, more than half-way through 2026, and seeing minimal growth inaverage repair cost. Higher deductibles and self-pay decisions are thinning thelower end of the claims distribution. Older vehicles are increasing total lossfrequency, including among driveable vehicles. Diagnostics are appearing in agrowing share of repairs. Hybrids and EVs are becoming more prominent innewer-vehicle claims. Part prices remain elevated even as fewer parts and laborhours moderate total repair-cost growth.
This doesn’t necessarilymean less risk –in fact, it increasingly means the claims being filedcarry greater economic consequence, technical variability, and sensitivity toconsumer affordability. Complexity is not showing up through one dominantmetric, rather, it’s continuing to compound across the decisions consumers makebefore filing, the vehicles entering the repair process, and the work requiredto return those vehicles safely to the road.
© 2026 CCC Intelligent Solutions Inc. All Rights Reserved. Theinformation and opinions in this publication are for general information only,are subject to change and are not intended to provide specific recommendationsfor any individual or entity. Although information contained herein has beenobtained from sources believed to be reliable, CCC does not guarantee itsaccuracy and it may be incomplete or condensed. CCC is not liable for anytypographical errors, incorrect data and/or any actions taken in reliance onthe information and opinions contained in this publication.
Note: Where CCC IntelligentSolutions Inc. is cited as source, the data provided is an aggregation ofindustry data related to electronic appraisals communicated via CCC'selectronic network or from total loss valuations processed by CCC. Where CCCCasualty is cited as a source, the data provided is an aggregation of industrydata collected from claims data communicated via CCC Casualty’s electronicnetwork.