


Crash Course 2026: Complexity Compounds
If 2025 proved anything, it's that claims and repair complexity continues to intensify.
At a glance, the year in review appears relatively stable. Frequency was steady across most physical damage coverages. Underwriting performance improved. Combined ratios strengthened following rate actions in prior years. On the surface, the system looks balanced. Below it, the structure of risk is changing.
Affordability pressures continue to influence how consumers participate in insurance and vehicle ownership. Higher deductibles, coverage downgrades, delayed vehicle purchases, and extended financing terms are reshaping both the insured pool and the vehicle fleet. New vehicle sales have improved modestly, yet the multi-year shortfall since 2020 has materially altered the composition of the car parc — leaving an older fleet on the road and fewer newer vehicles entering the system.
At the same time, lower-severity claims are increasingly discretionary. As smaller first-party claims fall out of the system, the remaining claims skew more severe. Total loss frequency has reached new highs. Driveable total losses continue to rise. And on the liability side, bodily injury has increased in both frequency and severity and placing renewed pressure on underwriting performance. Additionally, uninsured and underinsured motorist claim frequency continues to climb, further shifting costs to compliant drivers as the percentage of uninsured/underinsured on the roadways increases.
Meanwhile, repair complexity continues to evolve. Advancing vehicle technology, embedded sensors, calibrations, diagnostics, and shifting part and labor dynamics are making each repair more technical and variable. Even where cost growth moderates, volatility remains.
Compounding these structural shifts is a macroeconomic environment defined by inflationary aftershocks, trade uncertainty, and continued pressure on household budgets. These forces influence coverage participation, claim behavior, parts pricing, and insurer rate strategy – amplifying the complexity already present within the ecosystem.
This year's Crash Course report provides a deeper examination of the structural forces driving continued complexity and reshaping the P&C insurance claims and collision repair ecosystem – from coverage participation and claim filing behavior to fleet composition, repair complexity, casualty escalation, and macroeconomic volatility.
Together, these trends illustrate a simple but important reality: complexity in the auto claims ecosystem is not receding. It's compounding.
.svg)

Auto insurance is built on the shared participation in the pooling of risk, but when consumer household expenses are squeezed, that participation begins to shift.
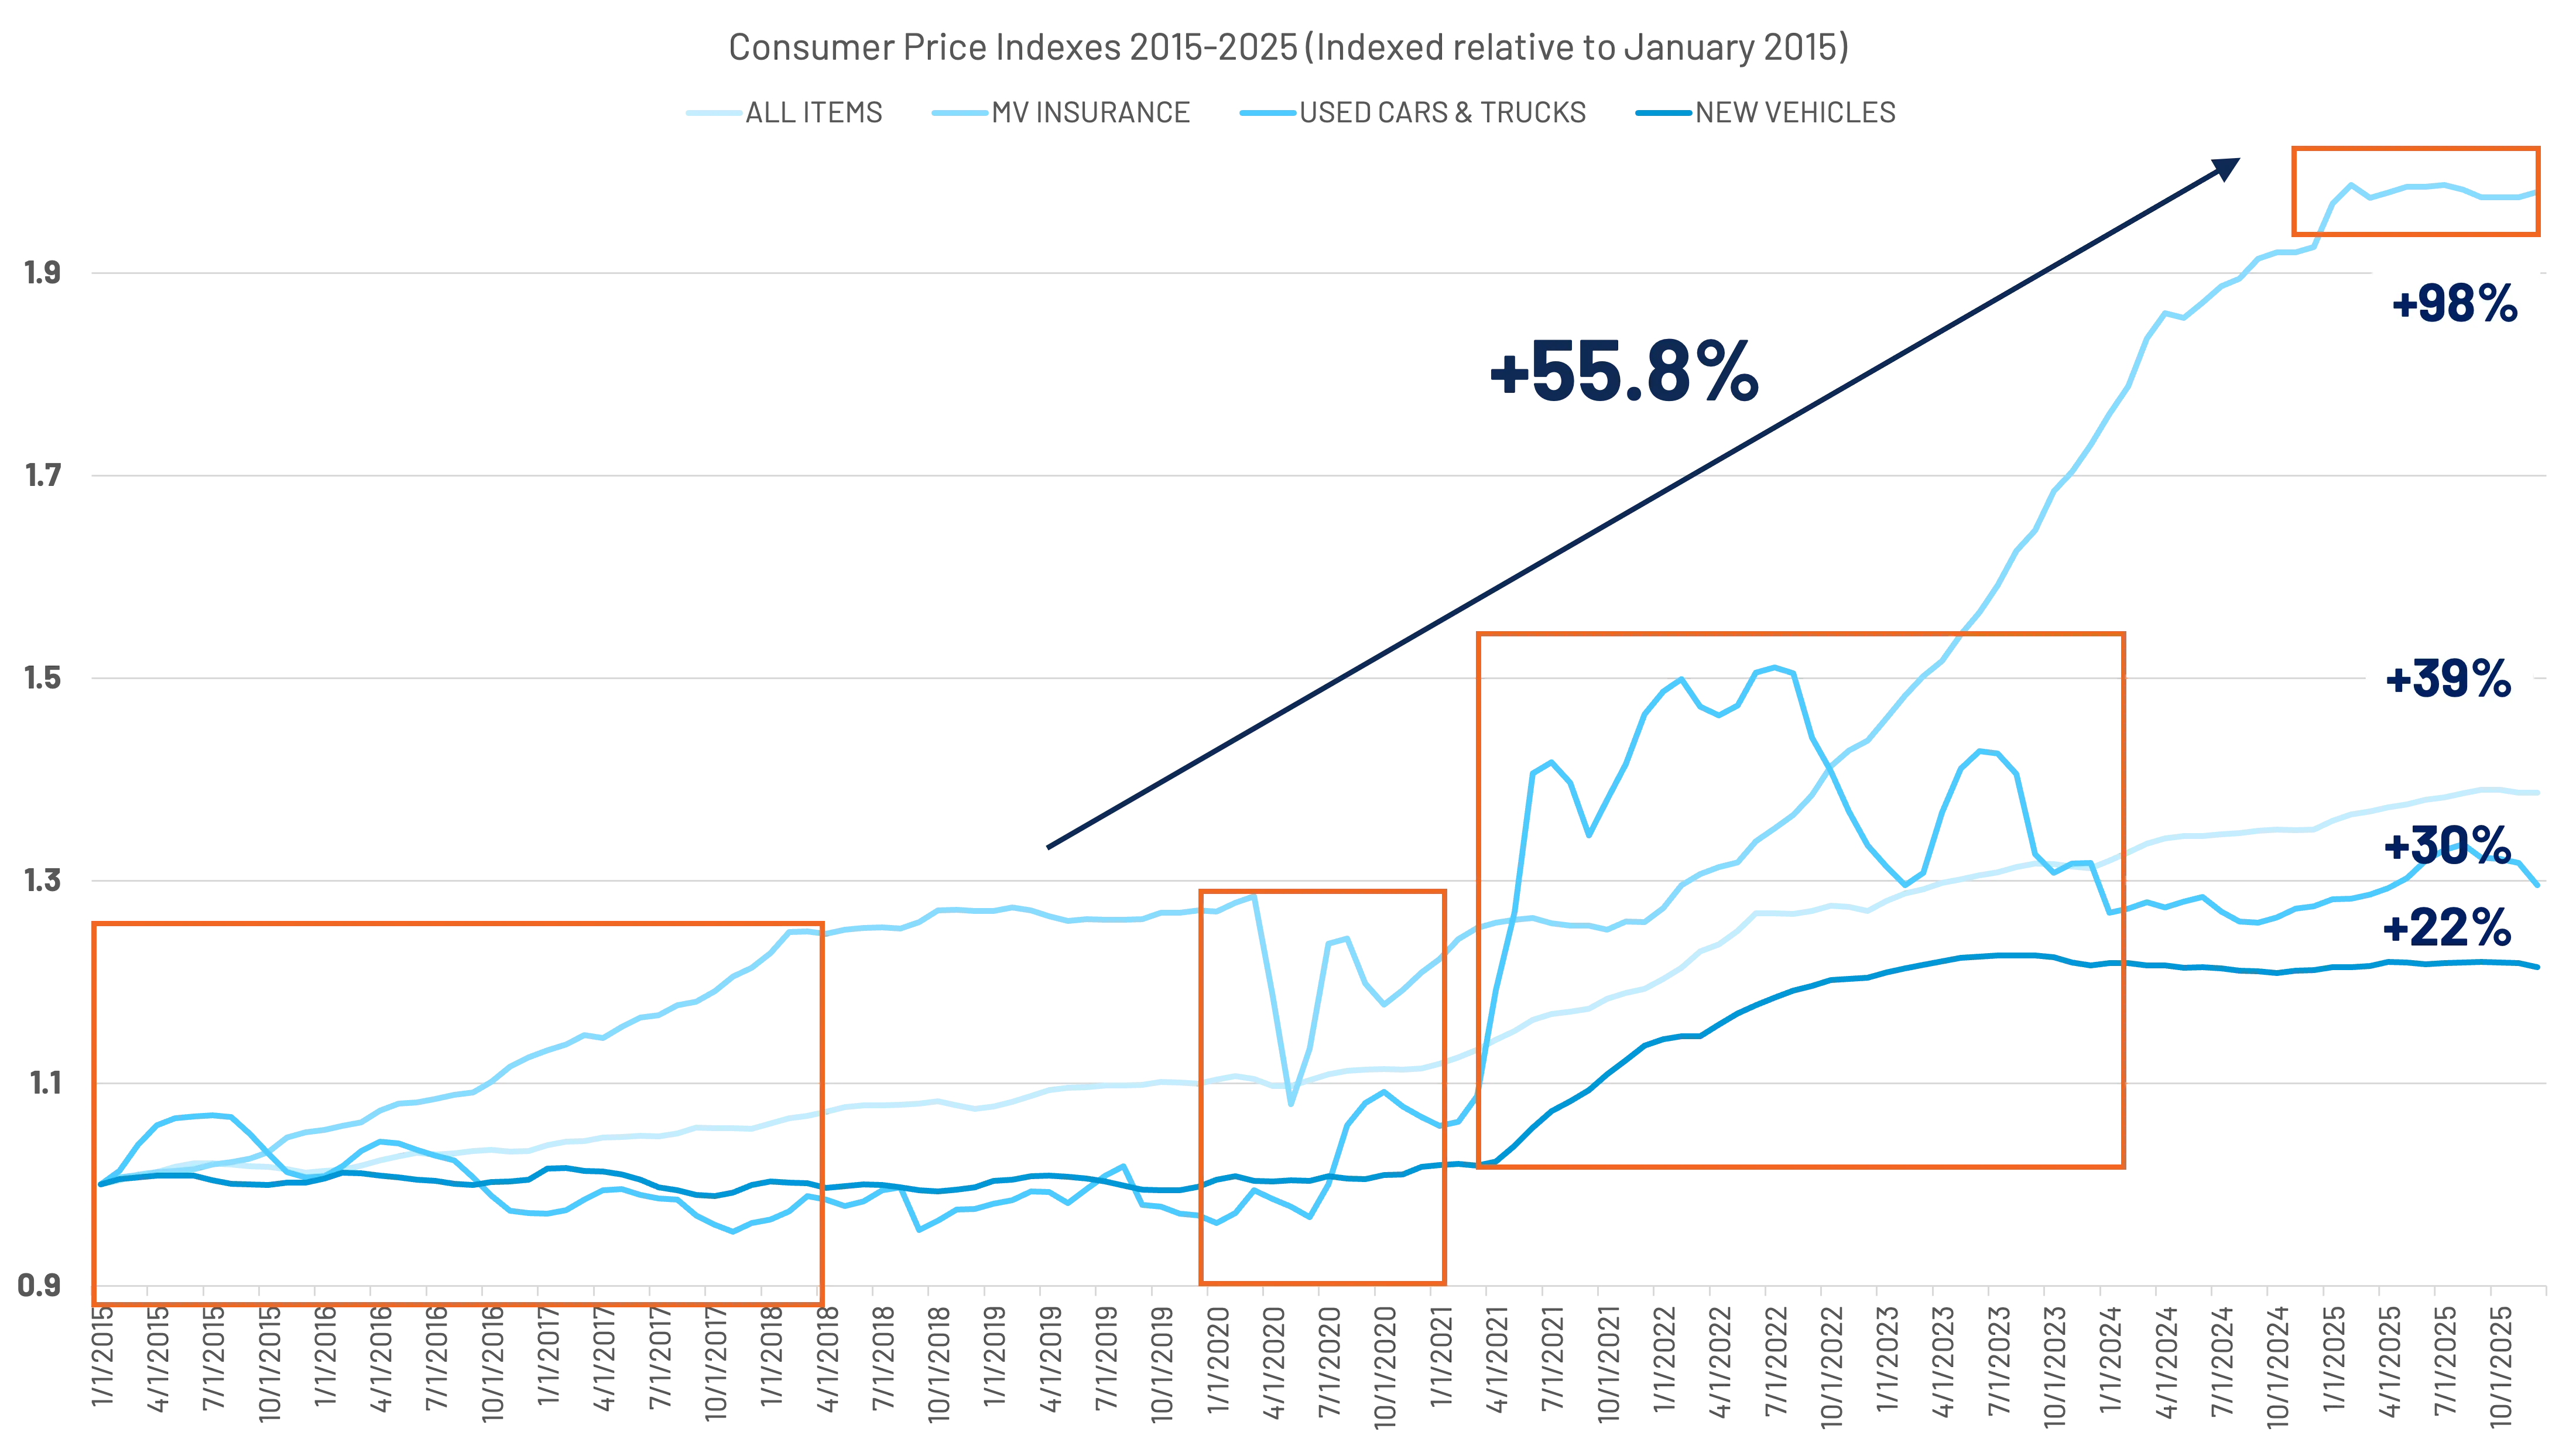
As inflation, interest rates, and economic uncertainty pressures persist post-pandemic, growing costs and consumer financial strain have led to affordability challenges that are influencing whether consumers will maintain full coverage, scale back protections, or step out of the system entirely. (Figure 1)
A survey conducted by Guardian Service in the second quarter of 2025 reflected several behaviors affecting everything from major purchasing decisions, insurance coverage, and claims volumes to self-pay repairs and abstention from taking any action at all.
- 35% have delayed or canceled plans to purchase a home (22%), car (8%), or both (5%) this year.
- 77% view car insurance as a necessity and won't go without it.
- At the same time, 24%, or nearly 1 in 4 people, have downgraded or dropped insurance to free up cash.
- 1 in 3 said they would temporarily go without insurance to free up funds for necessities.
- 1 in 5 would rather go without insurance coverage than pay rising monthly premiums.
- 29% downgraded or canceled insurance in the last year. Car insurance was the most downgraded or canceled at 15%, followed by health (8%), homeowners (5%), pet (4%), and renters (4%).
- 8% downgraded from full coverage car insurance to liability.
This was followed by two notable findings from JD power in their 2025 U.S. Auto Claims Satisfaction Study released in October:
- 7% of auto insurance customers say they’ve avoided filing a claim for fear their rates could rise.
- 26% of auto insurance customers have deductibles of $1,000 or more.
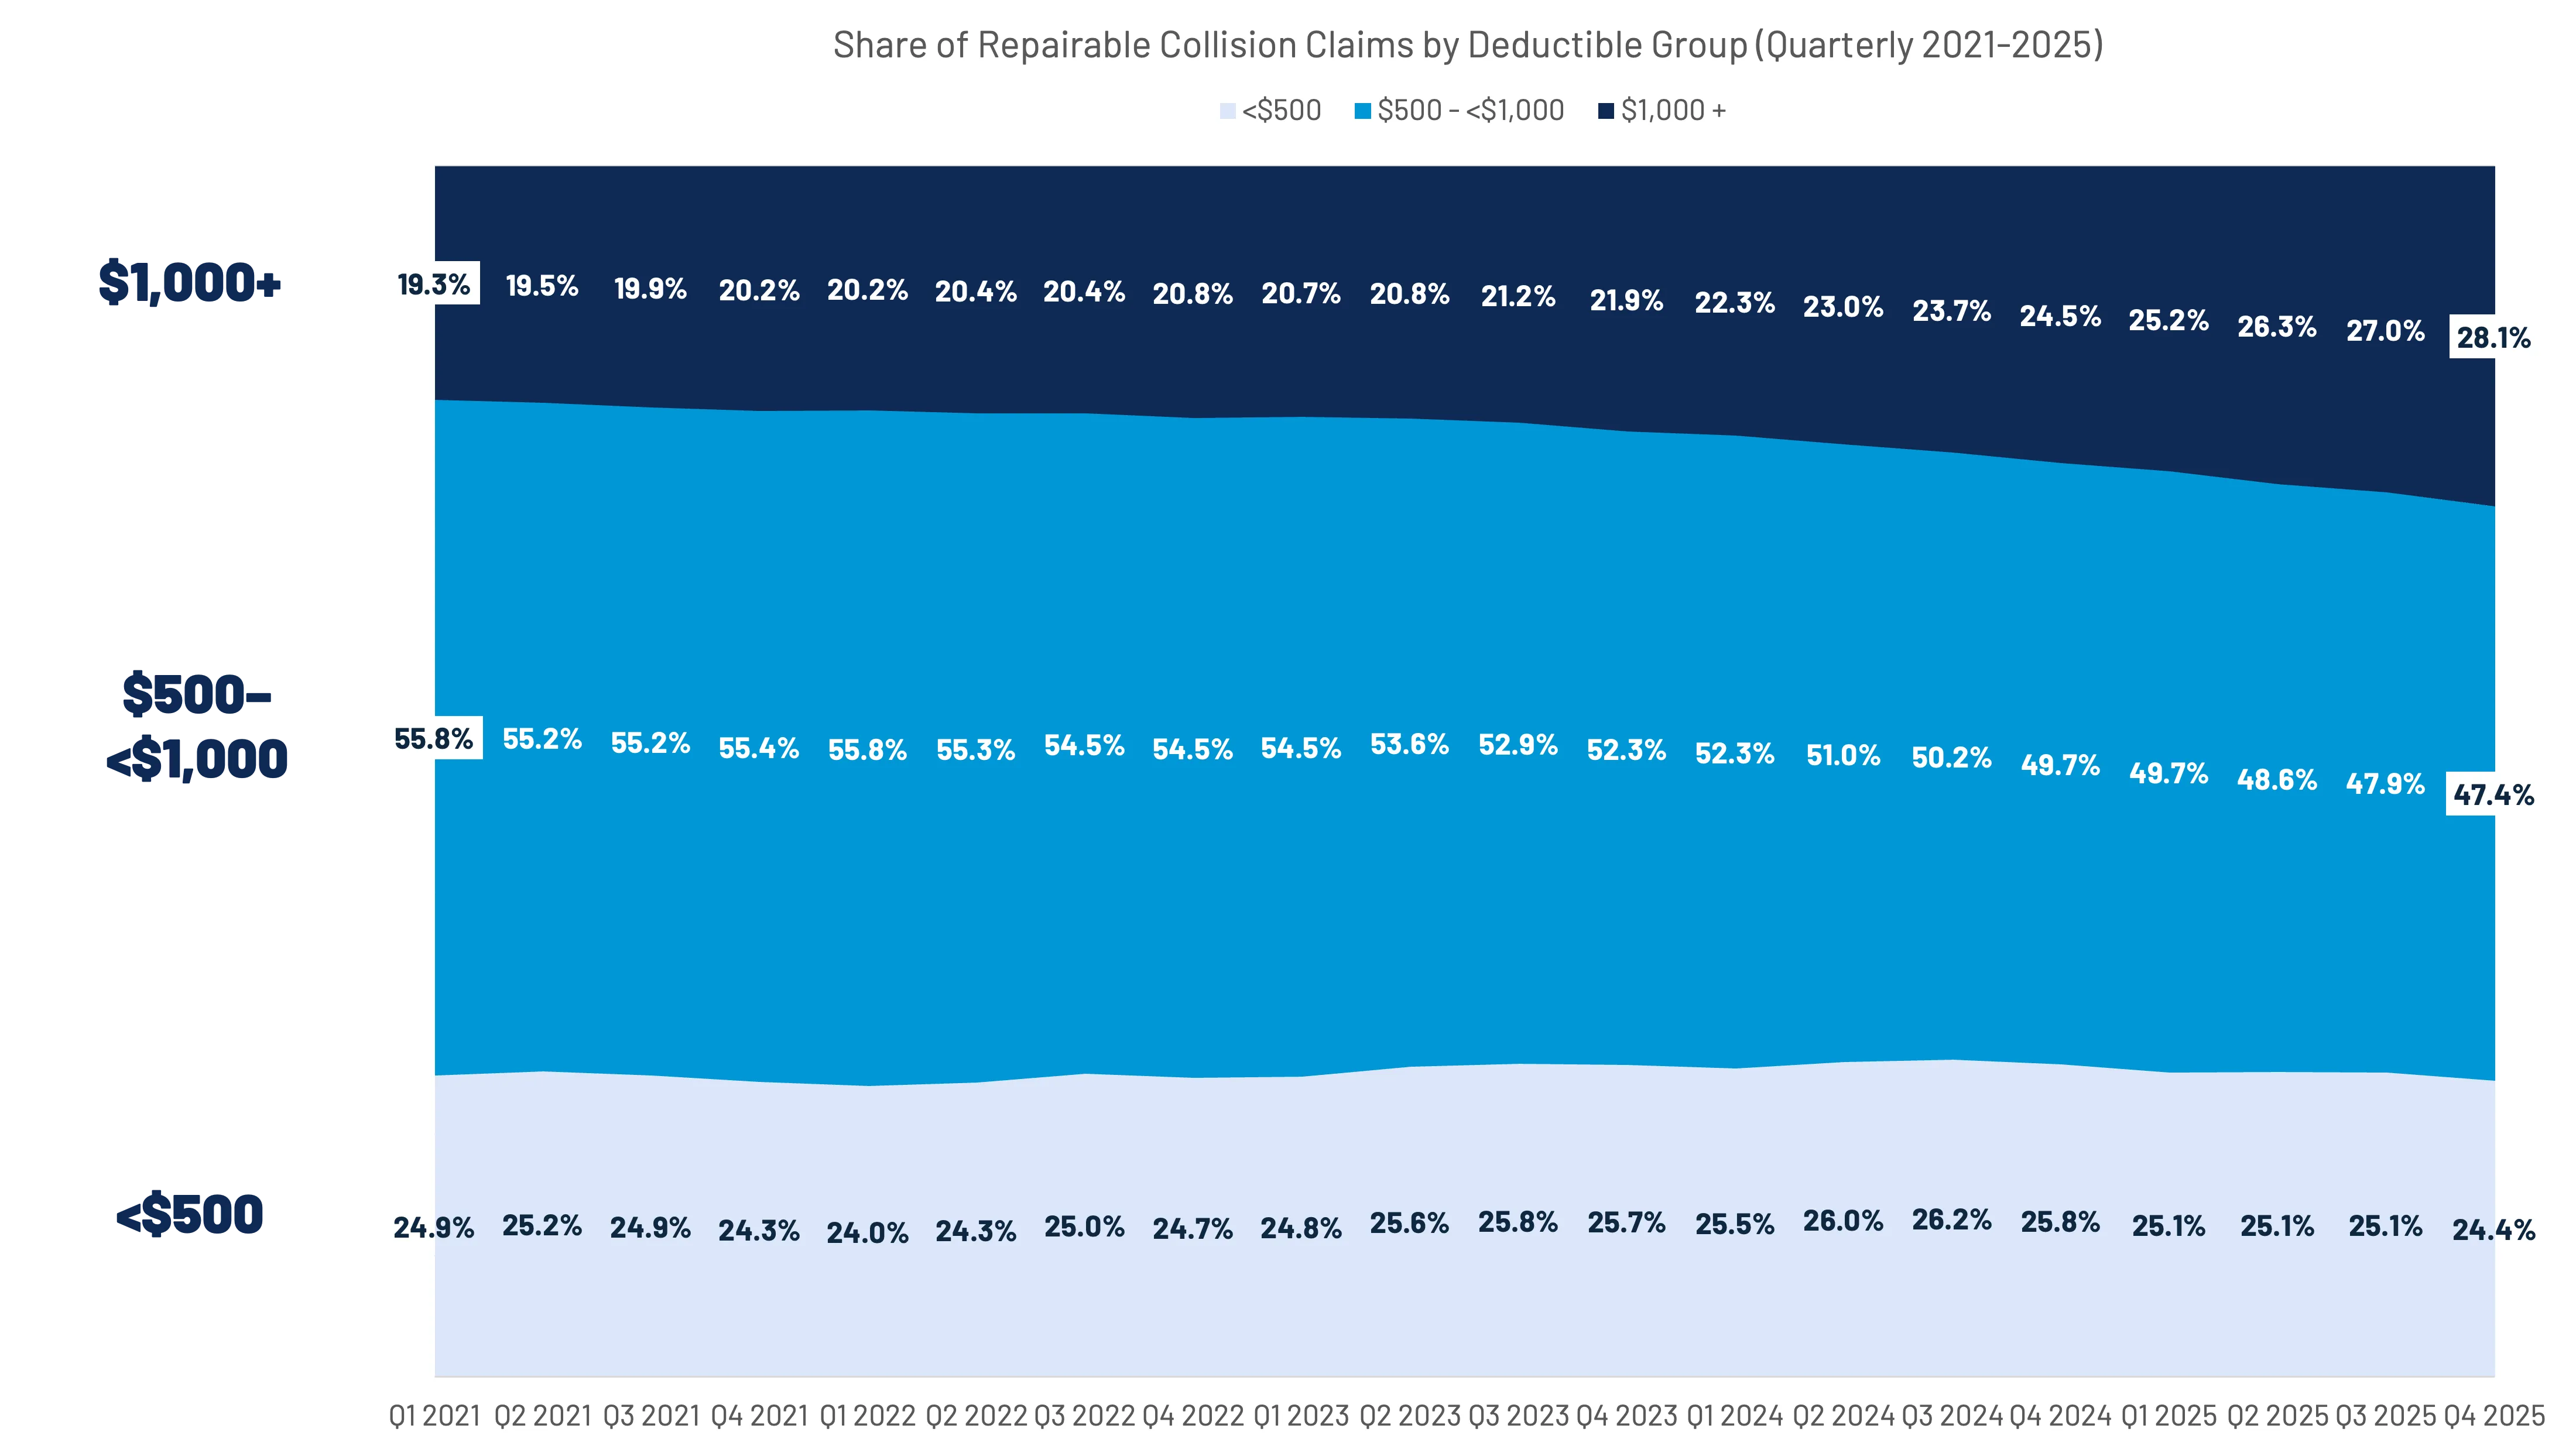
While JD Power's results would reflect policy decisions made by consumers, CCC's national industry data reveals a similar trend in deductible utilization amongst repairable claims. The share of $1,000 or higher deductibles has increased by over three-and-a-half percentage points in the past year and over six percentage points over the past two years. $500 deductibles, which are the most common for first-party claims, saw their share with repairable collision claims decrease by over seven percentage points in the past year. (Figure 2)
When comparing $1,000+ deductibles for claims by condition and coverage (both first party), we find a couple of noticeable differences. First, total loss claims have a higher share within the $1,000+ segment. Collision total loss claims saw a 6.2 percentage point differential in 2025, while comprehensive claims saw a 4.4-point variance compared to repairables. (Figure 3)
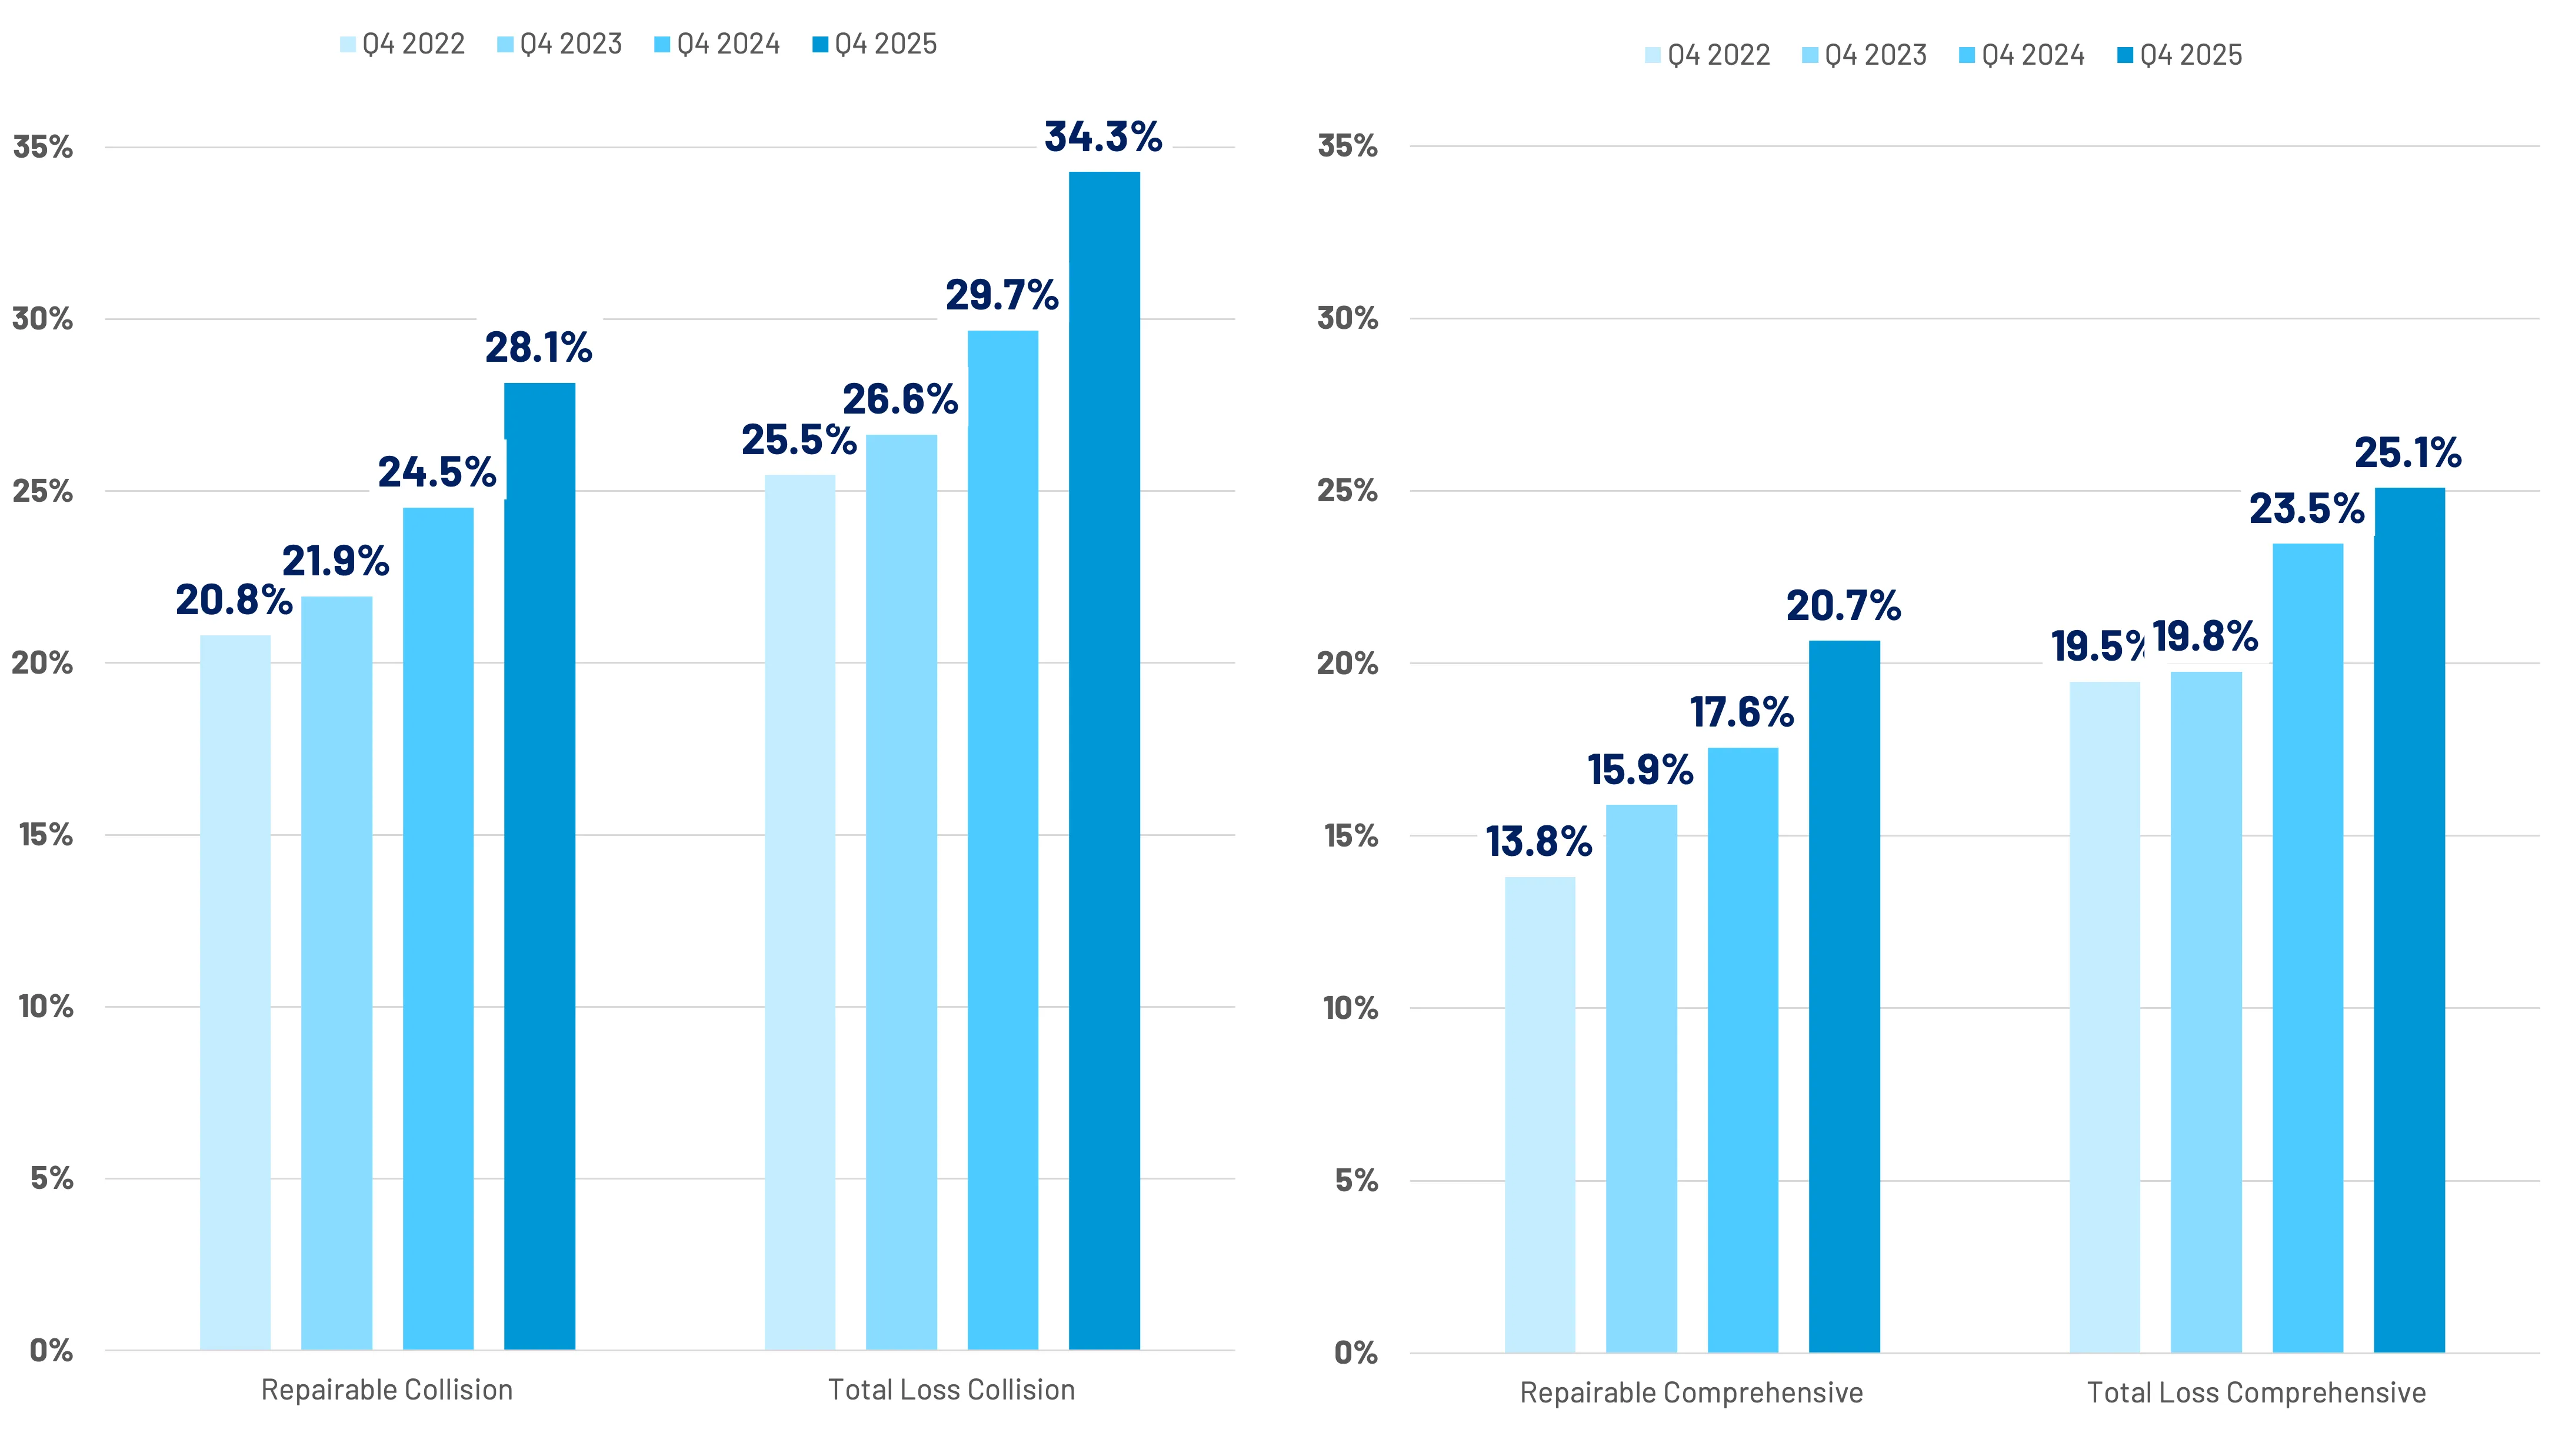
This is likely due to some level of choice by consumers, as repairable claims could be less likely to be reported, especially if the vehicle is repairable and a high deductible exists. For total losses, there is generally less flexibility in whether to file a claim.
While auto sales volumes reflect one aspect of economic challenges for American households, auto finance reveals another layer of pressures confronting consumers.
According to the St. Louis Federal Reserve, new light vehicle sales saw a 2.4% increase in 2025, exceeding 16,246,000 million vehicles sold – the highest volume in the post-pandemic era. On a unit basis, this is an increase of ~388,000 vehicles relative to 2024. Both Cox Automotive and Edmunds are forecasting 2026 sales to decrease 2-3%.
Despite being the largest annual volume of new light vehicle sales in the U.S. since 2019, 2025 sales volumes were still over 714,000 units lower than 2019. Average new vehicle prices and high interest rates are just two factors that continue to stifle new vehicle sales growth.
What's interesting to consider is that over the past five years (2021–2025), nearly 7 million fewer vehicles were sold compared to the prior five-year period (2016–2020), a time marked by pandemic-related disruptions.
Vehicles in operation reached almost 296 million as of Q3 2025 (Experian), +5.1% relative to 2020 and +6% compared to 2019. Beneath the hood, though, lies a significant shift in composition that directly affects the APD ecosystem. Although there are ~14.3 million more vehicles in operation compared to 2020, there are over 12 million less newer vehicles (6 years old or newer) in operation. (Figure 4)
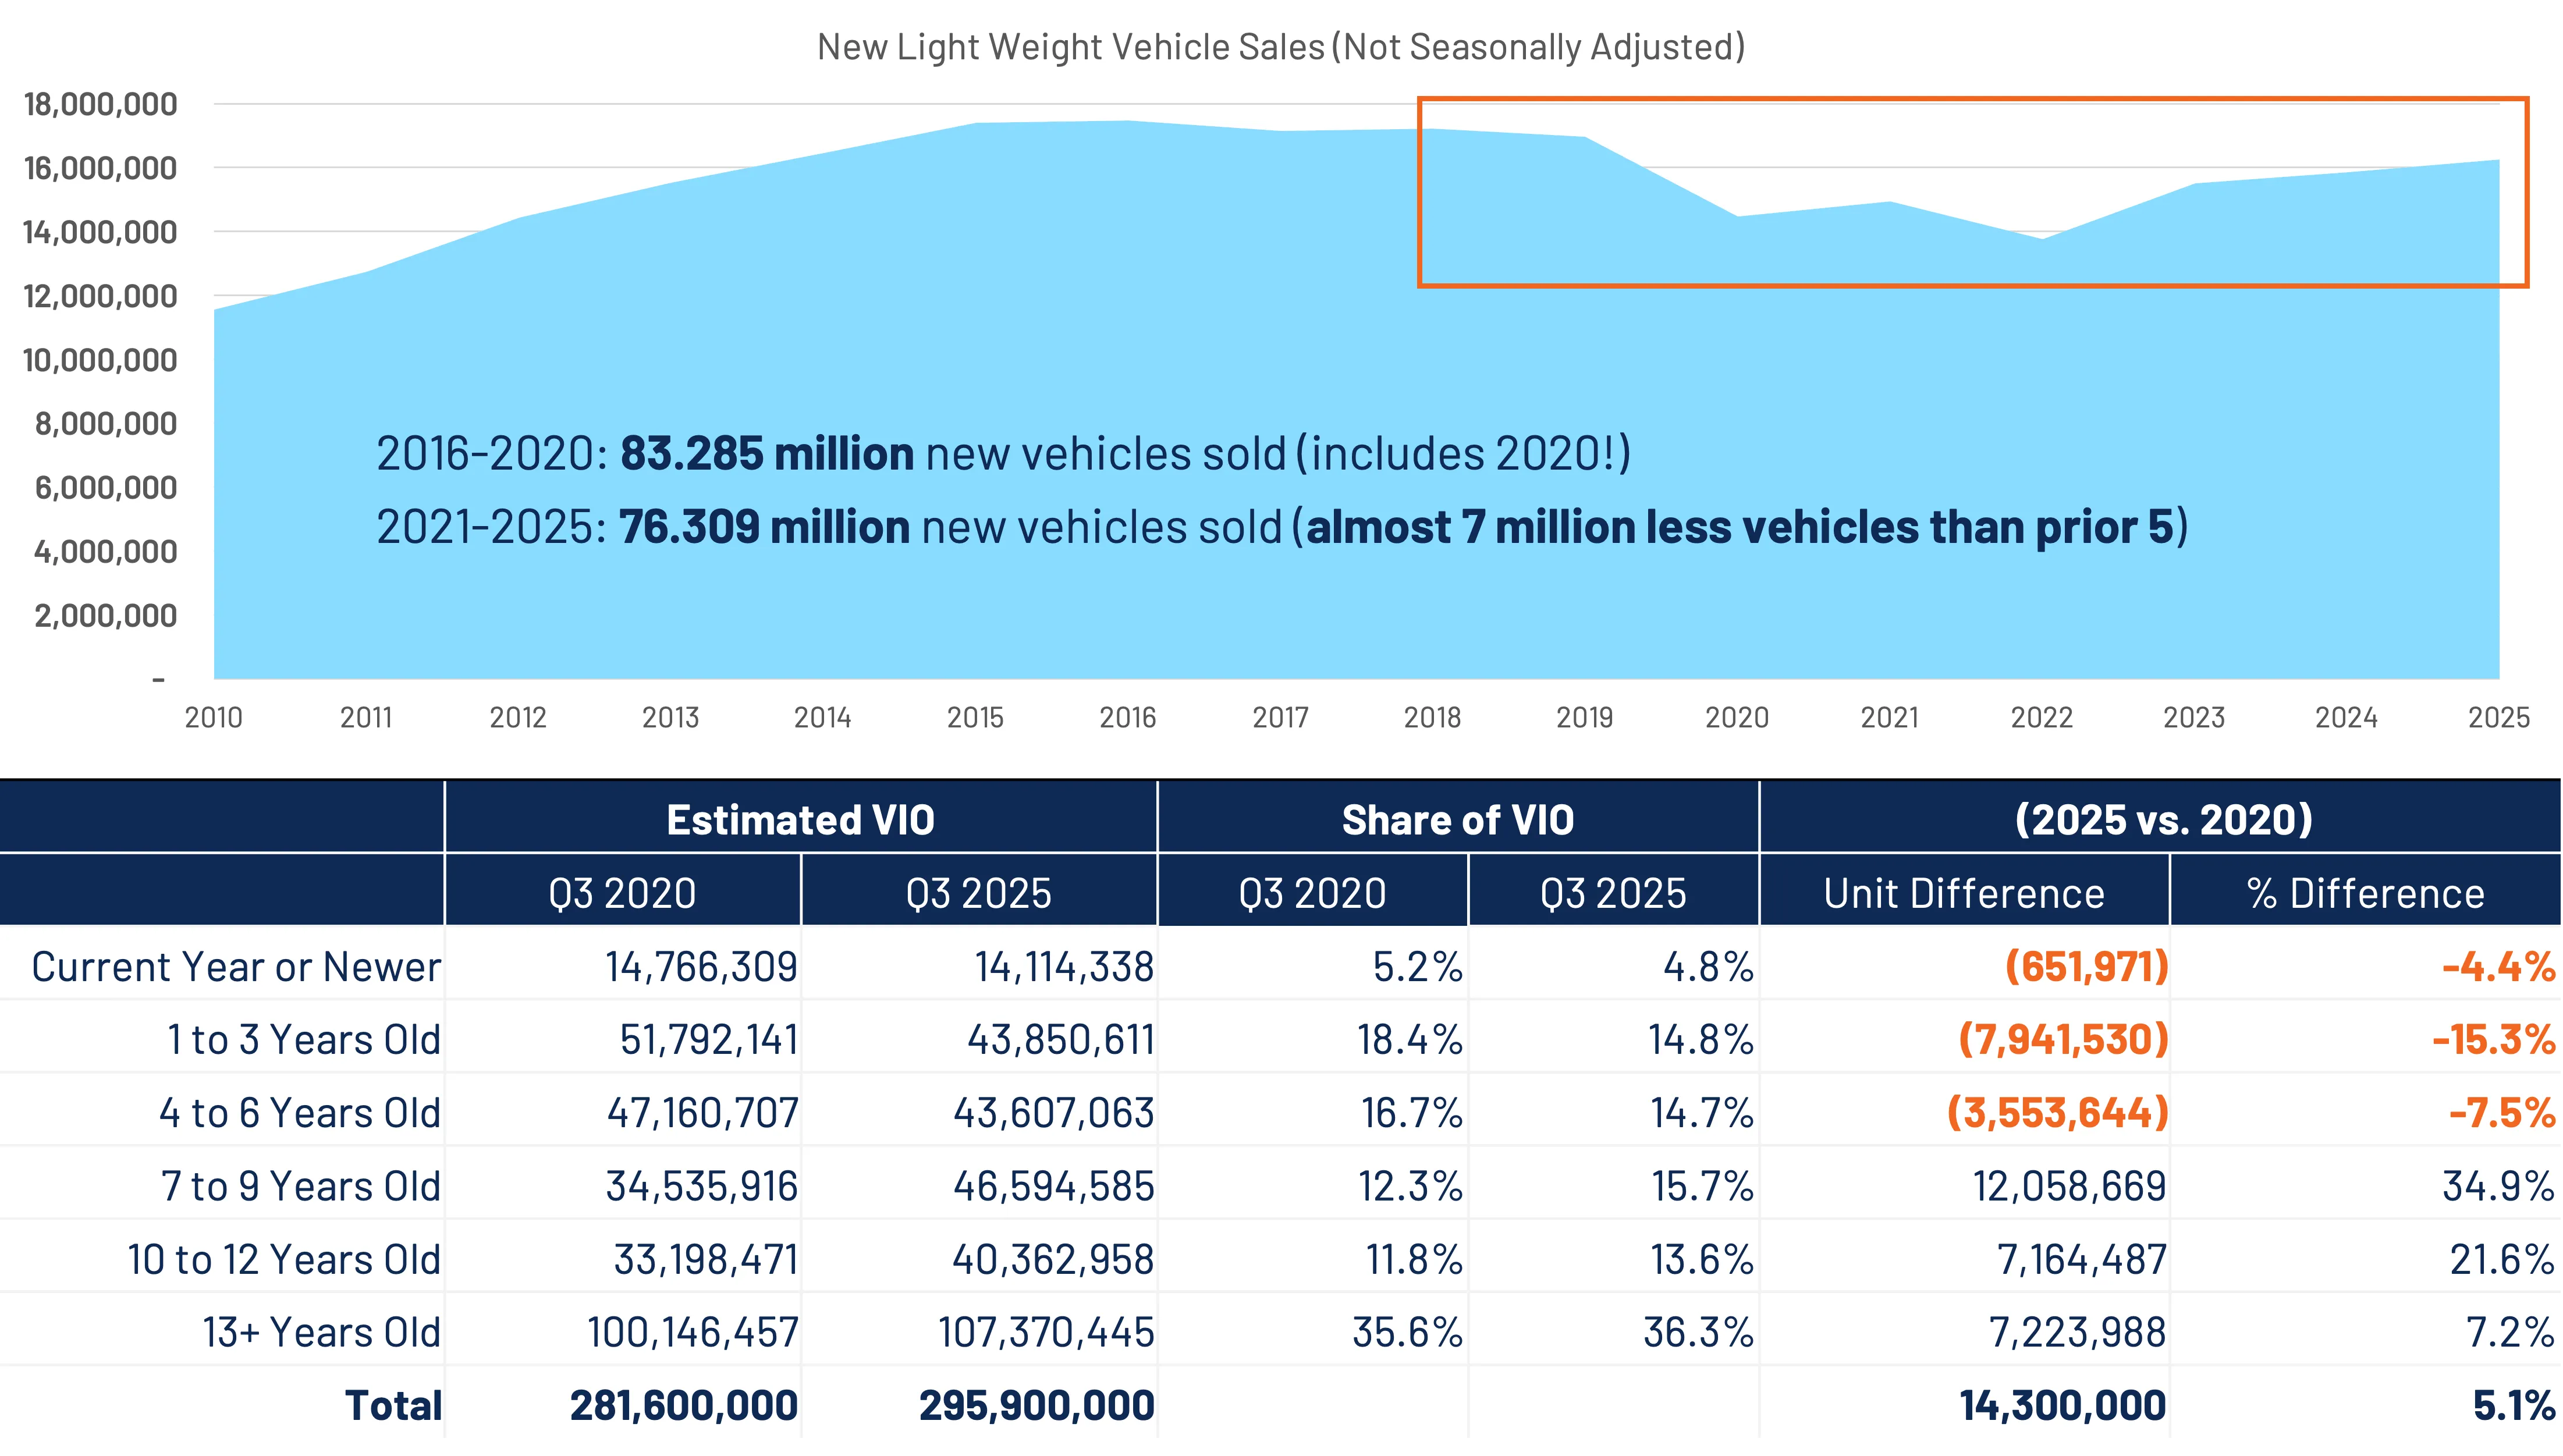
This chasm has developed because of anemic new vehicle sales volumes. This will come into play when we dissect trends in the mix of claims.
Upon review of Edmunds new and used car finance data (Q4 2019-2025), as well as Cox Automotive and Kelley Blue Book data concerning new vehicle transaction, numerous shifts stand out.
Average transaction prices for new vehicles have generally increased in 2025, exceeding $50,000 for the first time in September. December ATP was $50,326. (Figure 5)
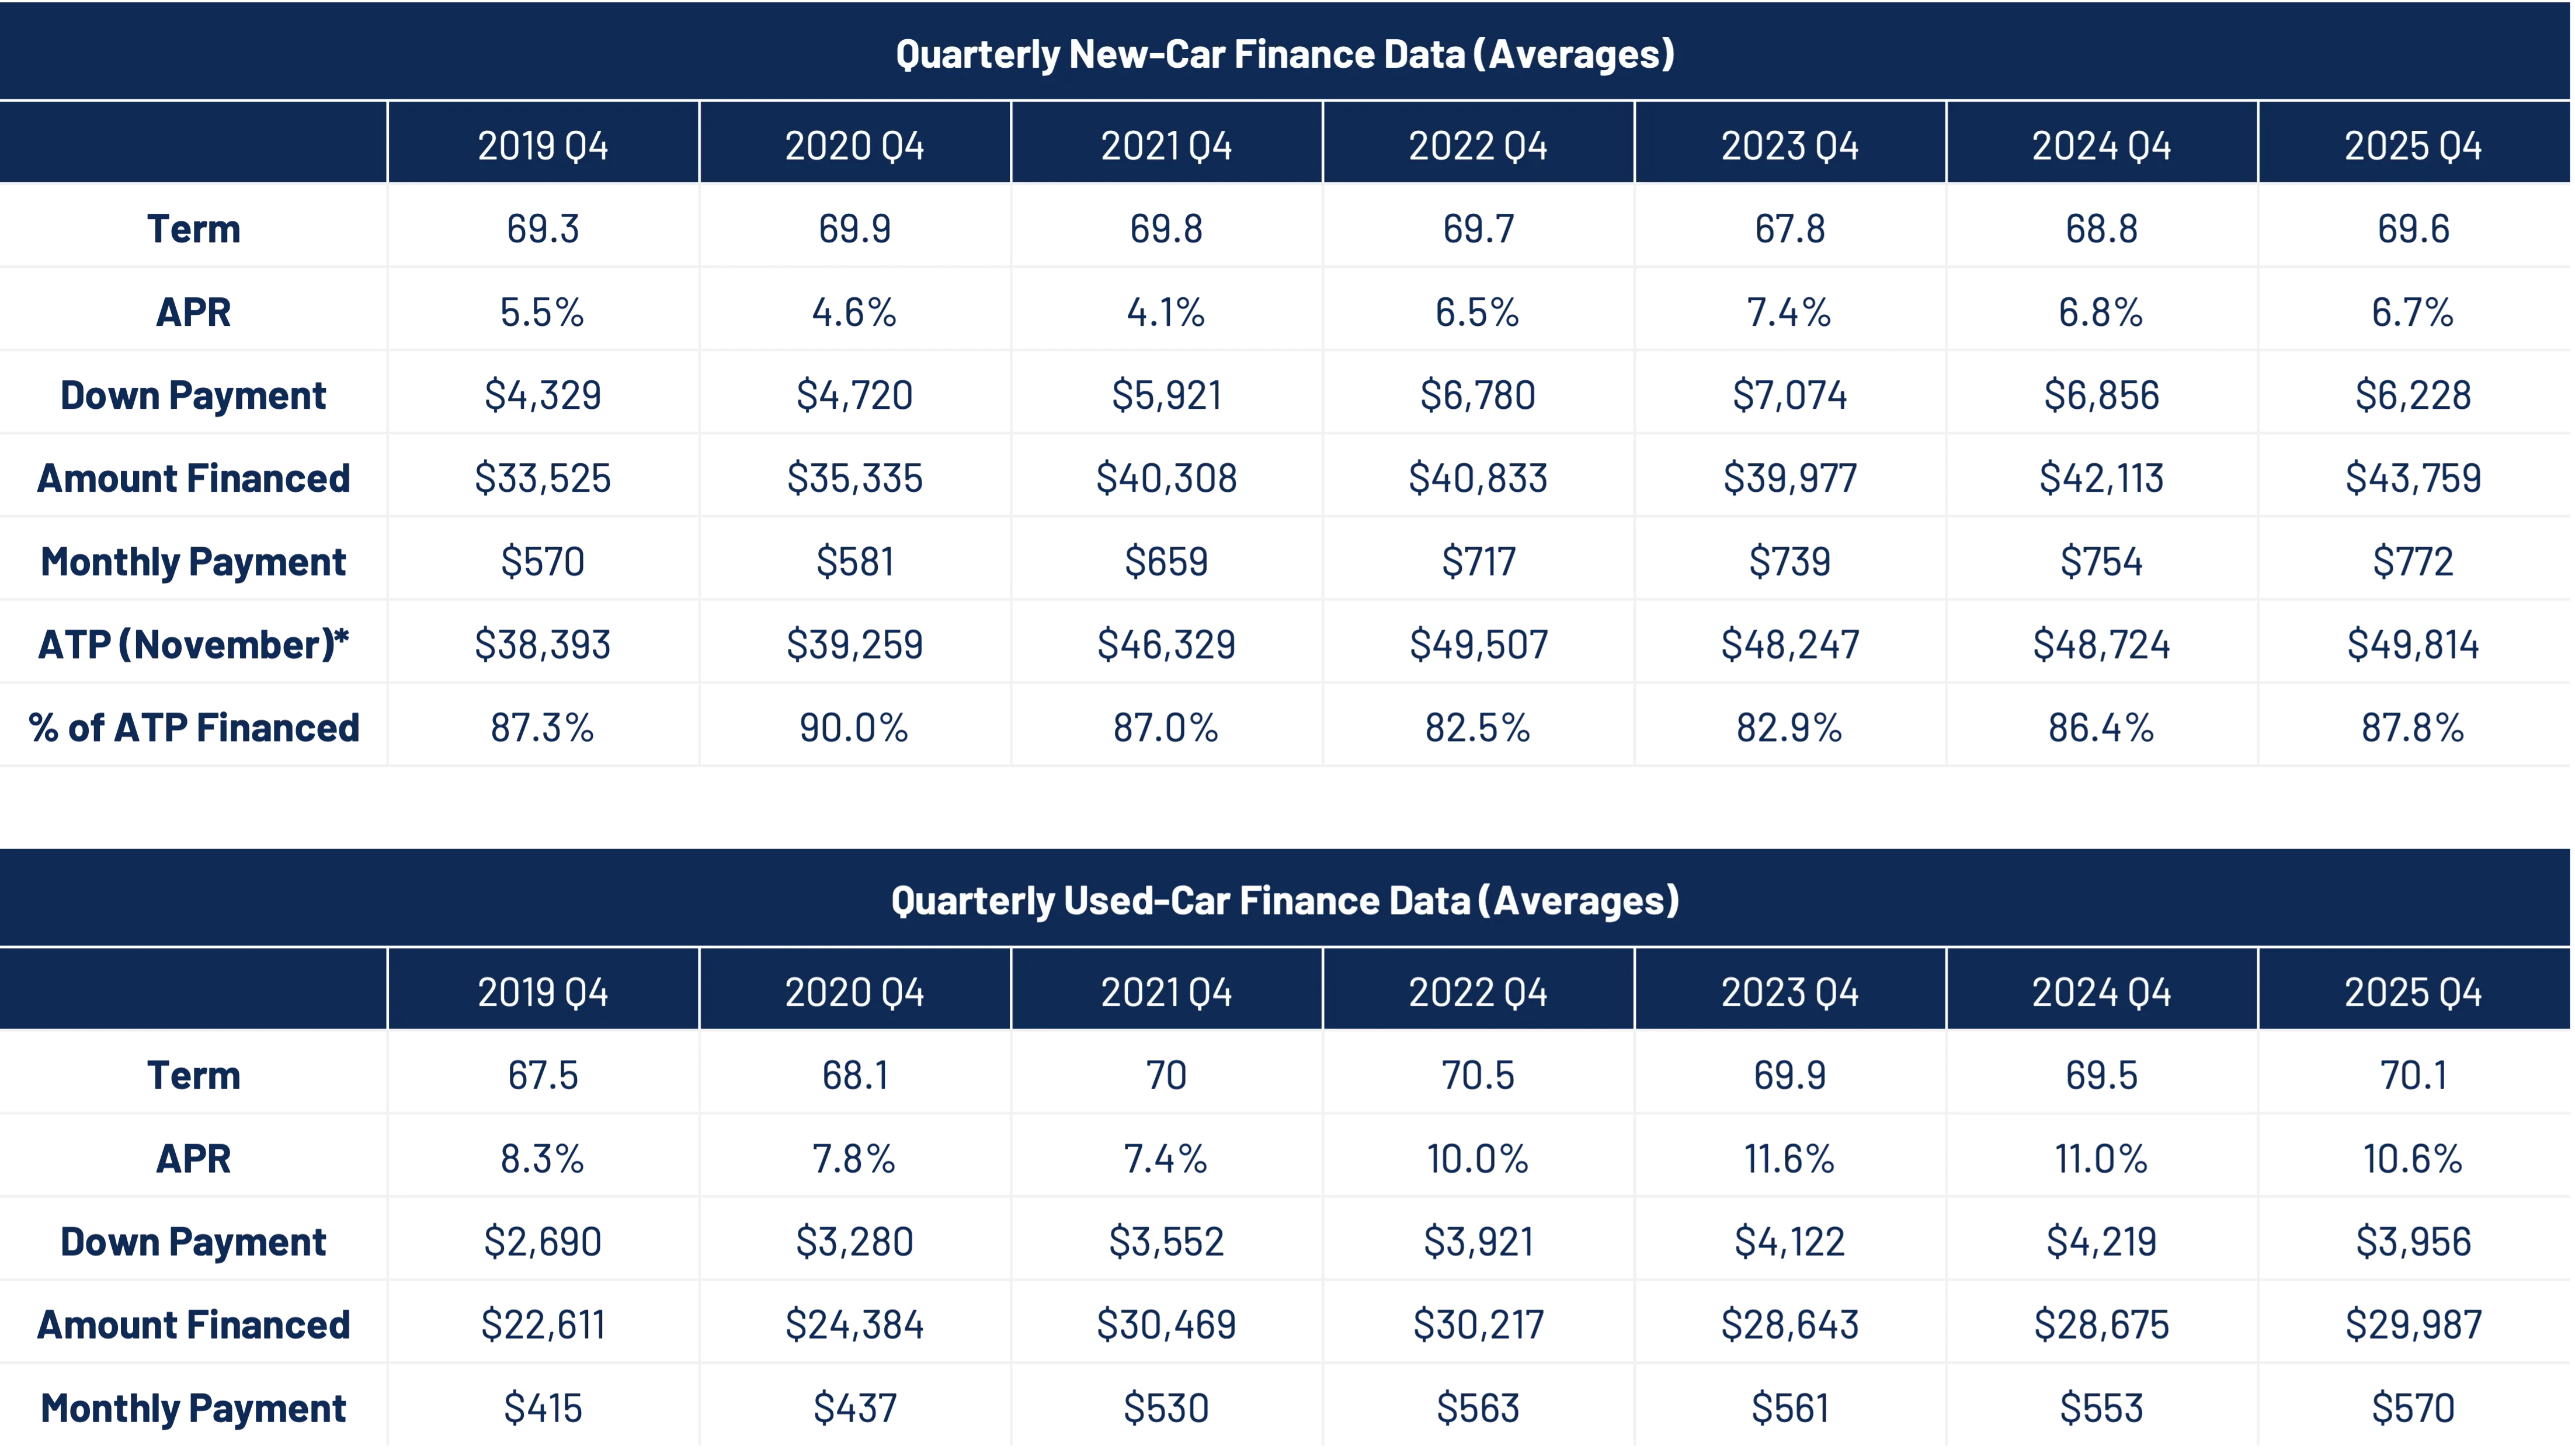
Based on Edmunds' financing data, it's clear the metrics continue to creep in concerning directions. Consumers are financing more dollars on average, putting down less money, and taking on longer loans with a higher monthly payment. The only bright spot could be slightly lower interest rates and improved new vehicle incentives. However, all this data indicates increased pressure on household budgets.
Used vehicle trends are moving in a similar direction. A 2024 study by Empower found that 57% of respondents were keeping their existing automobile longer because of the increased costs to replace it with a new(er) one. Almost a third of responses noted car payments being their biggest expense.
A recent Synchrony study found that auto owners had underestimated the cost of ownership by over $4,500, driven by average annual gas ($1,956) and insurance ($1,730) costs. Items like service and repairs ($659), maintenance ($622), tires ($377), and other auto parts or accessories ($240) are also contributing to increasing costs of ownership. The survey also indicated a decline in multi-vehicle households.
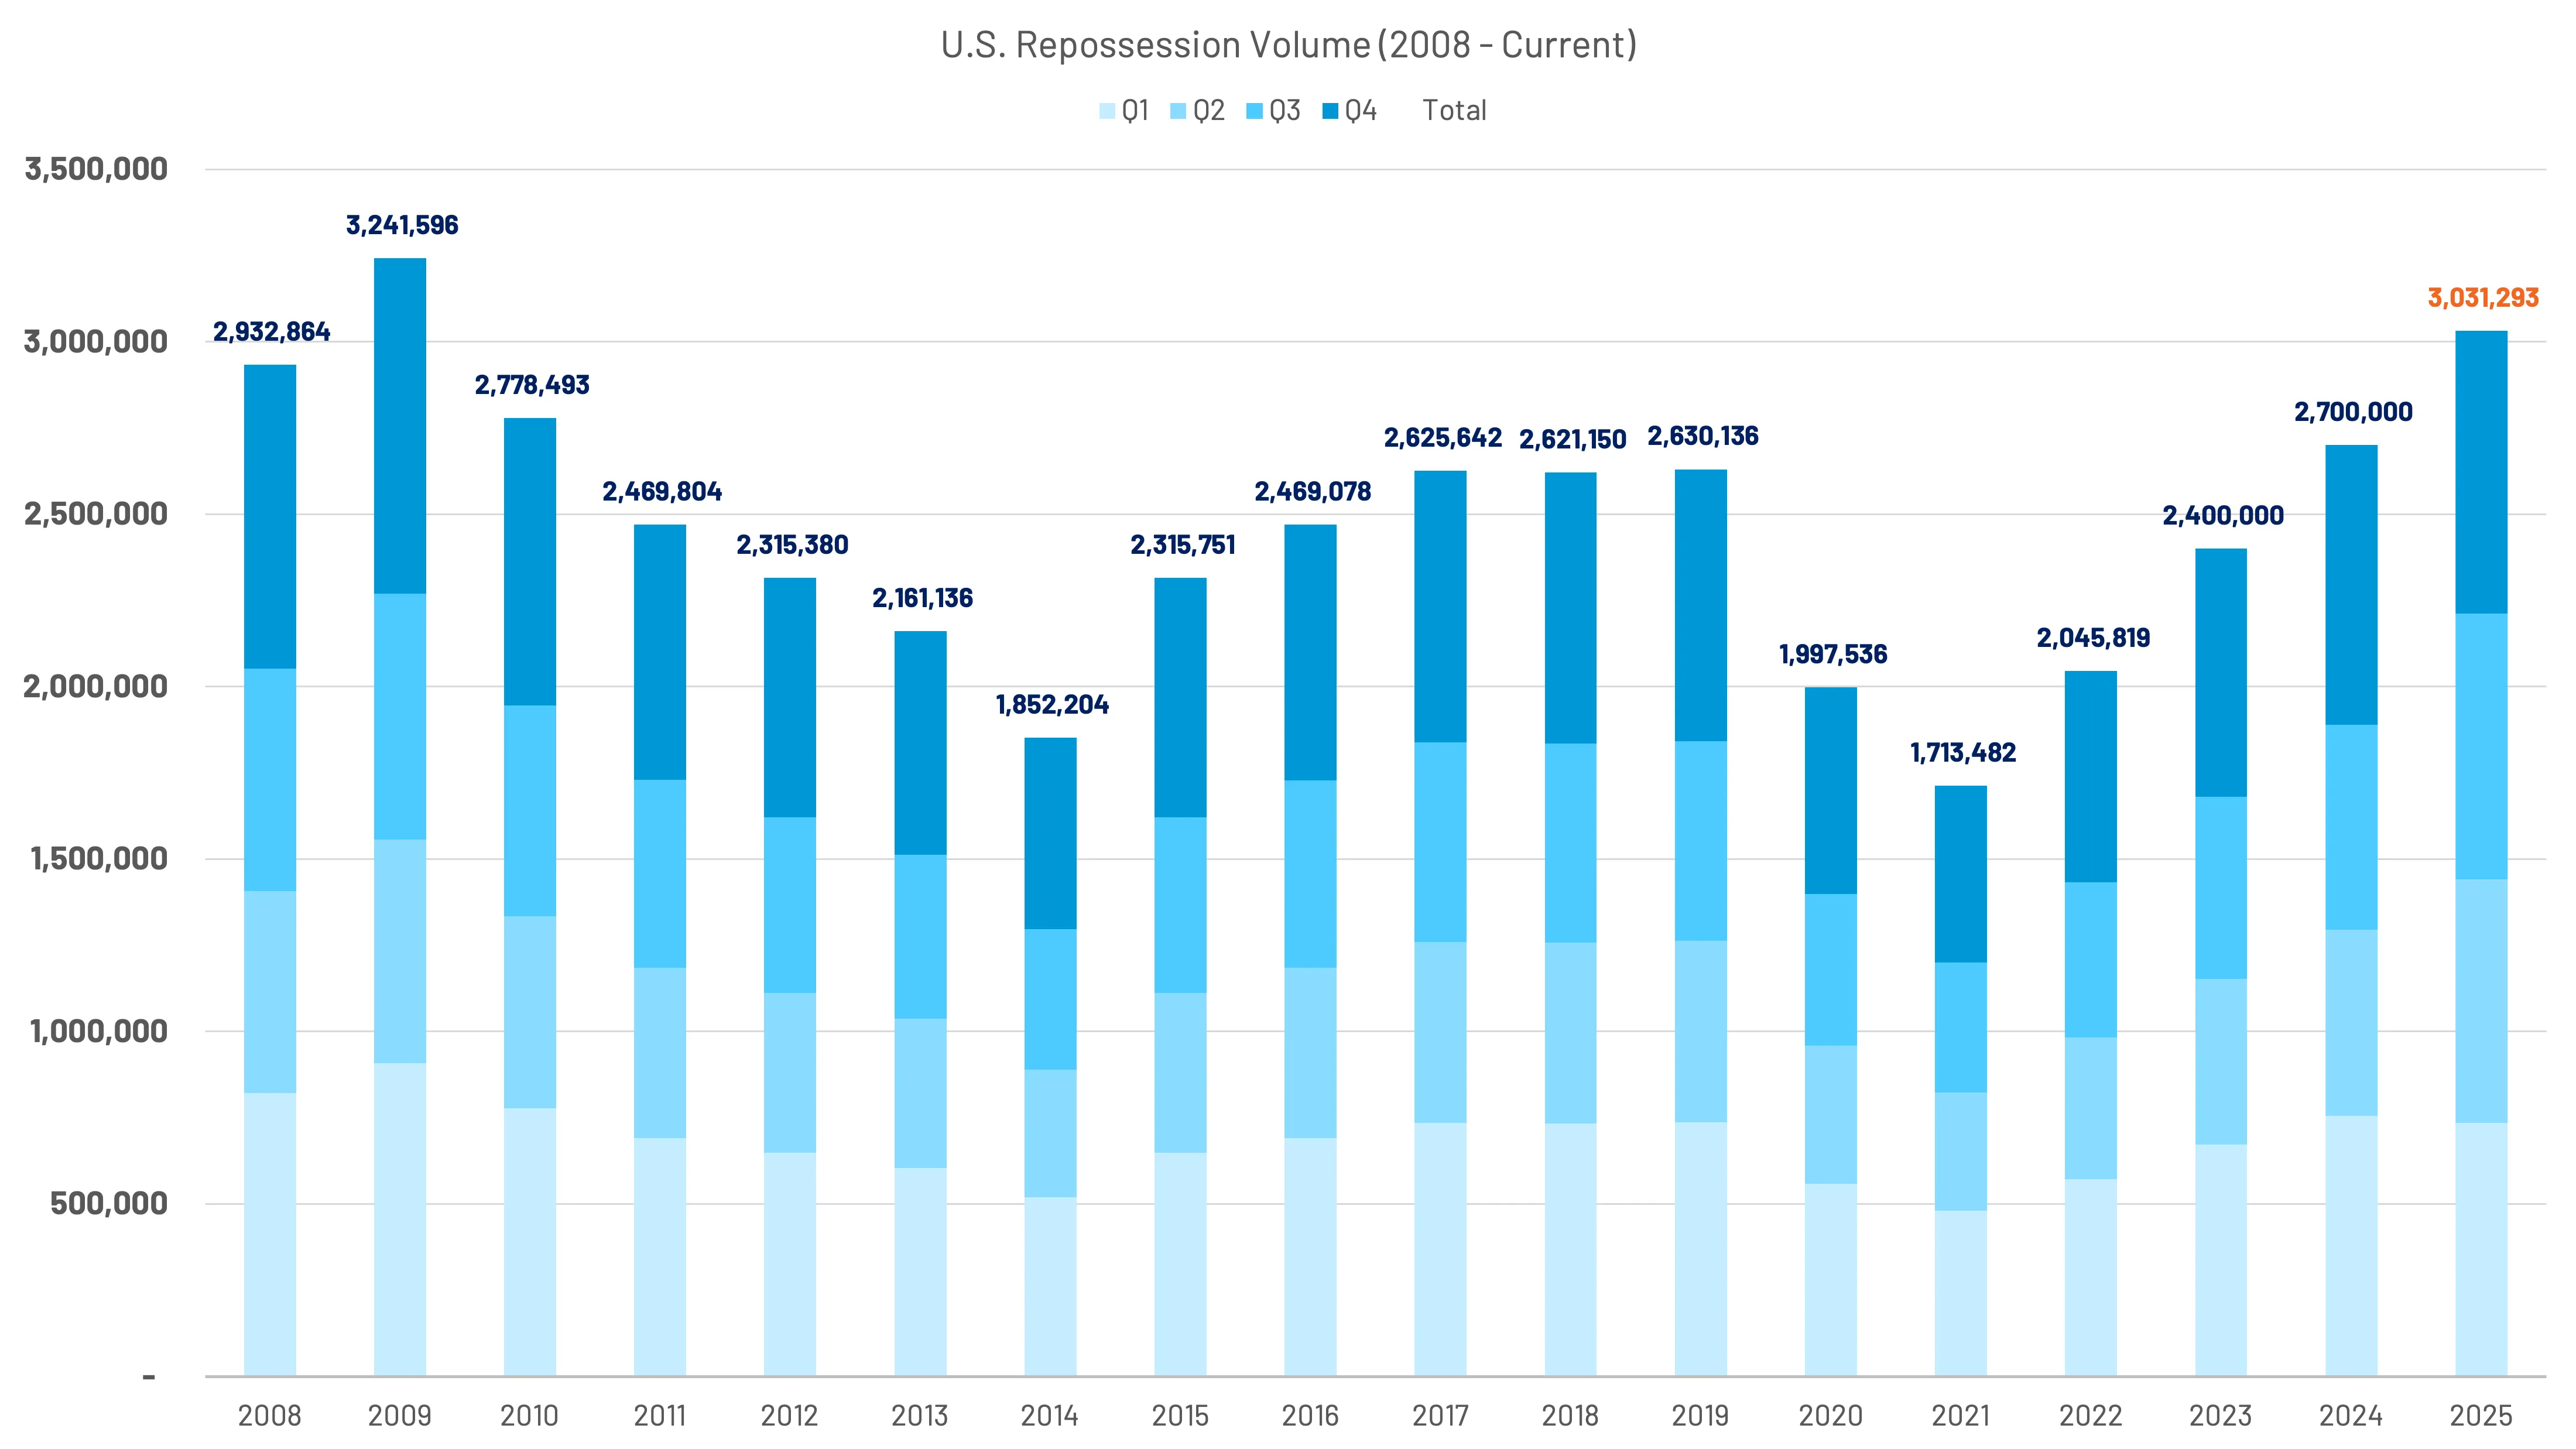
As vehicle affordability continues to pose challenges to American households, it might not be a surprise to find a continued rise of repossessions in the U.S. Repossessions have steadily risen since hitting a low in 2021, increasing by 300,000 or more each year, and expected to breach the three-million-unit threshold for the first time since 2009, which was in the midst of the global financial crisis.
According to Fitch Ratings, 6.74% of subprime auto borrowers were at least 60 days past due in their loans in December, a new record. At the same time, 0.43% of prime auto borrowers were at least 60 days delinquent.
New York Federal Reserve Bank data reflects a very modest decrease, on average, of auto loans transitioning into serious delinquency in Q4 2025. (Figure 6) The data does, though, indicate a small, yet noticeable, increase for 50+ year-old consumers, relative to their younger peers.
2025 is Forecasted to Eclipse 2024 by over 300,000 repossessions
Liability remains a better litmus test for APD claims, as these tend to be claims least affected by consumer behavior, except for consumers going uninsured. More often than not, liability claims get filed.
Another dynamic emerging alongside affordability pressure is a shift in consumer attitudes toward insurance fraud – particularly so-called "soft fraud." When household budgets tighten, behaviors that once felt unacceptable can become rationalized to offset rising insurance costs. A recent study found that 9% of millennials reported asking repairers to inflate repair estimates to help cover deductibles, while 21% of millennial policyholders admitted to committing some form of insurance fraud. Even more telling, 60% said they had submitted a claim for preexisting vehicle damage.
These behaviors may not be viewed by many consumers as deliberate or organized fraud, yet when similar actions occur across millions of claims, the cumulative financial impact becomes meaningful, and the result a self-reinforcing cycle: rising costs place pressure on consumers, opportunistic behaviors increase, and the resulting losses ultimately flow back into premiums across all insureds.
As more consumers downgrade coverage, increase deductibles, or forego insurance entirely, several dynamics begin to emerge:
First, liability claims – particularly those involving uninsured or underinsured motorists – become more structurally significant. Second, among those who remain insured, higher deductibles and affordability sensitivity influence whether lower-severity losses are filed at all. In some cases, affordability pressures may also encourage opportunistic claim behavior or cost inflation intended to offset out-of-pocket expenses, further complicating claims resolution and contributing to upward pressure on overall system costs.
Important to note is that after several years of significant rate increases to restore profitability, many carriers are now working to moderate or reduce premiums as loss ratios improve. If affordability stabilizes, insured counts and claims volume could begin to normalize, though likely within a more complex severity environment.

As policyholders struggle with affordability challenges, lower severity claims are now being treated as optional consumer purchases. Higher deductibles, coverage downgrades, and out-of-pocket repair choices are reducing the filing of smaller claims – particularly within first-party coverages – reshaping the severity mix that remains in the system. This behavioral shift has contributed, in part, to improved headline underwriting performance.
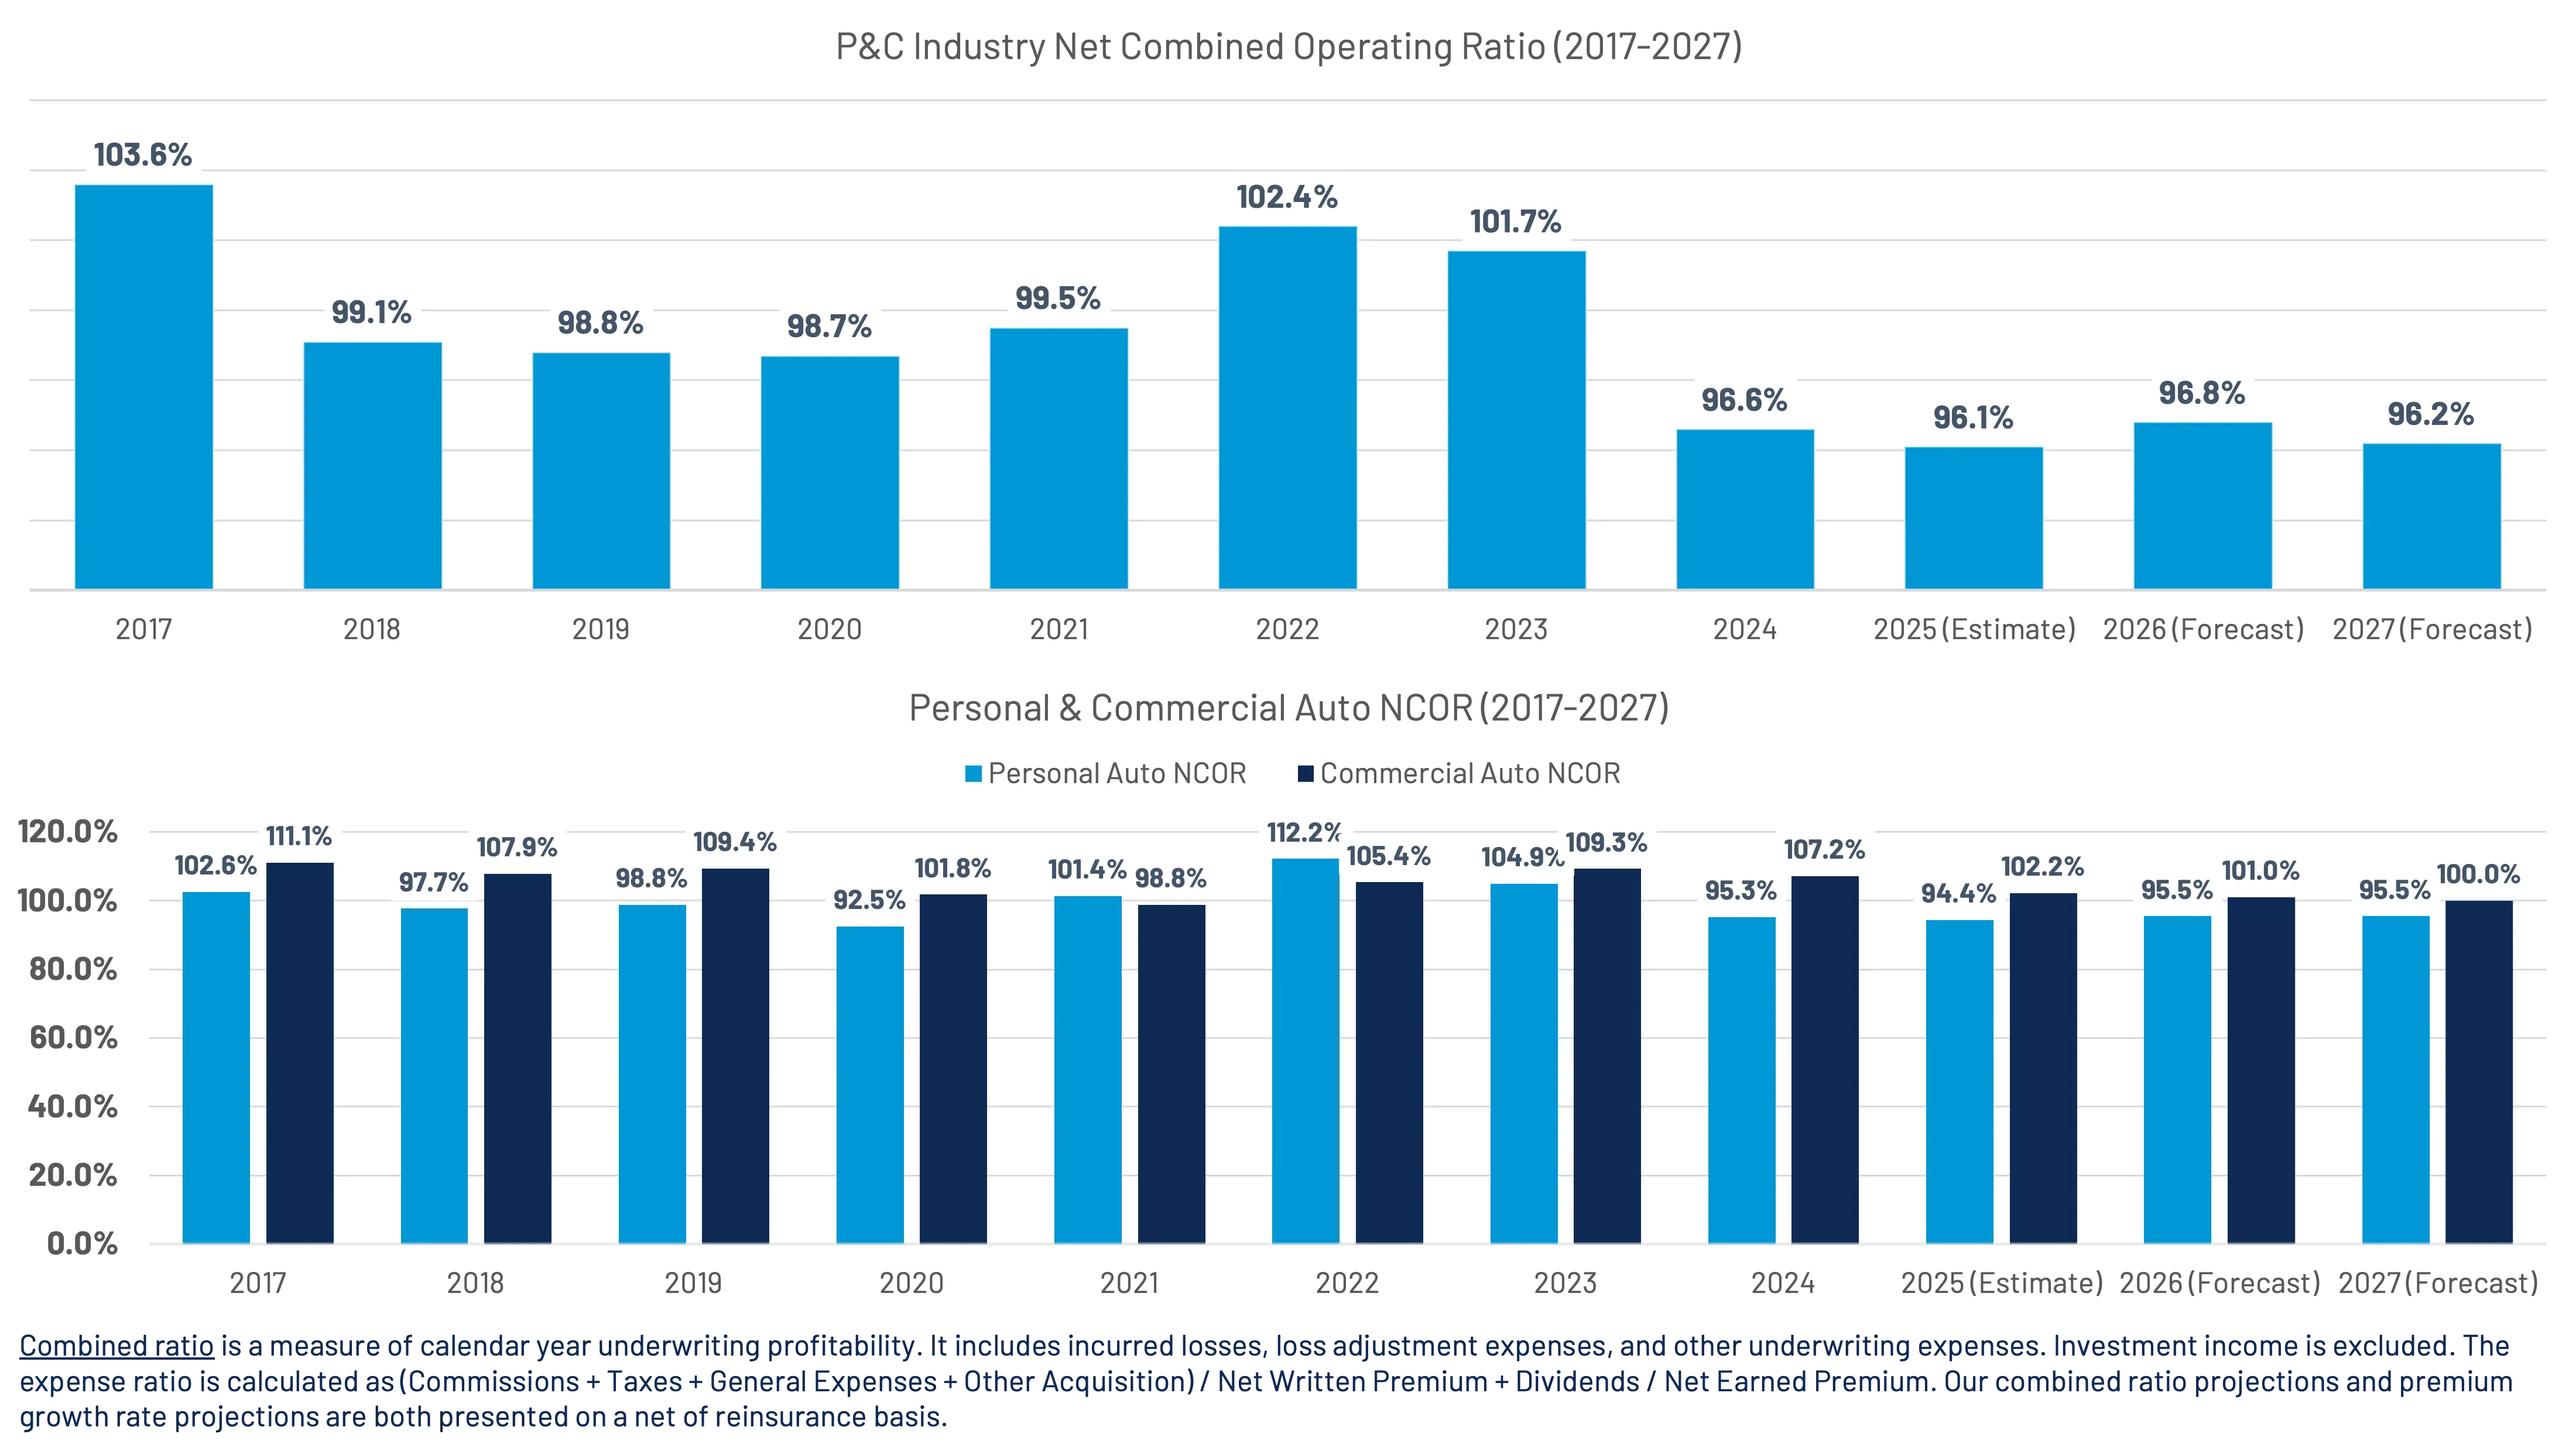
In 2025, the P&C industry combined ratio improved to 96.1% and personal auto improved to 94.4%, a full 17.8% lower than 2022 and 10.5% lower than 2023. Net written premium growth slowed materially to an estimated 3.6% in 2025 from 14.4% (2023) and 12.8% (2024), reflecting the shifts in the rates needed to offset profitability challenges. The overall personal auto loss ratio continues to trend downward. (Figure 7)
Yet, the surface-level improvement masks a meaningful divergence.
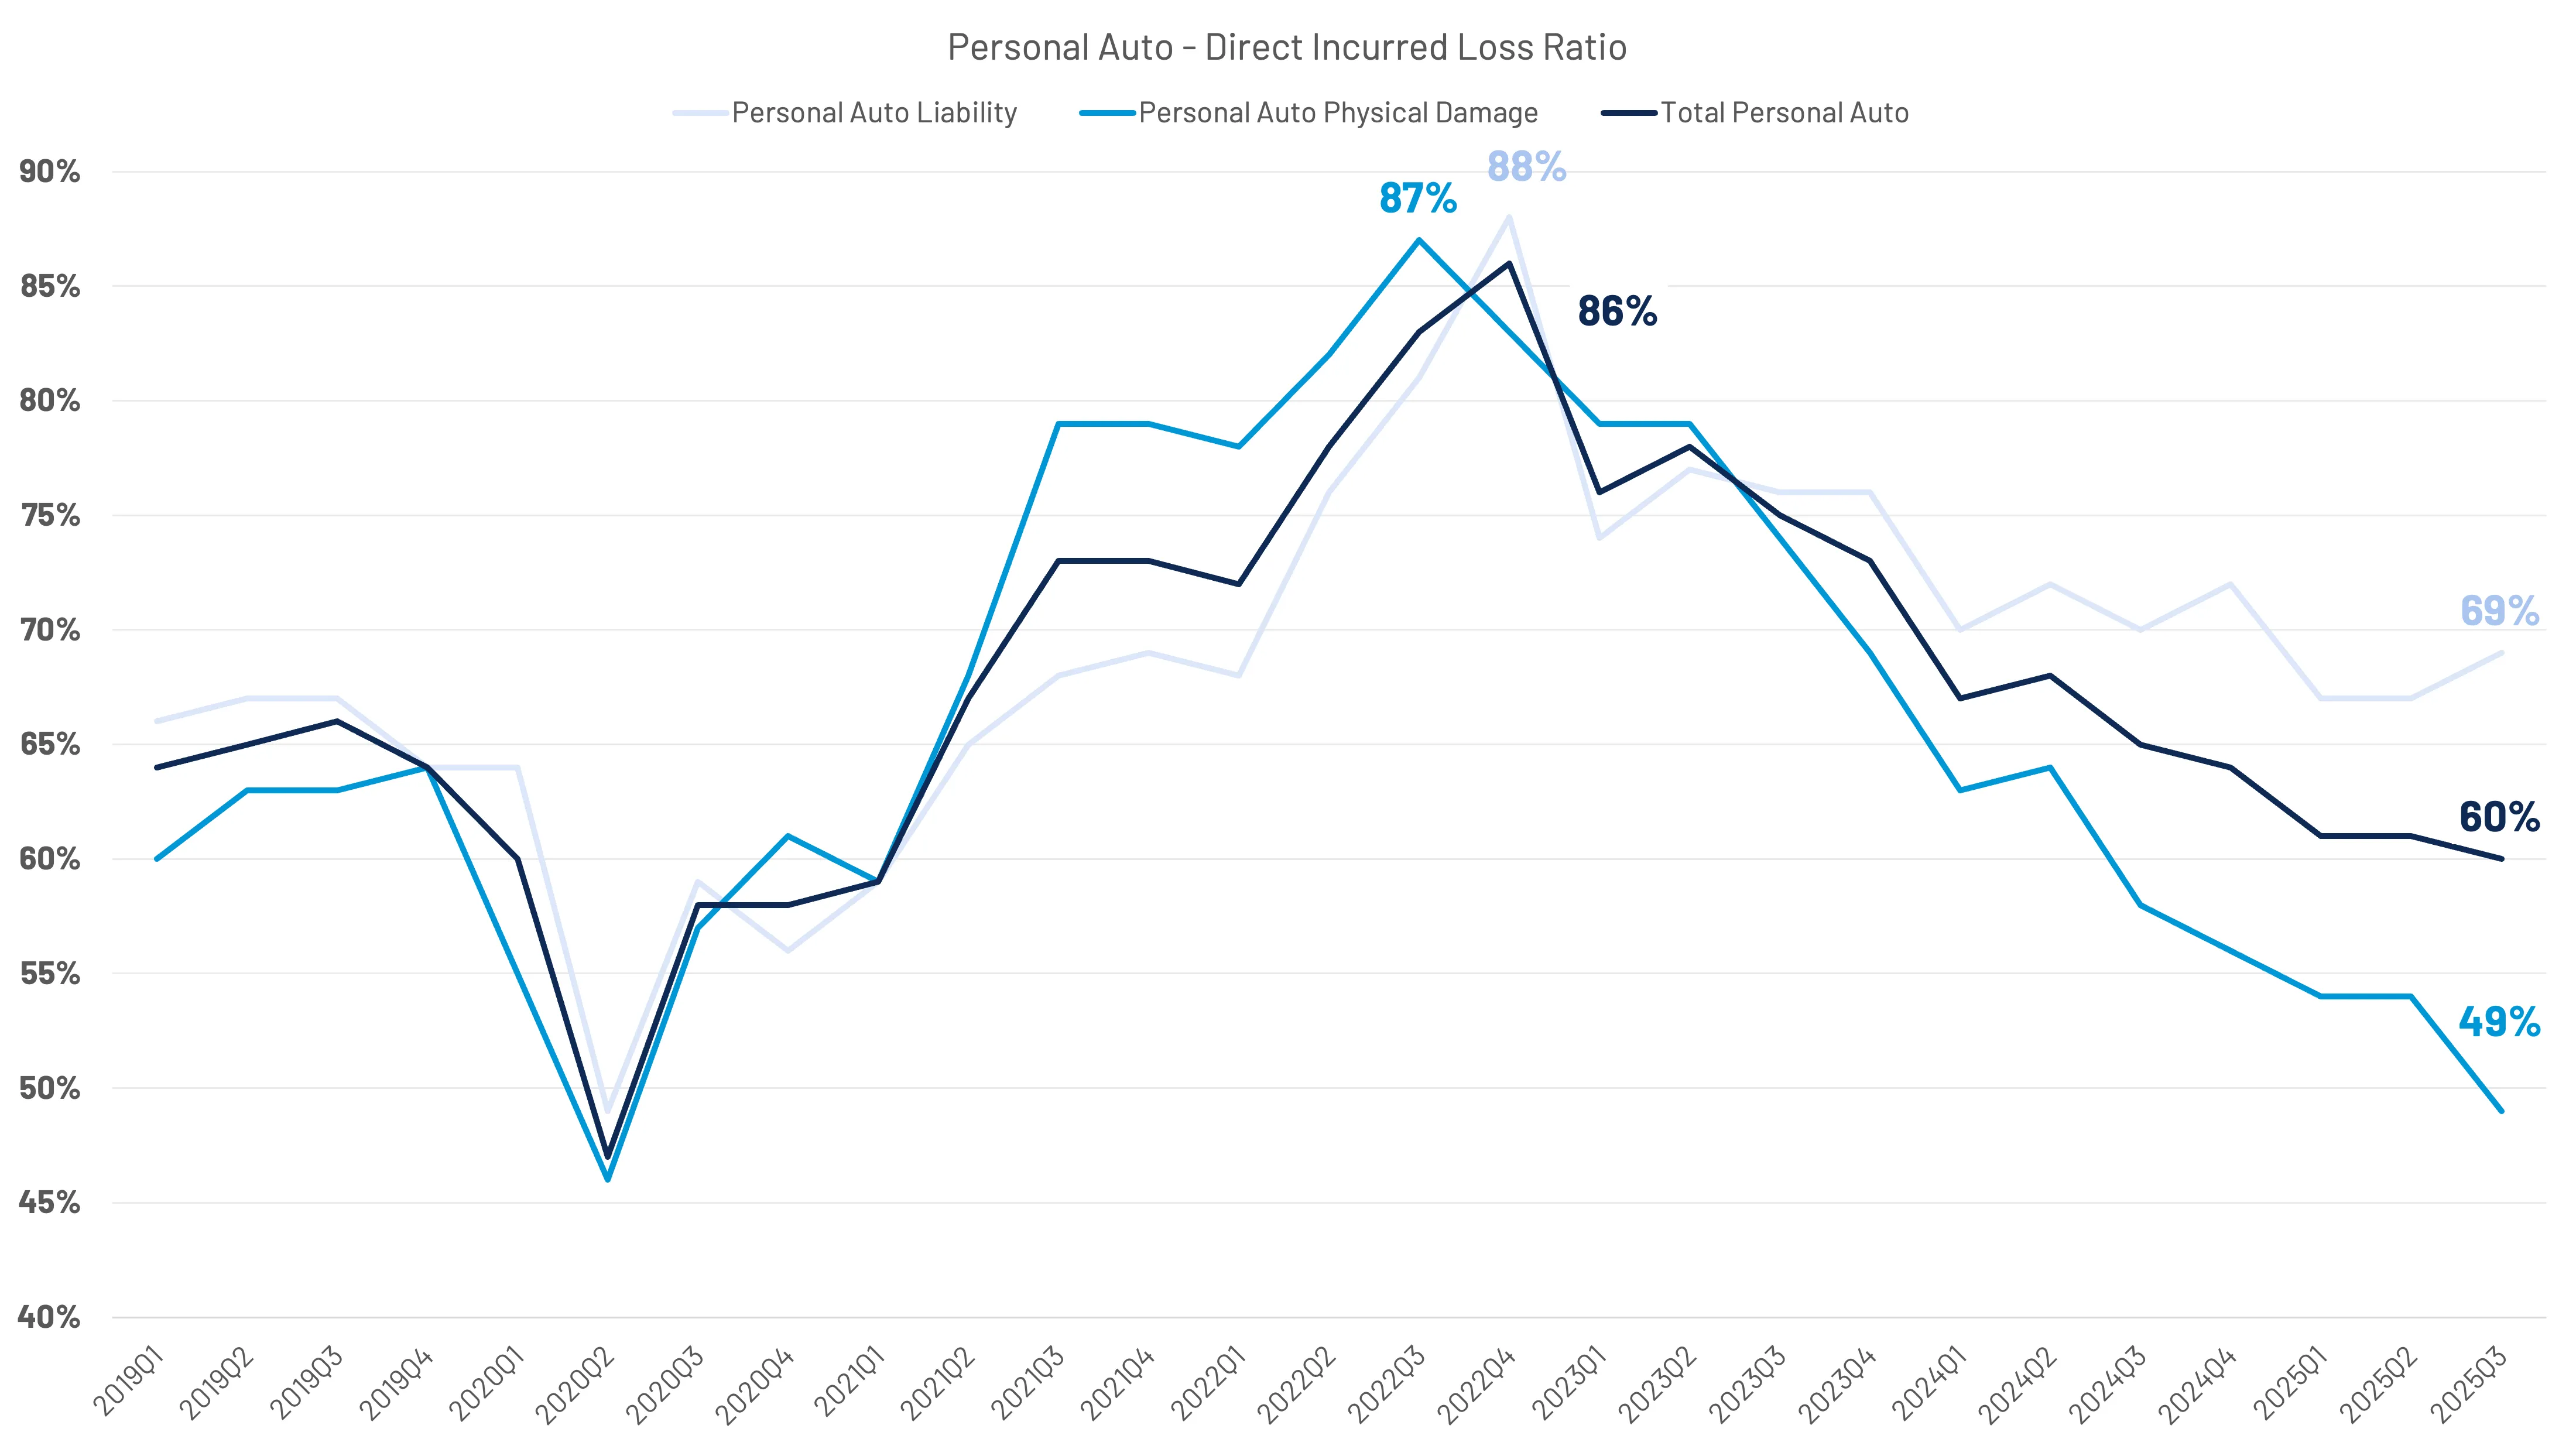
The overall personal auto loss insurance loss ratio – calculated by dividing losses (paid/pending) by earned premium – continues to trend downwards as liability trends upwards, now running ~ 20 points higher than APD, driven primarily by rising casualty frequency and claims severity. Bodily injury, in particular, stands apart – increasing in both frequency and severity, and representing a growing obstacle to improved underwriting profitability. (Figure 8)
A notable contributor to 2025 results was comprehensive claims – or the lack thereof – throughout 2025, at least relative to 2024. Comprehensive volumes were down 16.1% based on CCC’s national industry data in 2025 and accounted for almost 40% of the overall volume variance (collision accounted for over 50%). When comprehensive claims were removed from the overall claims mix, volume was down 5.7%, a full 2-point difference.
Comprehensive is first-party coverage for events such as fire, theft, vandalism, flood, hail, animal strikes, falling objects, and glass-related claims (stone chips, cracks, etc.). Like collision, comprehensive carries a deductible for the policyholder. Comprehensive volume is generally unpredictable because it is, in many cases, a result of weather or happenstance, often referred to as "acts of God."
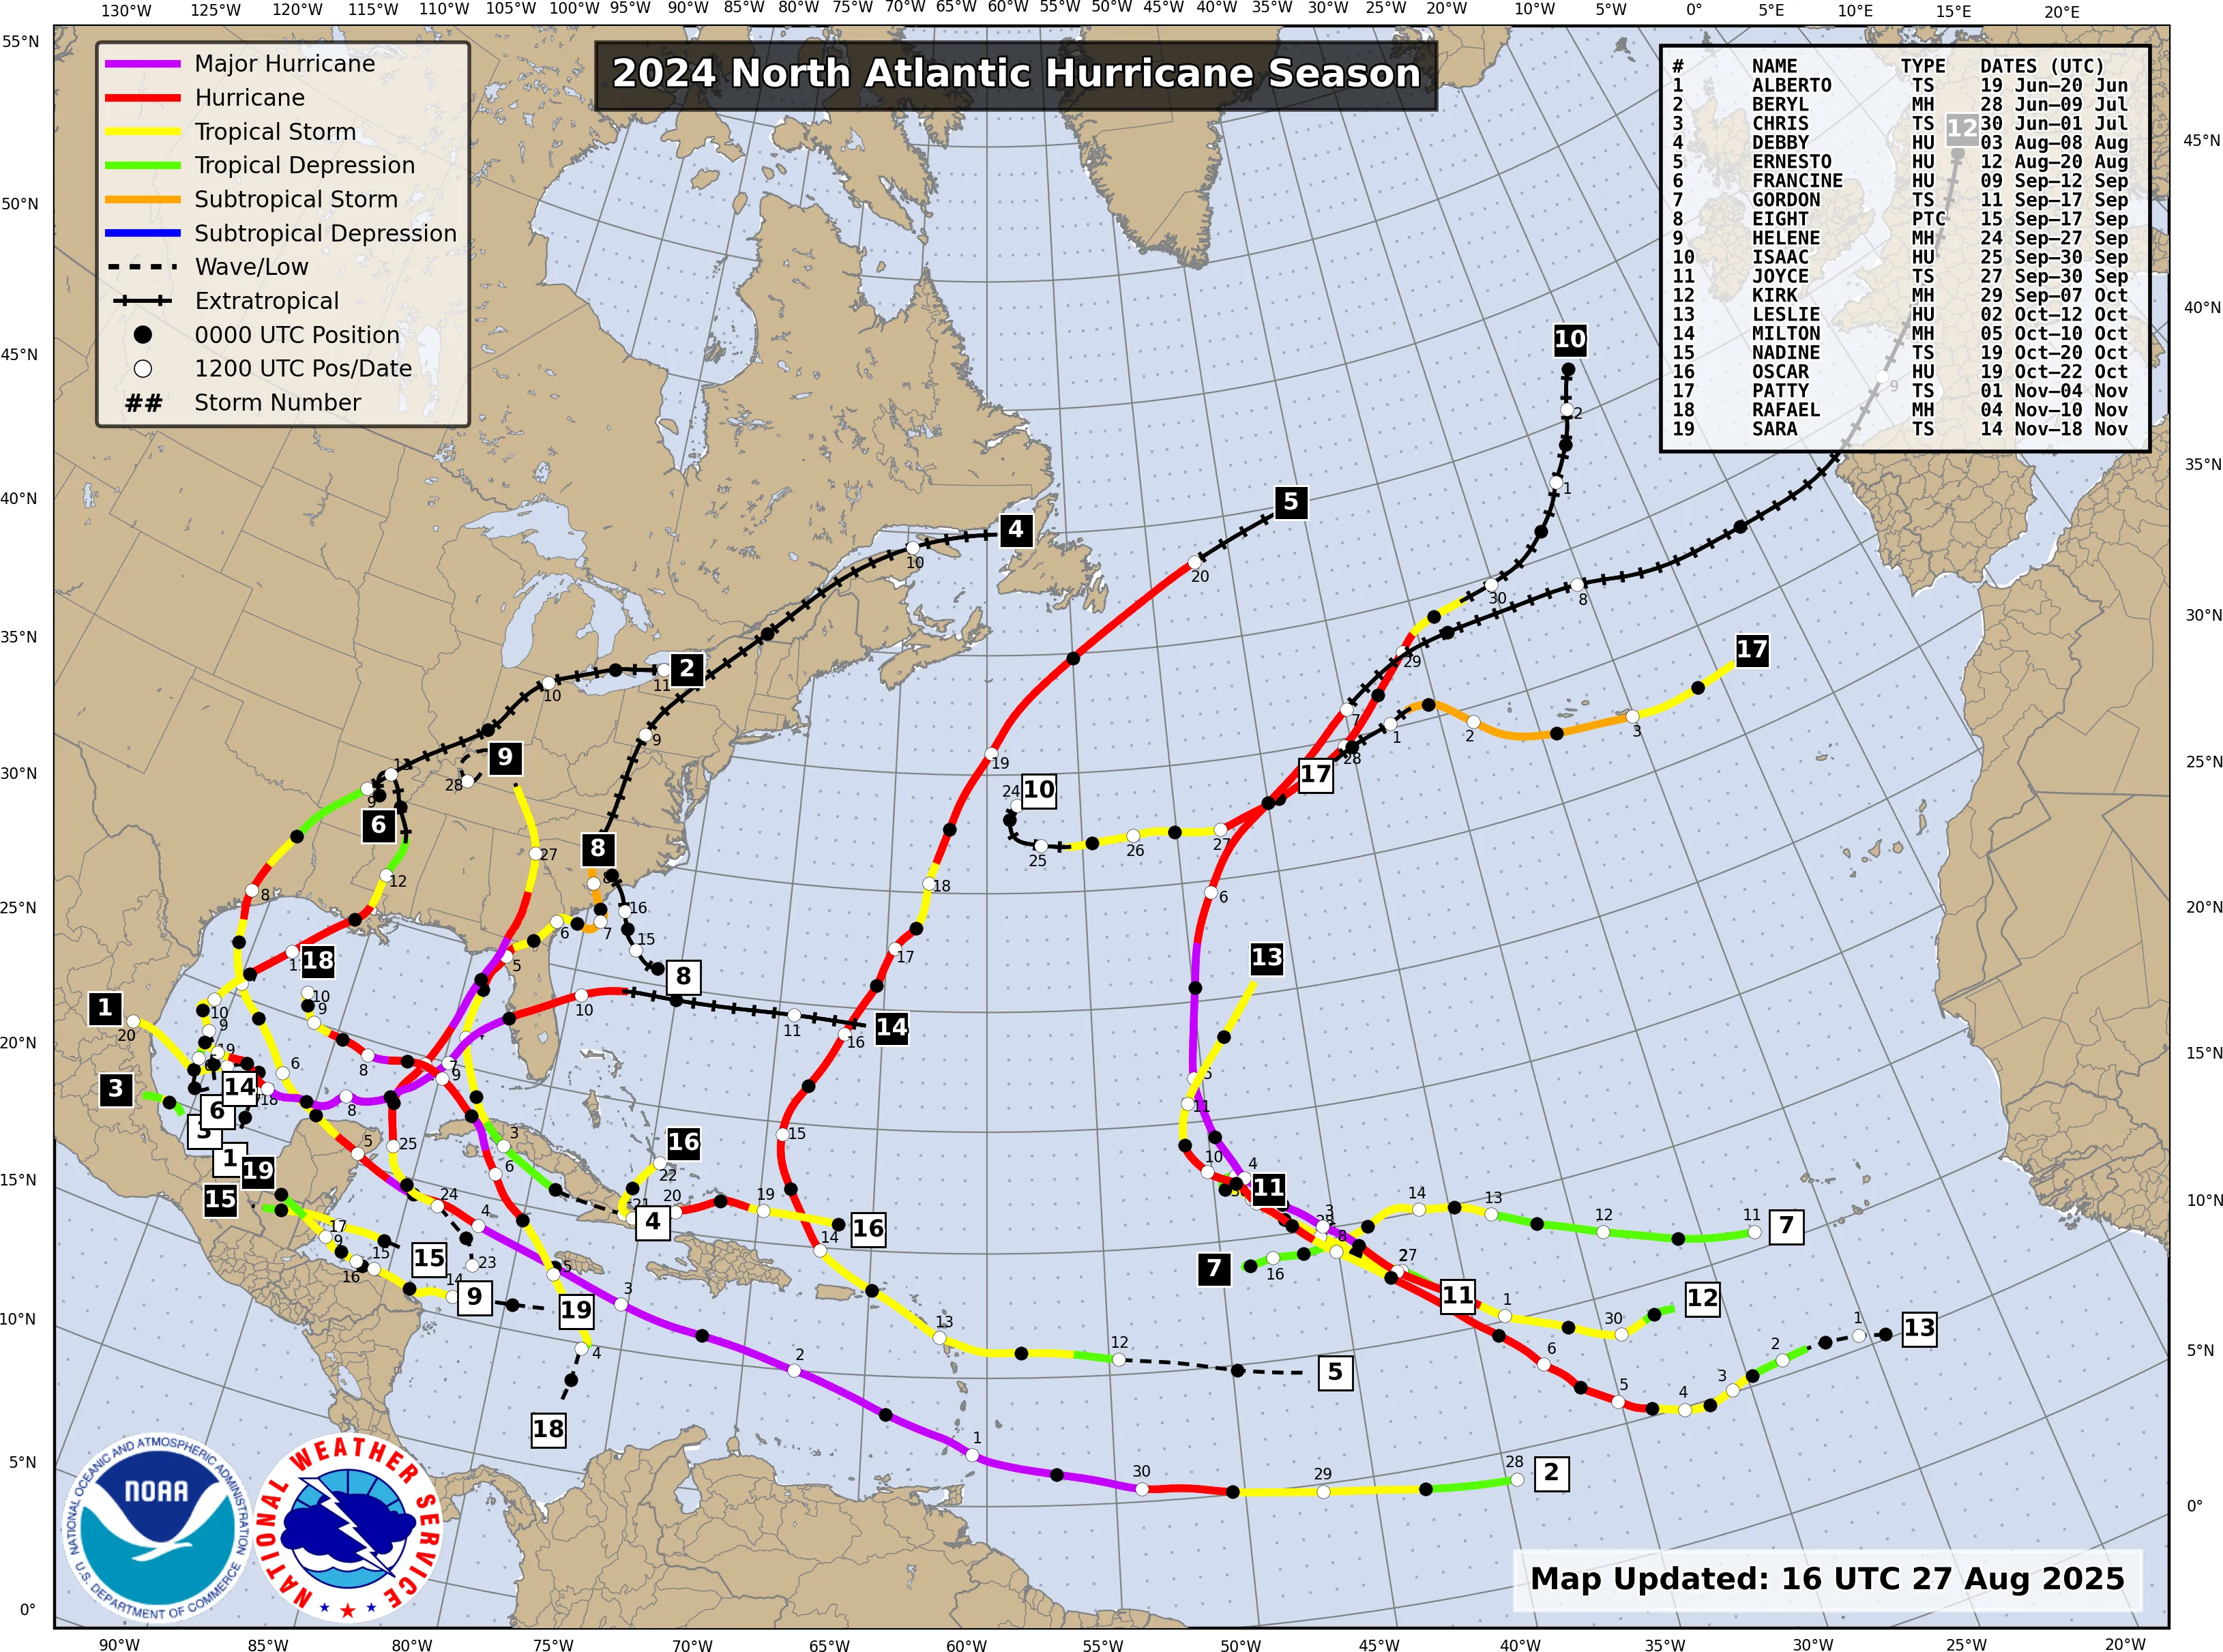
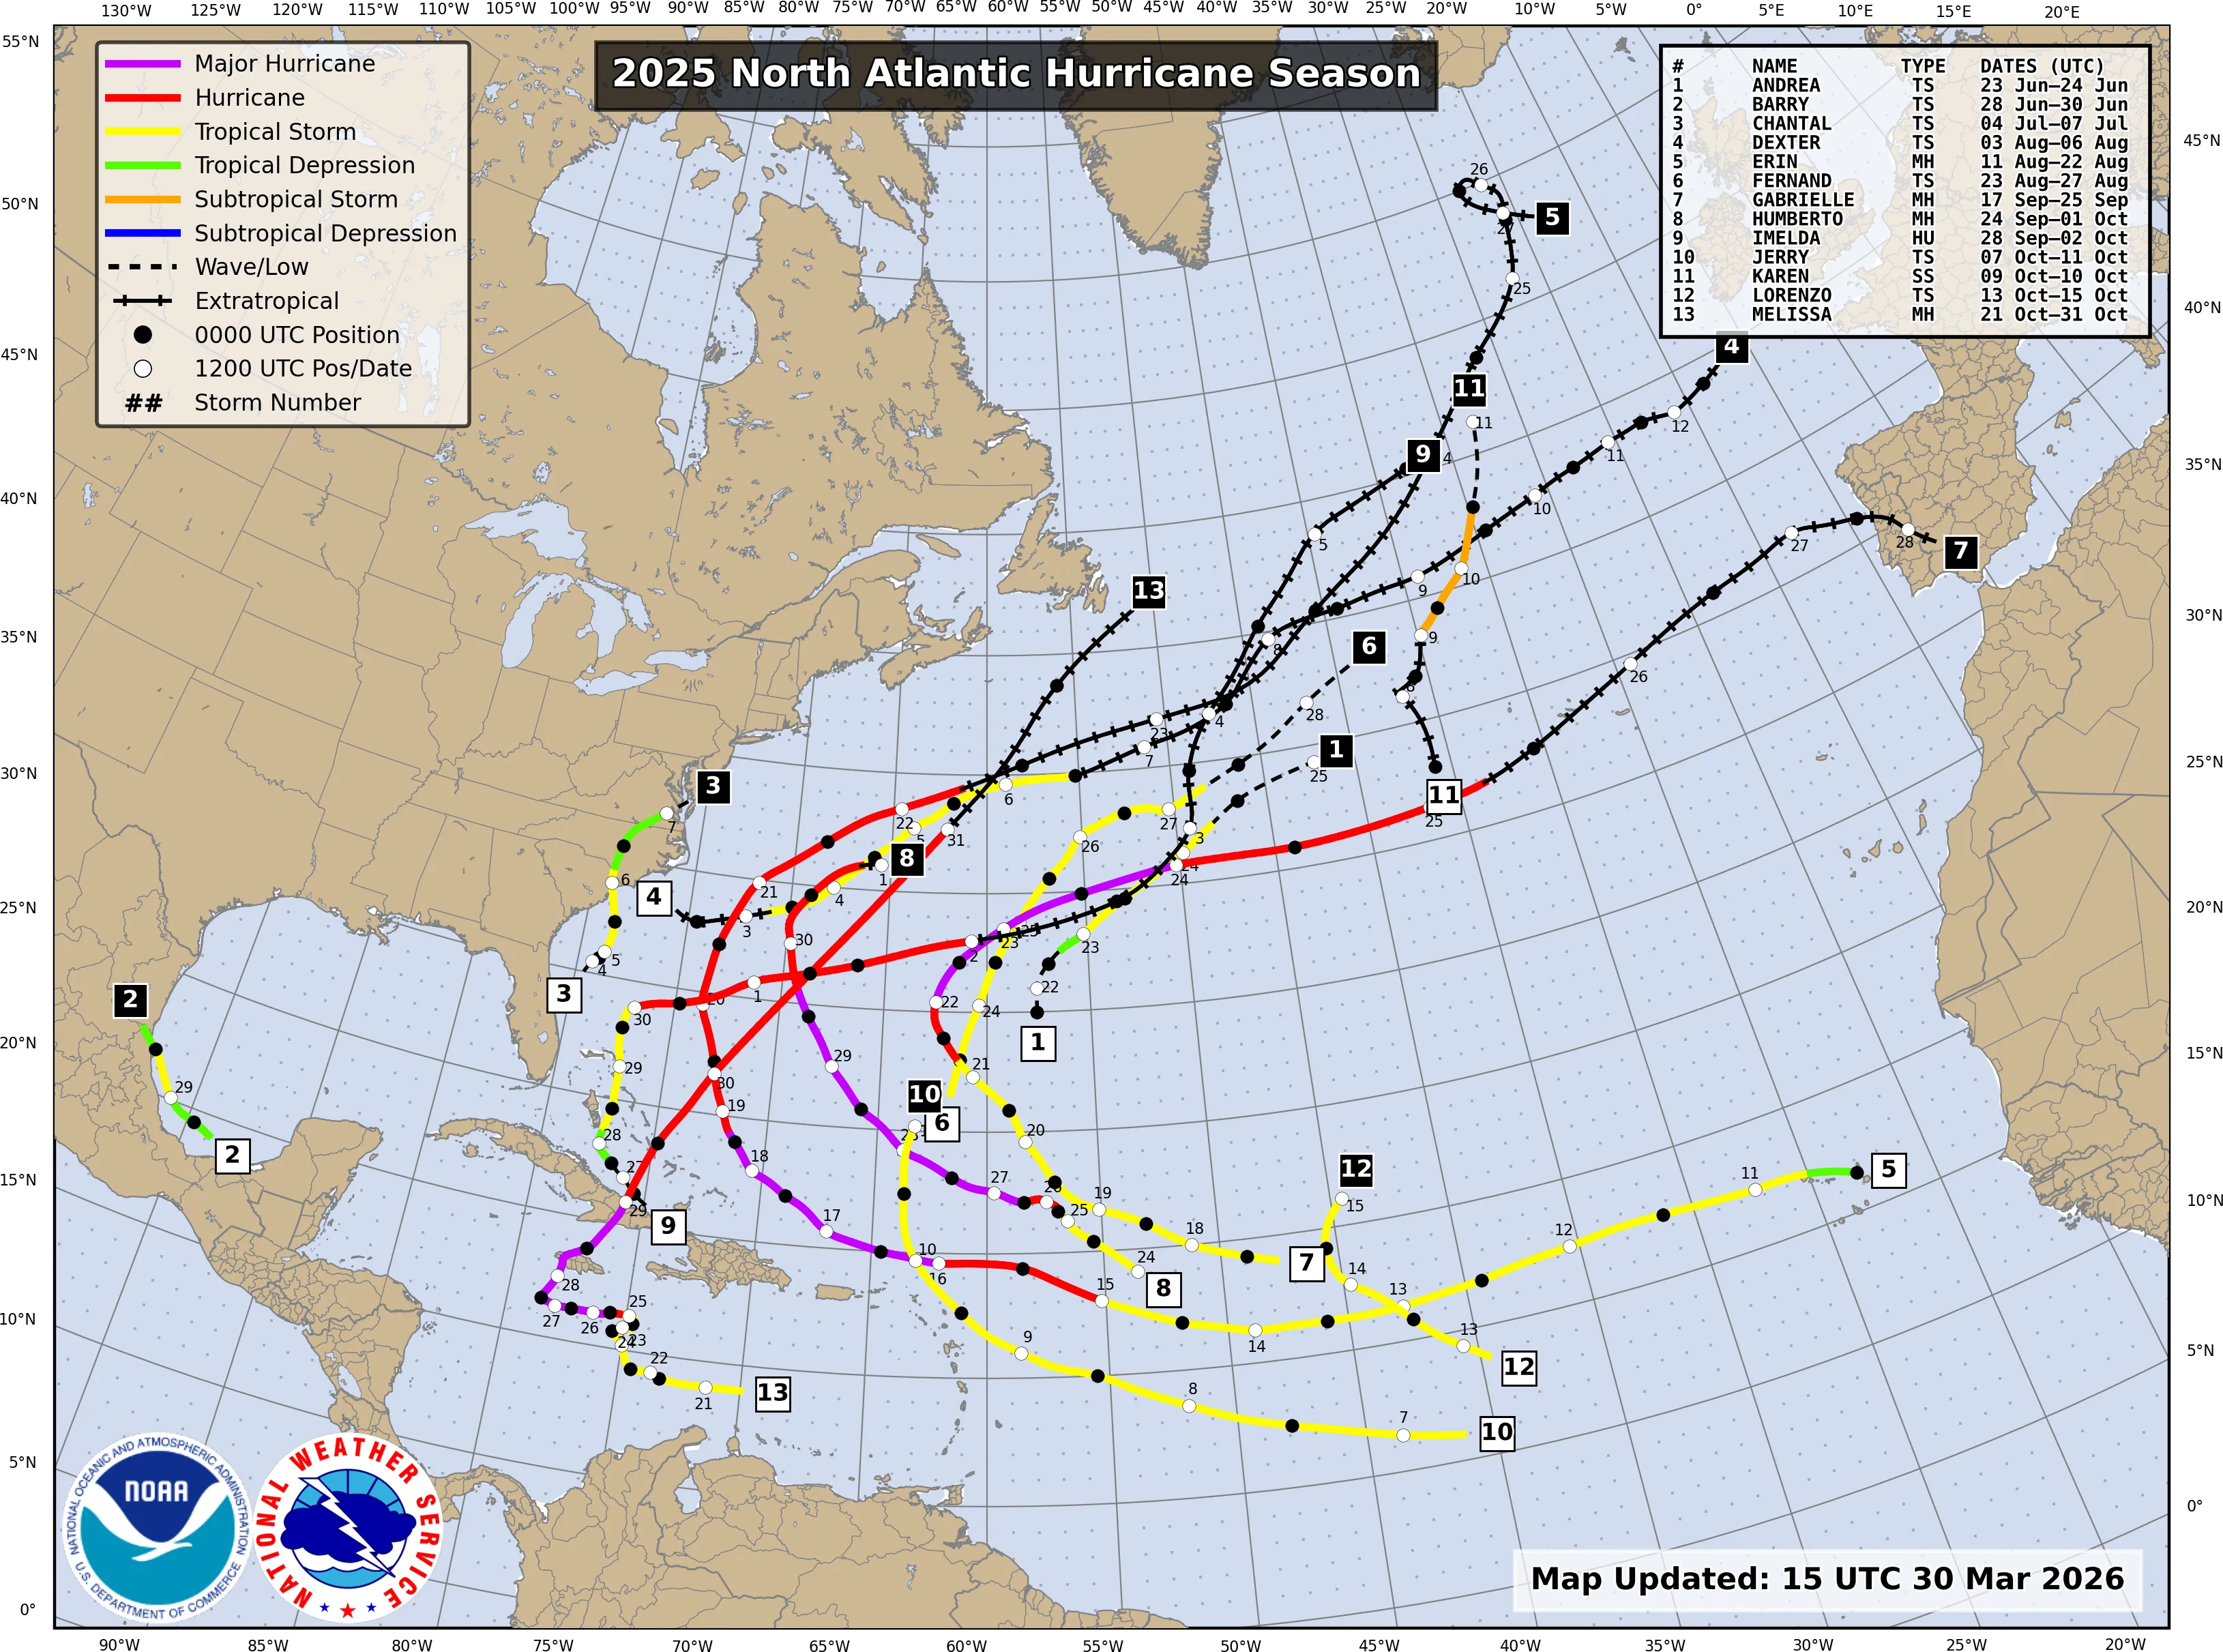
Three common causes of loss accounted for 2025 results: a decline in severe convective storm and/or hail events, a national decline in vehicle thefts, and an Atlantic Hurricane season that avoided the Gulf Coast and Eastern Seaboard.
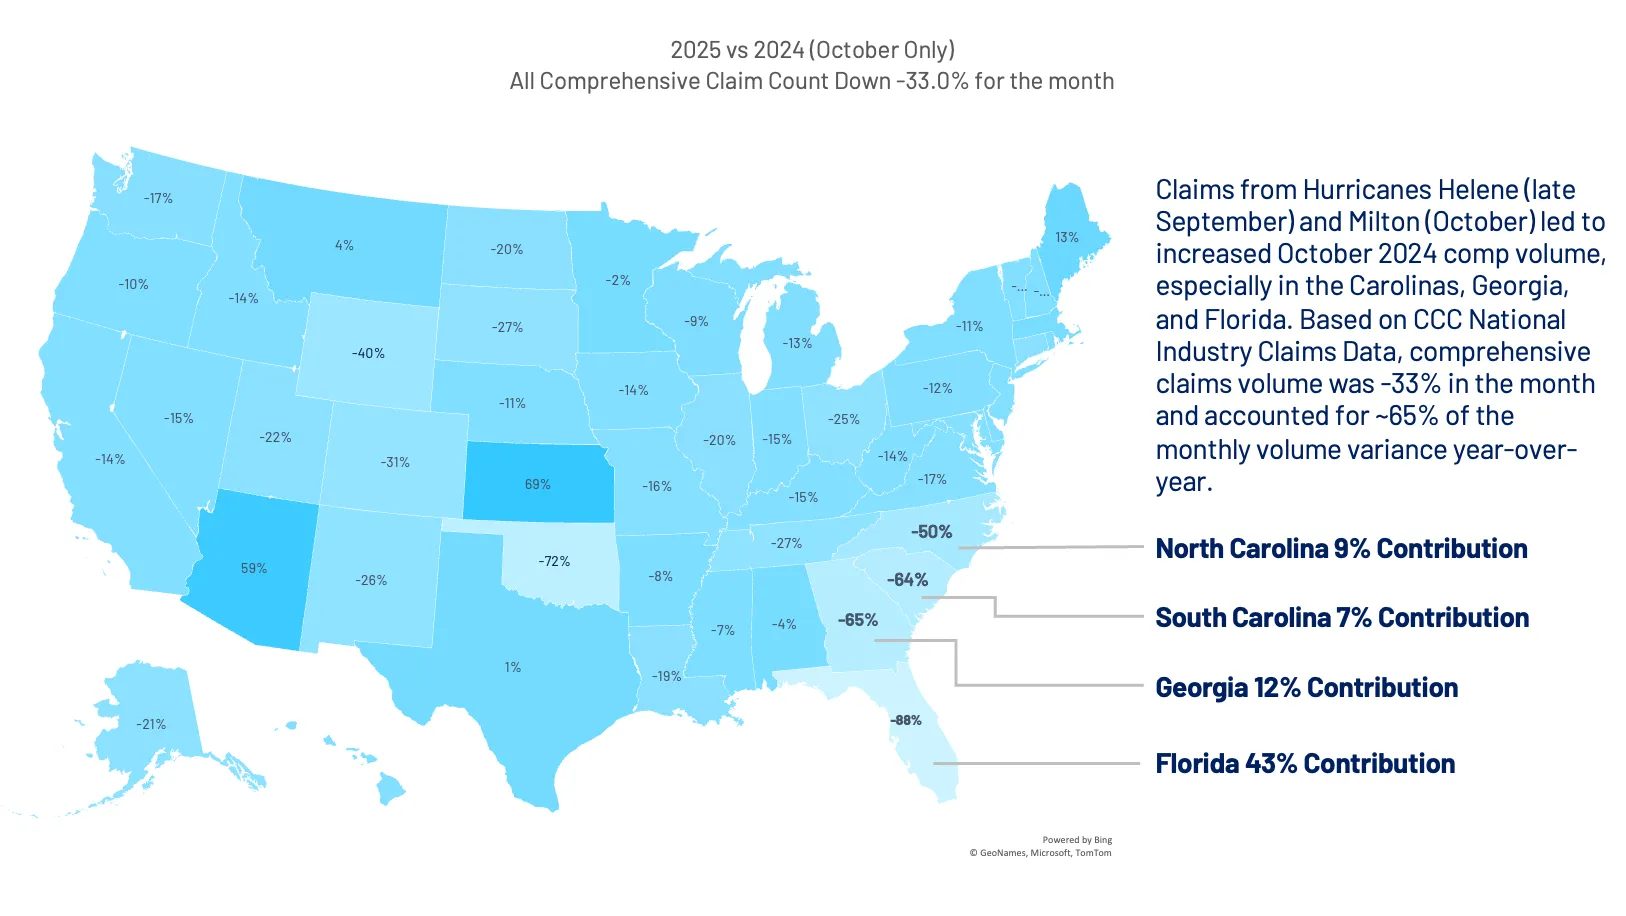
October 2025, in particular, saw massive shifts in comprehensive claim volumes year-over year. Claims from Hurricanes Helene (late September 2024) and Milton (October 2024) led to increased October 2024 comprehensive claims volume, especially in the Carolinas, Georgia, and Florida. Based on CCC National Industry Claims Data, comprehensive claims volume was -33% in the month and accounted for ~65% of the monthly volume variance year-over-year. (Figures 9, 10, and 11)
All Conditions
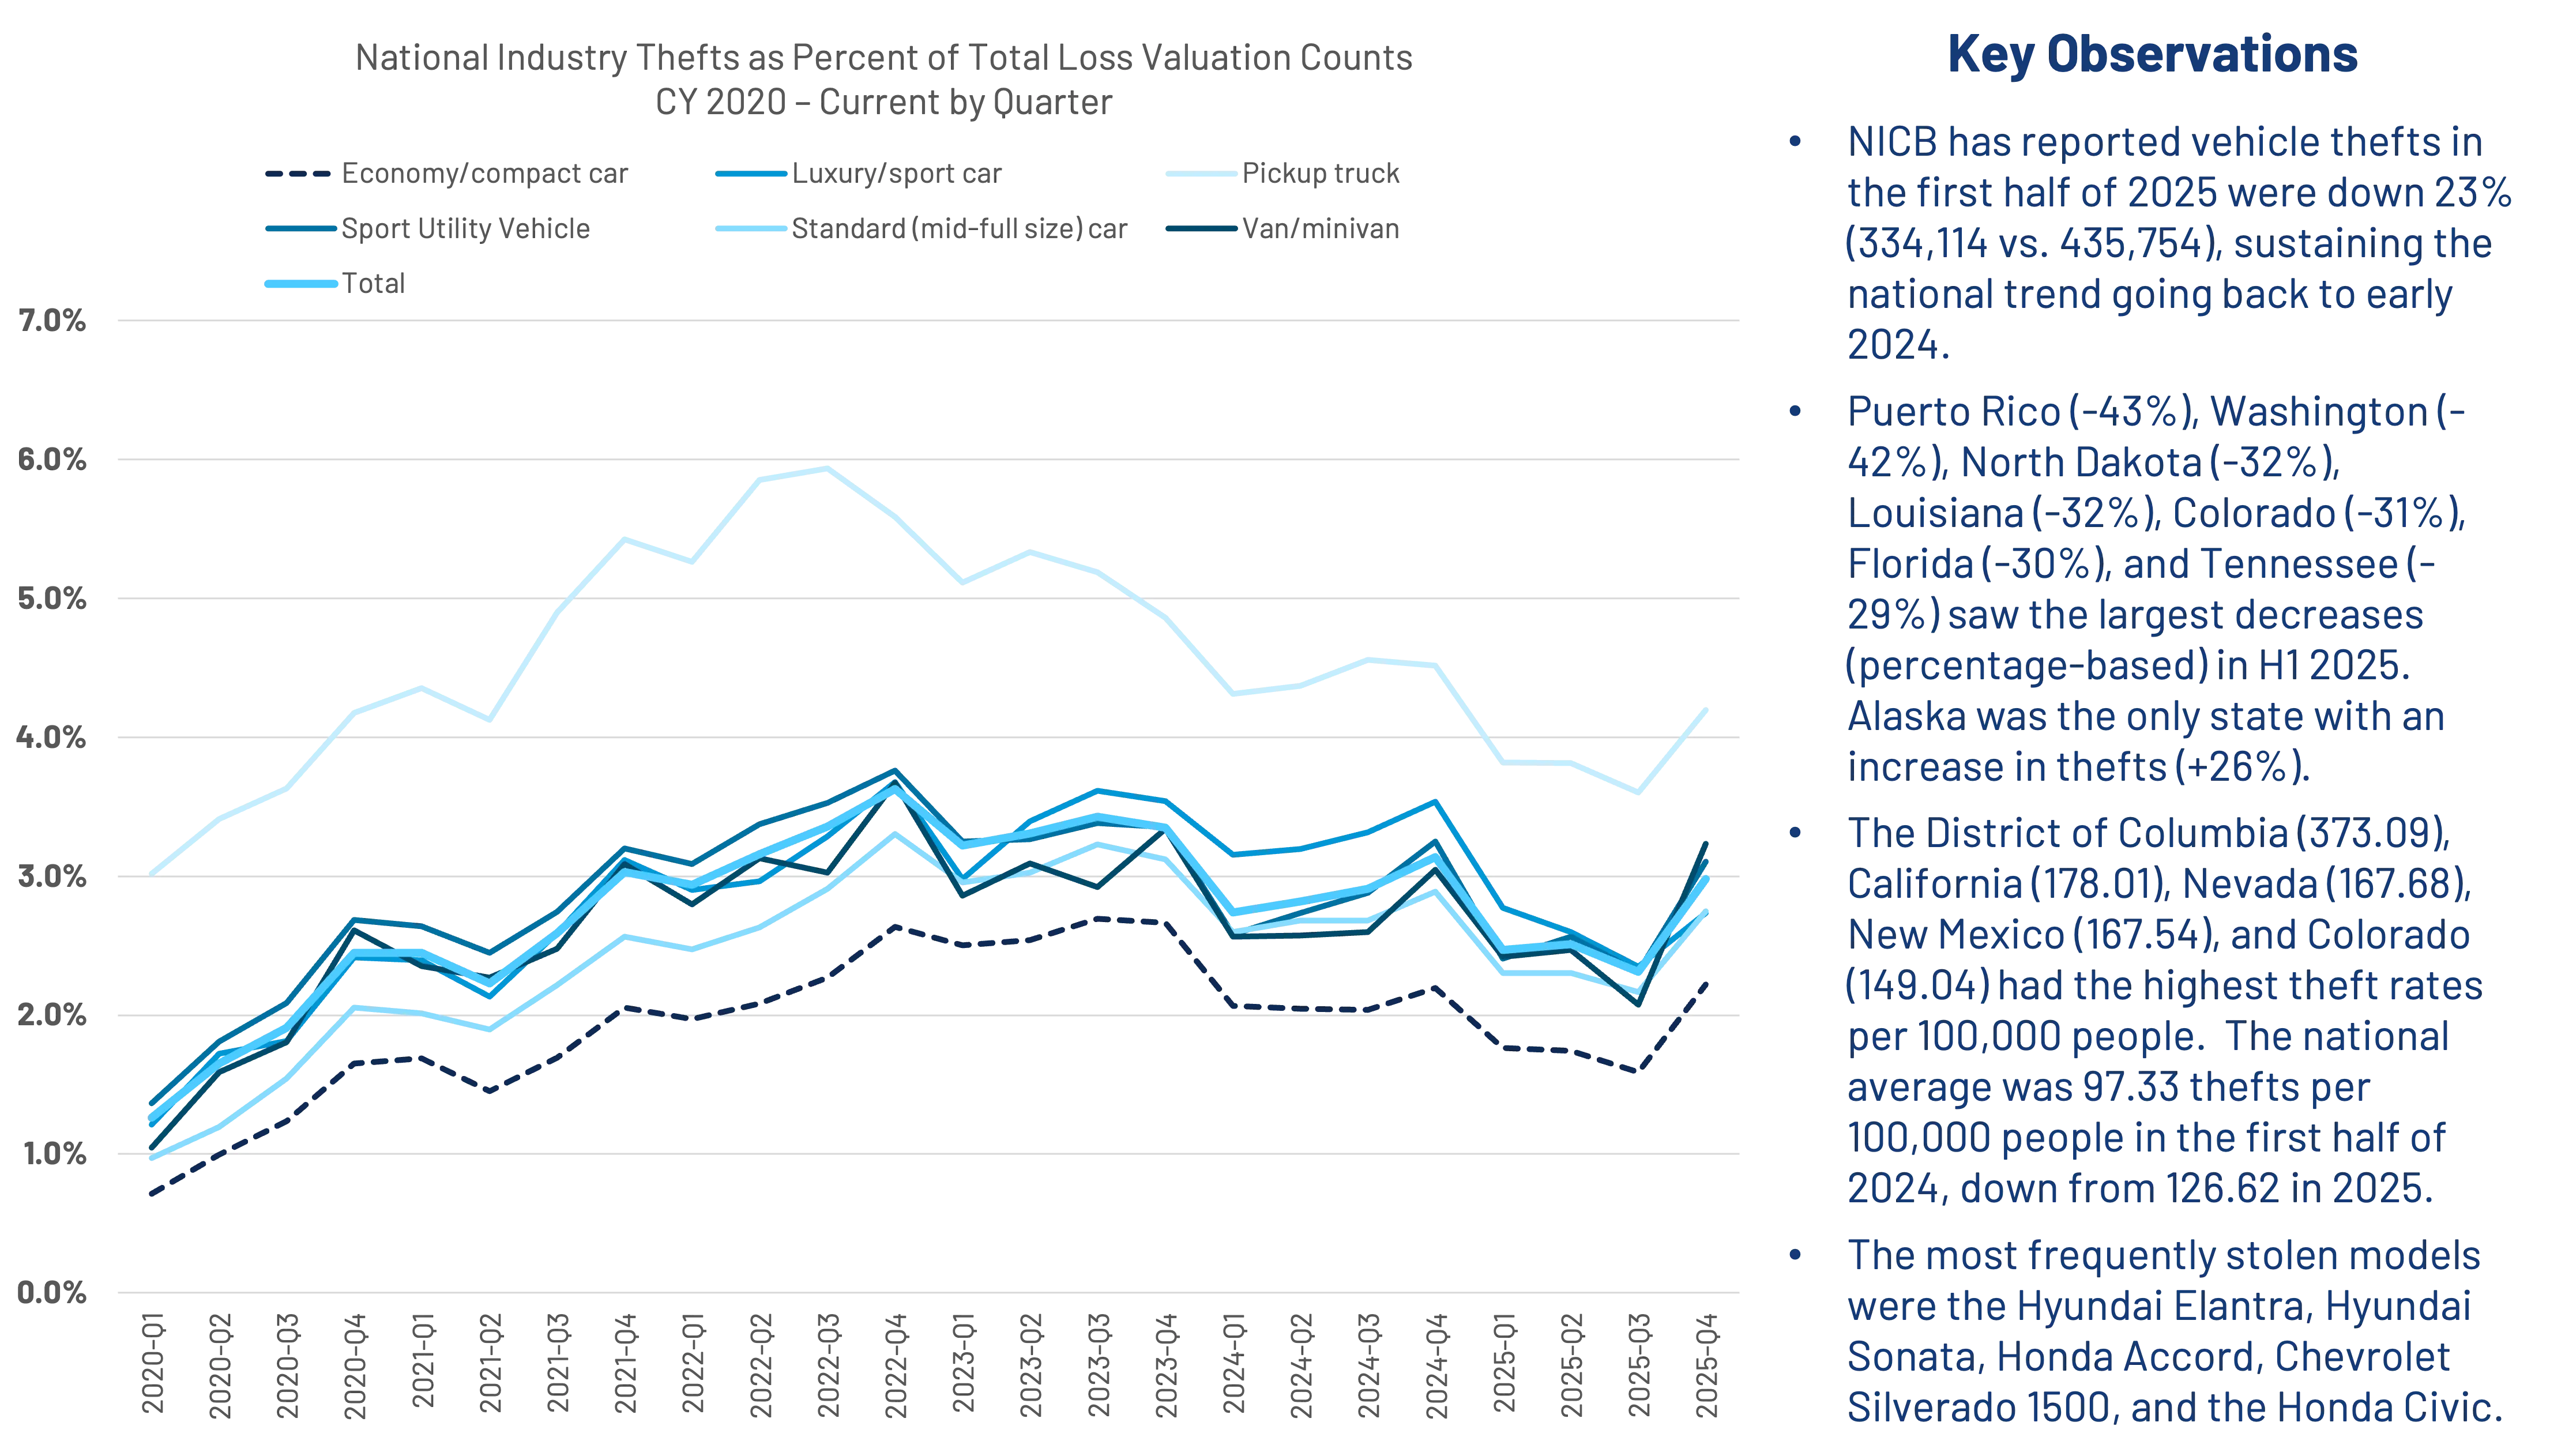
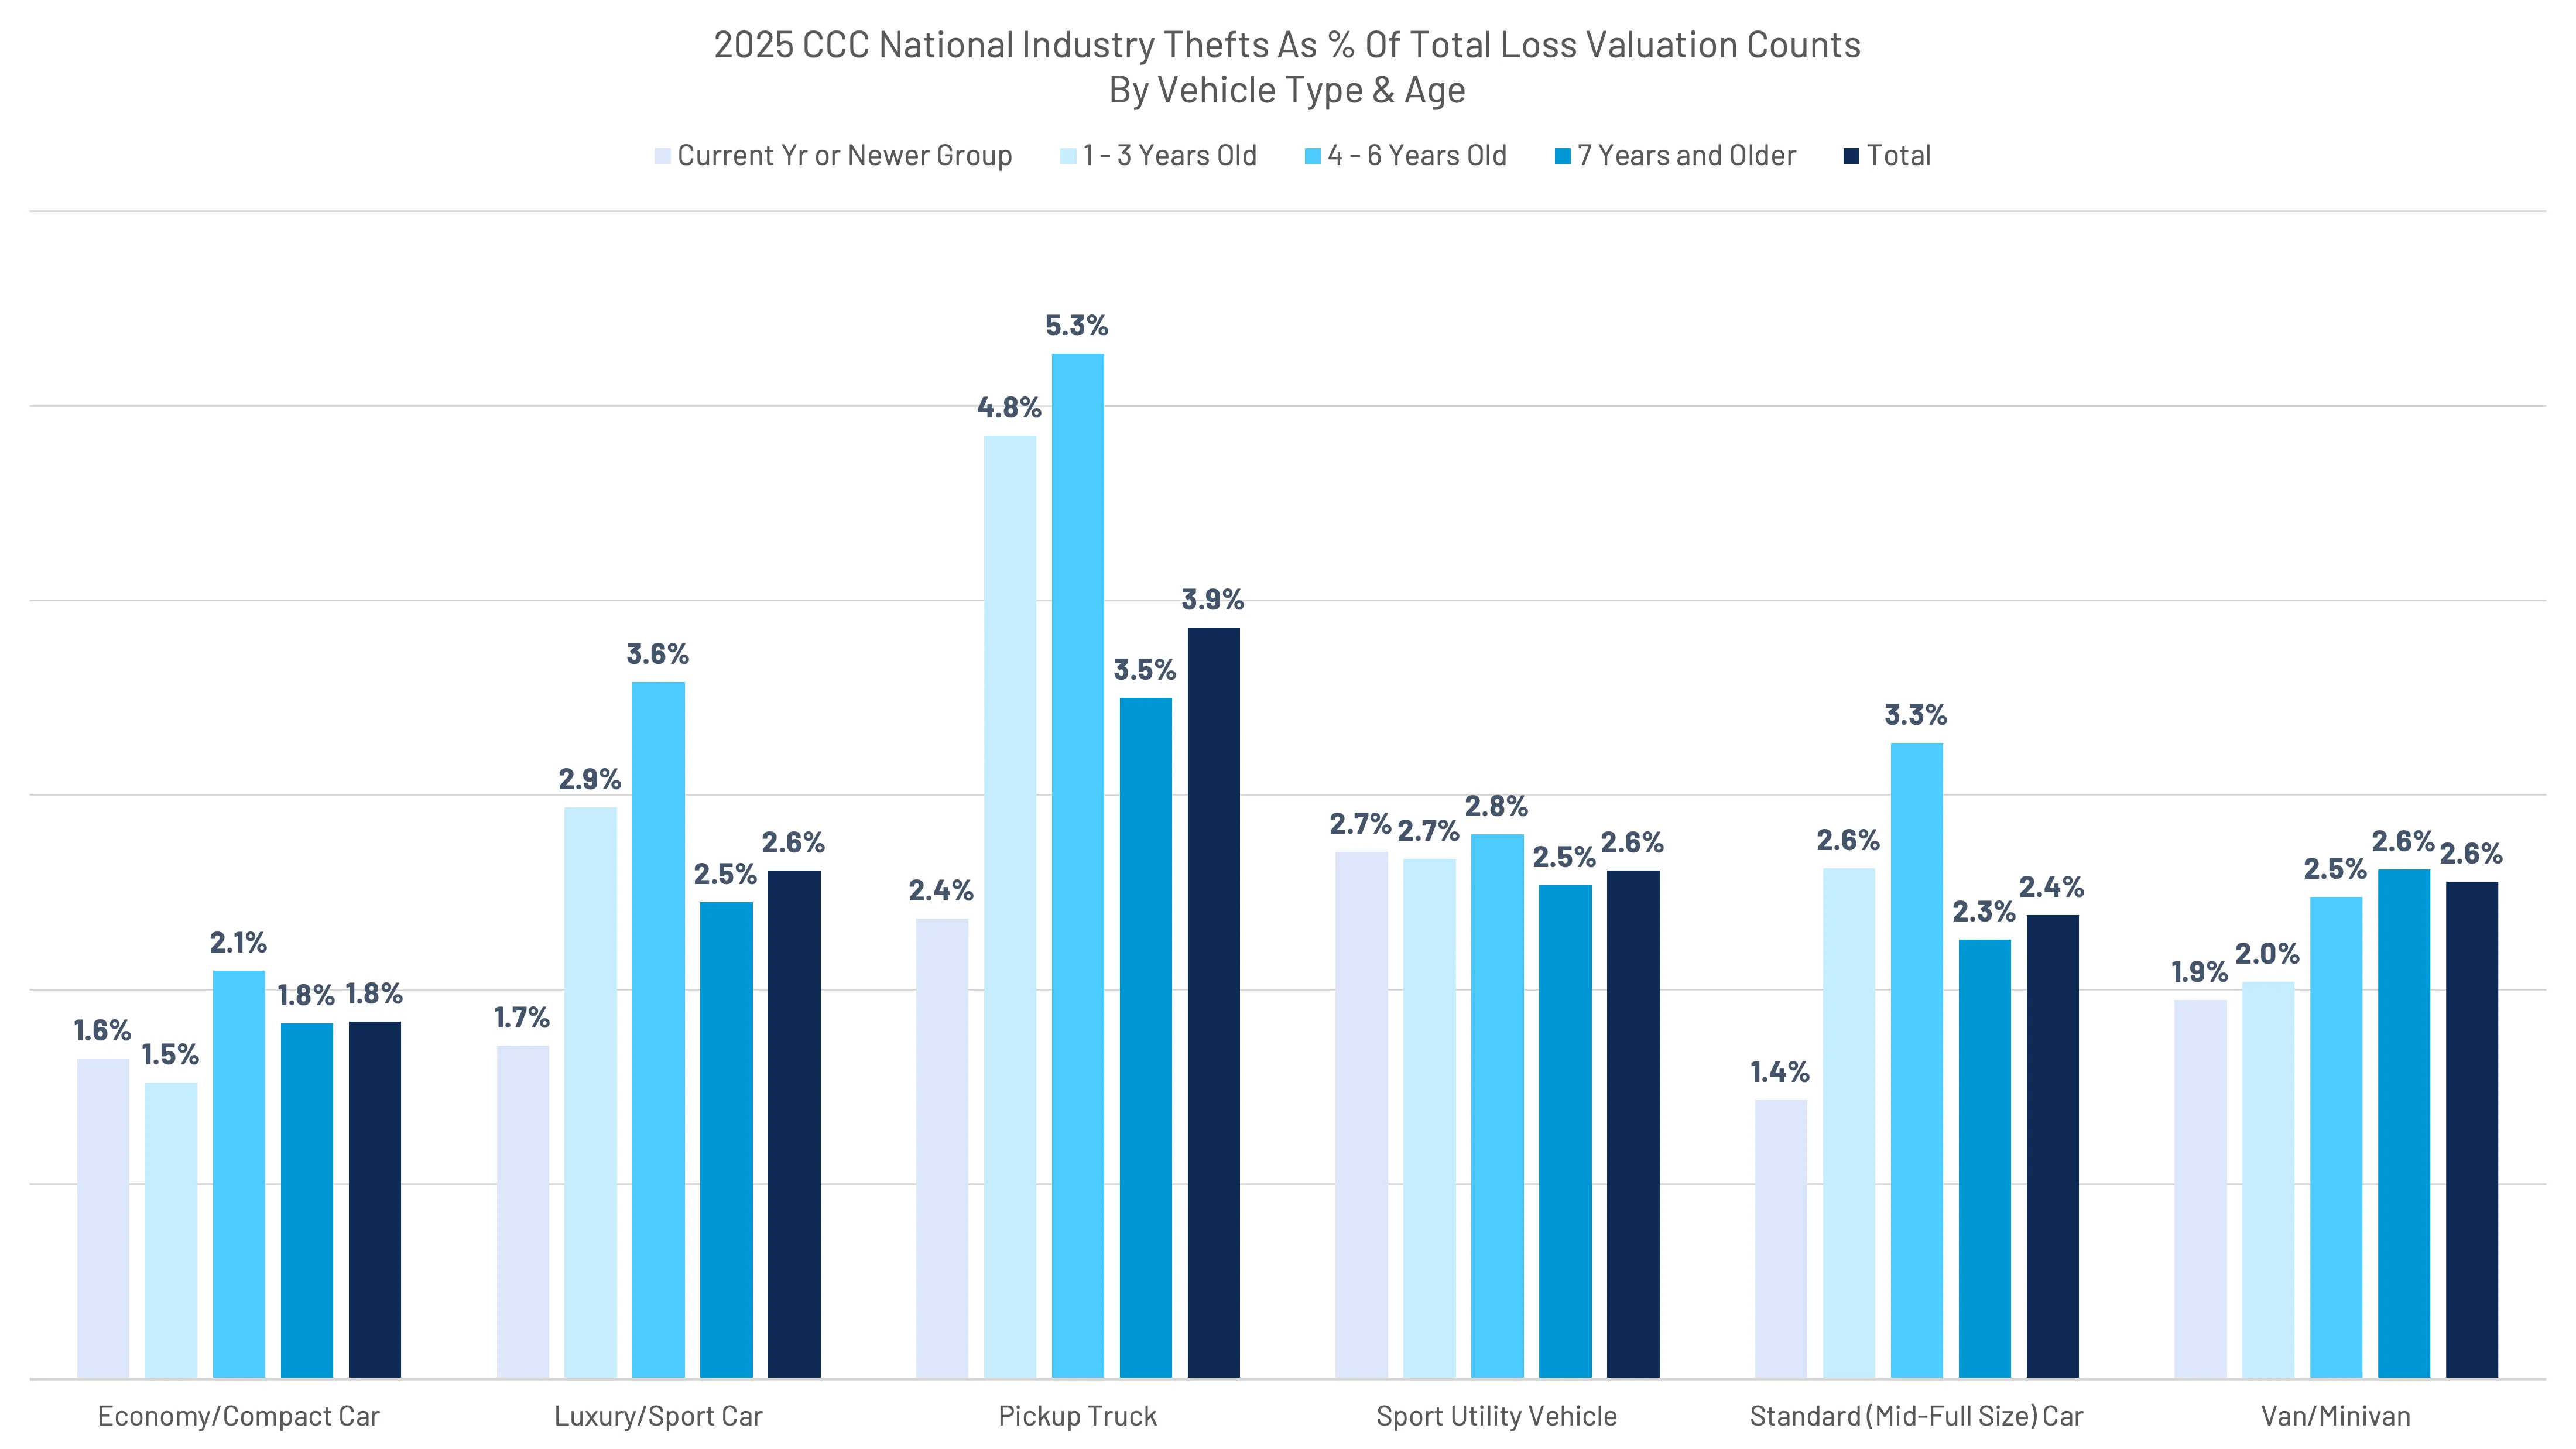
According to NICB, vehicle thefts saw a decline of 23% year-over-year through the first half of 2025. (Figure 12) With the exception of Q4, CCC has seen a general decline in the share of total losses associated with theft. (Figure 13) Relative to overall total losses by vehicle type and age, pickup trucks outpace other categories.
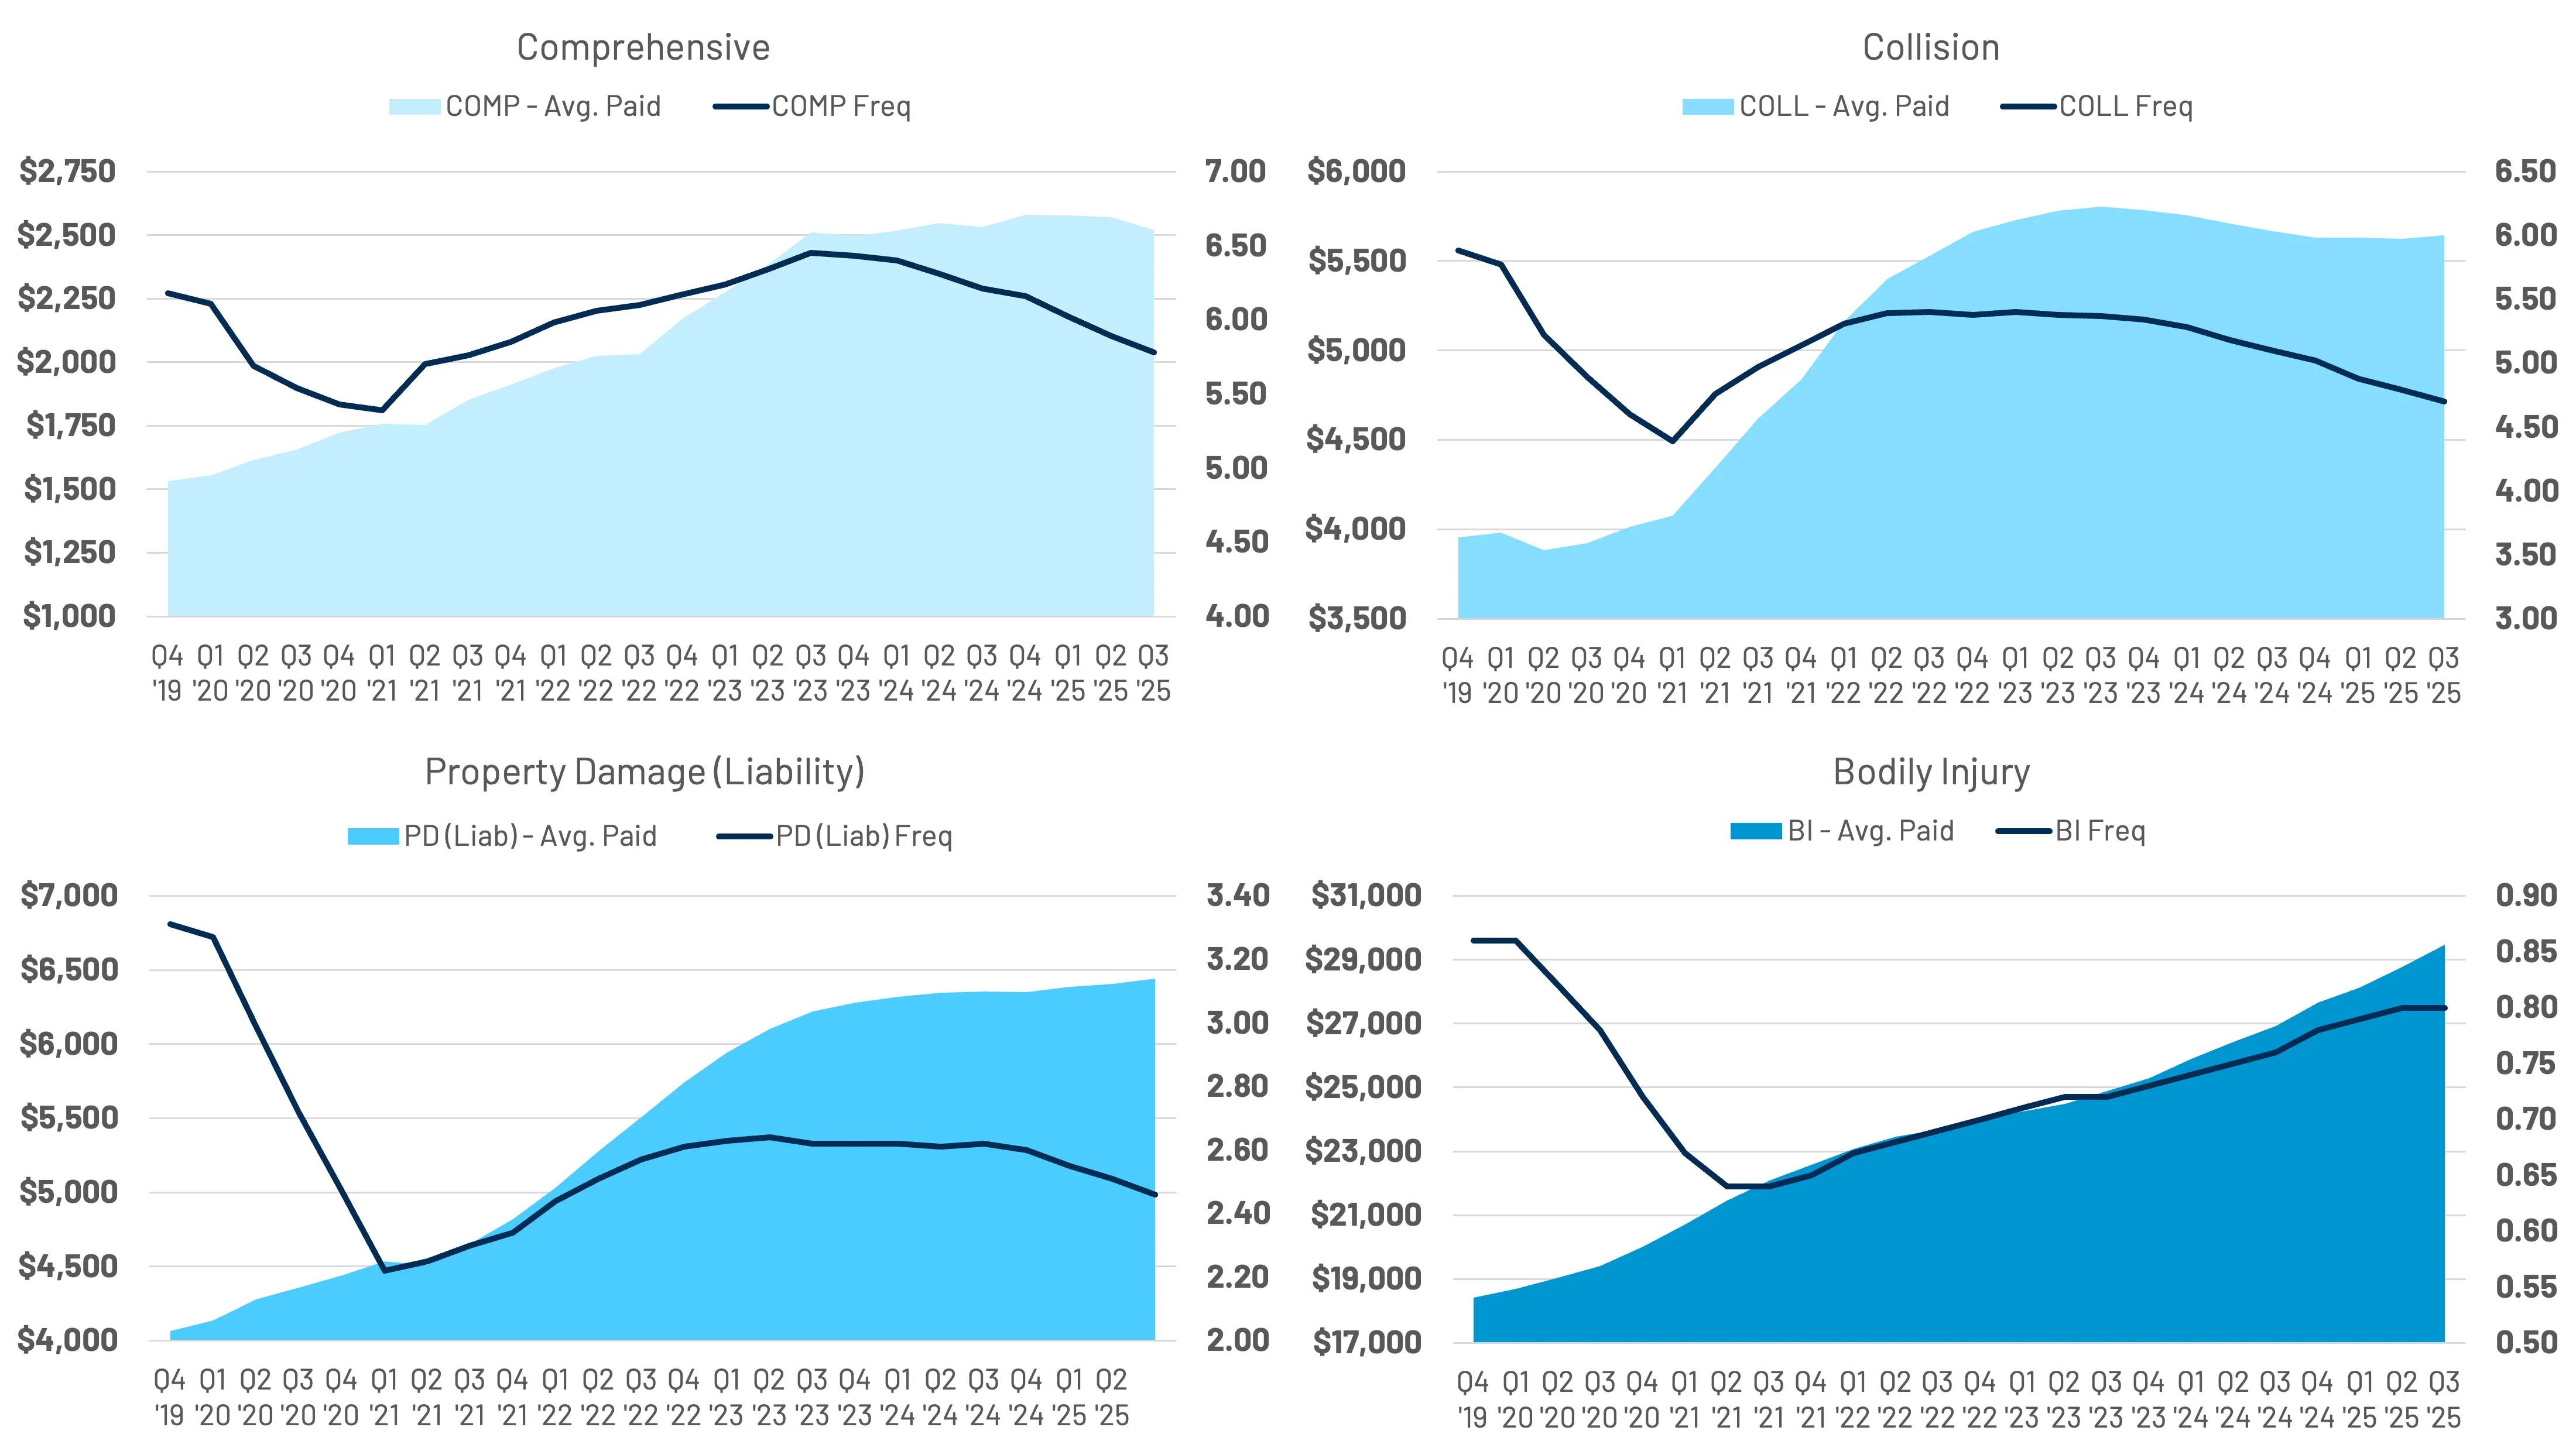
According to ISS Fast Track, all three major physical damage coverages (collision, comprehensive, and property damage/liability) have seen a continued decline in frequency - paid claim volume relative to exposure volume (vehicles in force).
Fast Track first party collision and comprehensive paid severity has eased slightly in recent quarters. It is important to note that collision and comprehensive severities include both repairable and total loss paid claims and would be net of deductibles. Fast Track property damage paid claim severity has slowly climbed after plateauing in mid-2024. Likewise, Fast Track property damage severities will include both repairable and total loss claims.
At the same time, Fast Track bodily injury (BI) claims have seen a consistent increase in both frequency and severity. The average paid BI claim has increased 10.3% over just the last year, and 32% over the last four years. (More on this in the next section) (Figure 14)
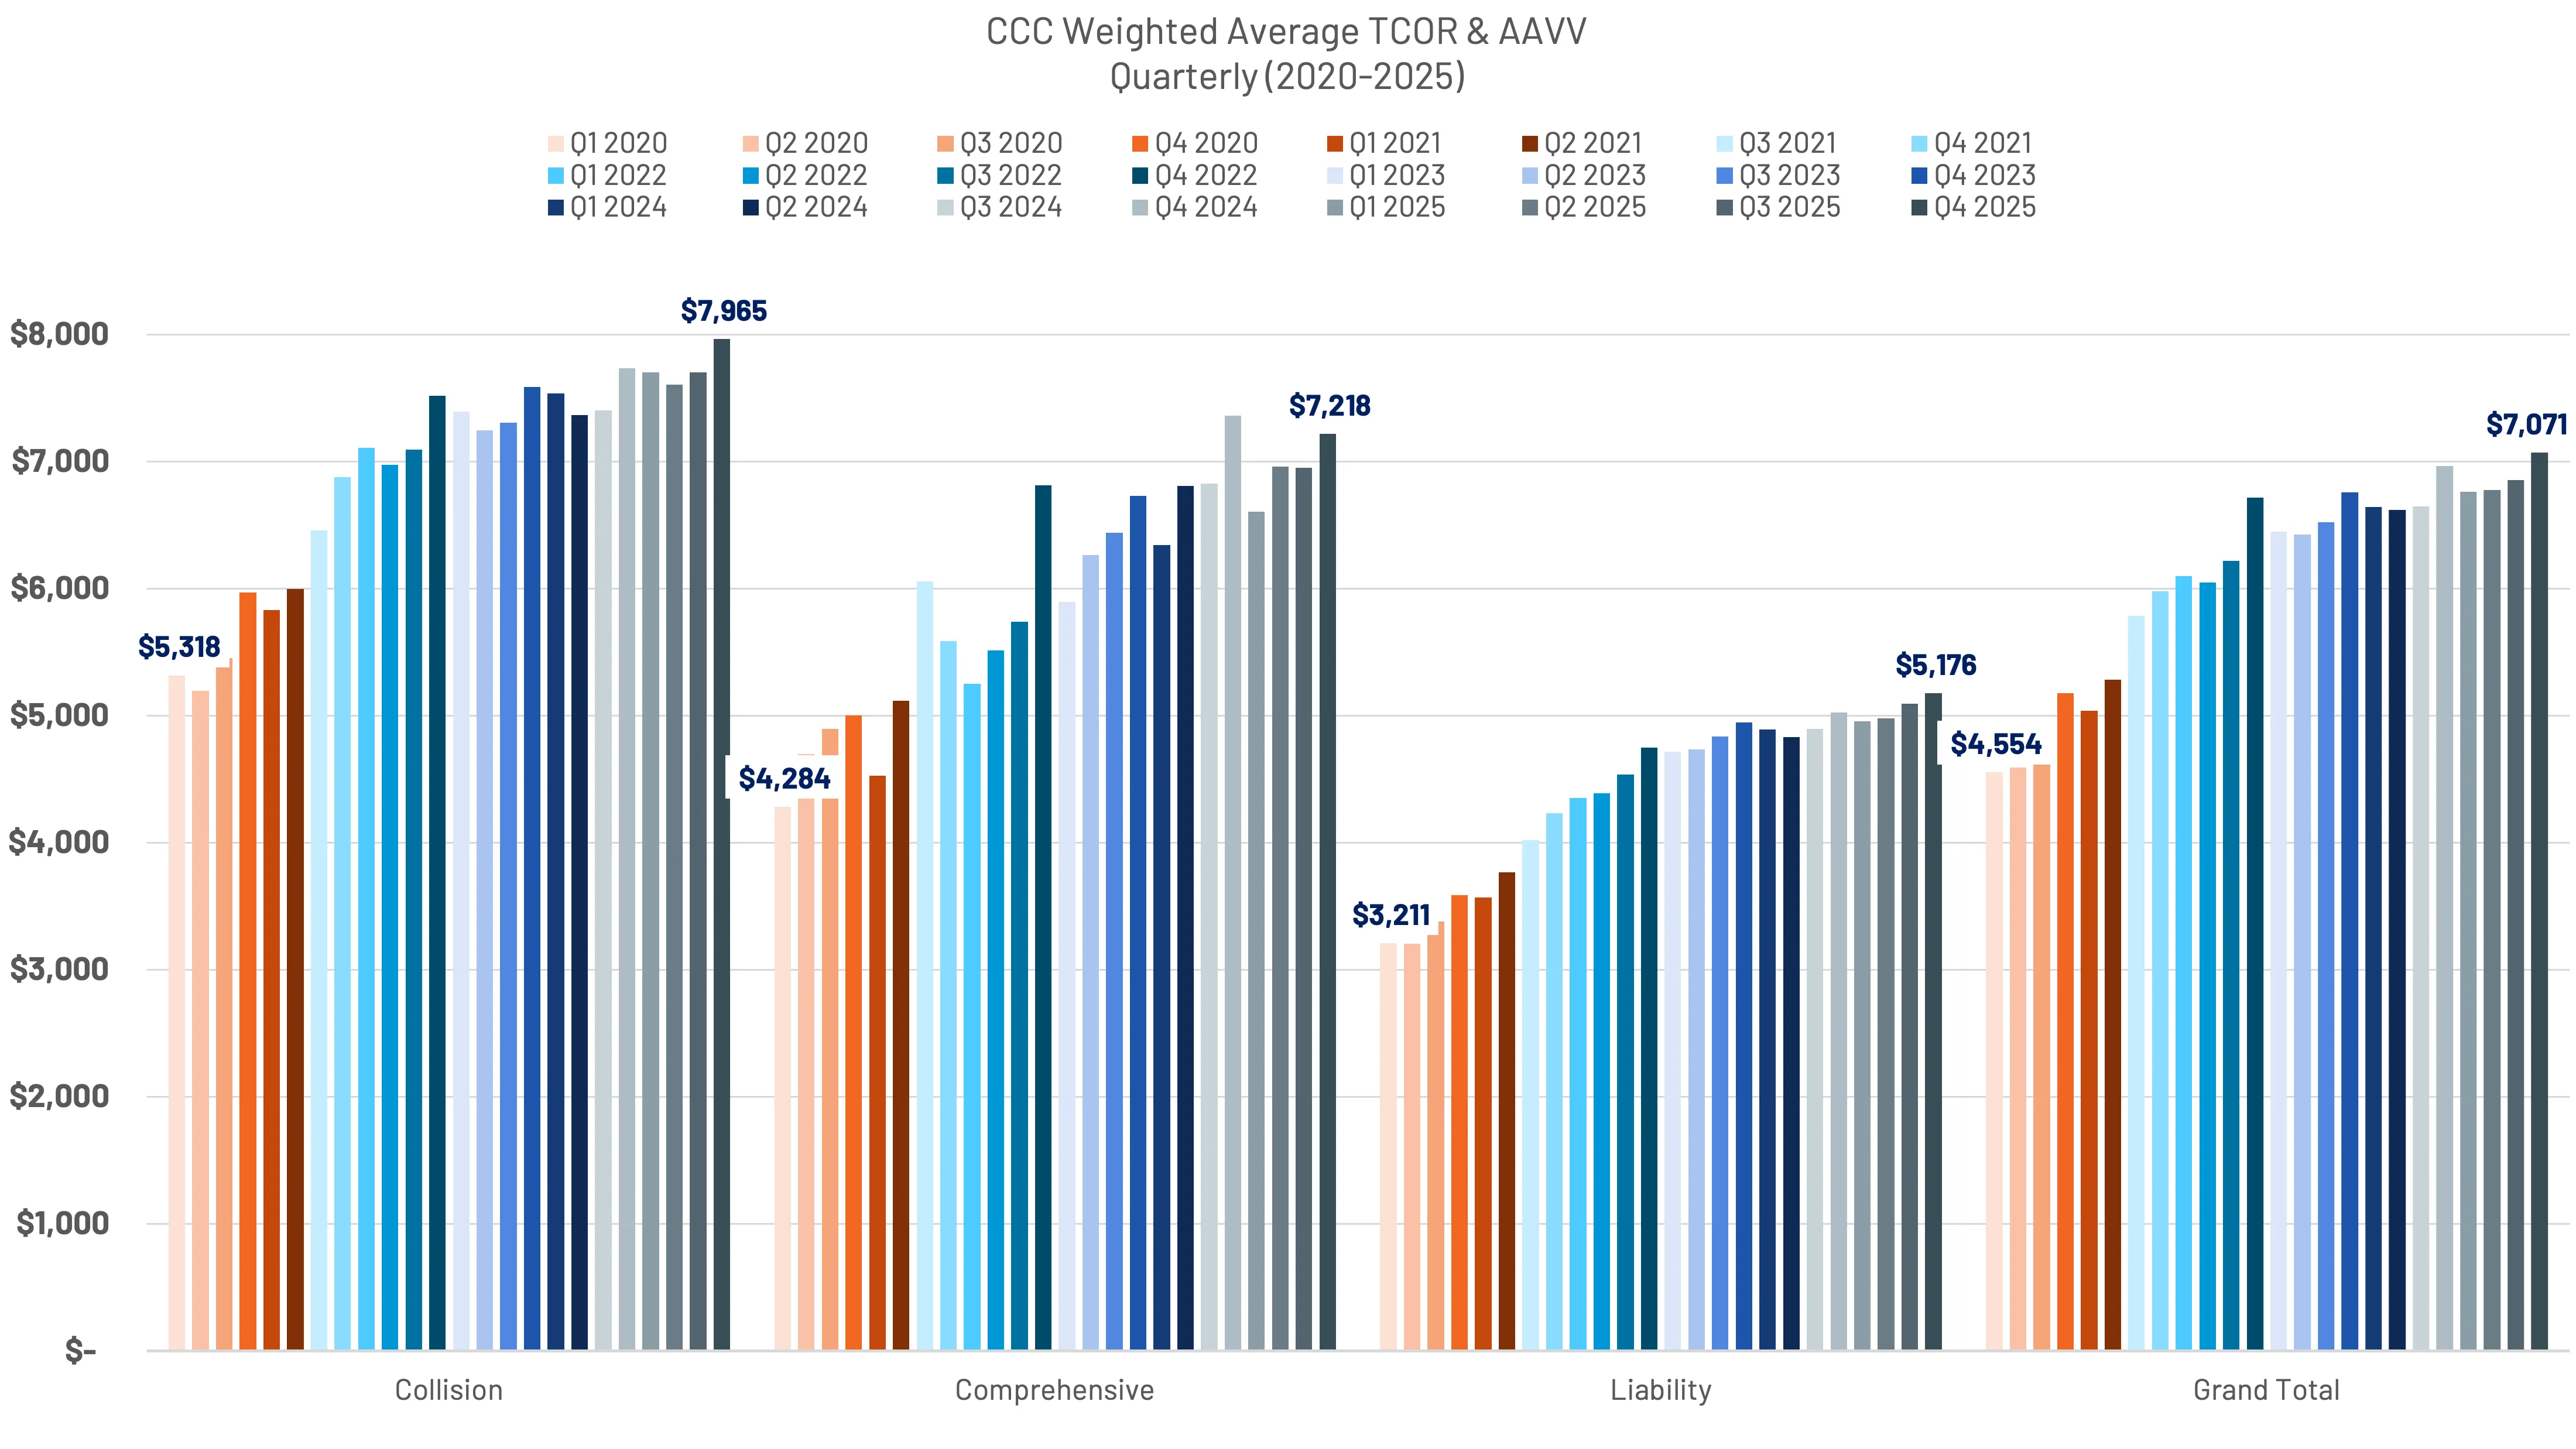
In analyzing CCC’s data using the weighted average of TCOR and AAVV, the results align with Fast Track's collision and property damage (liability) coverages, but comparisons within comprehensive coverage require additional context. Fast Track's comprehensive paid claims severity is influenced by a high volume of lower-cost glass-only claims. As a result, CCC’s comprehensive averages may differ. (Figure 15)
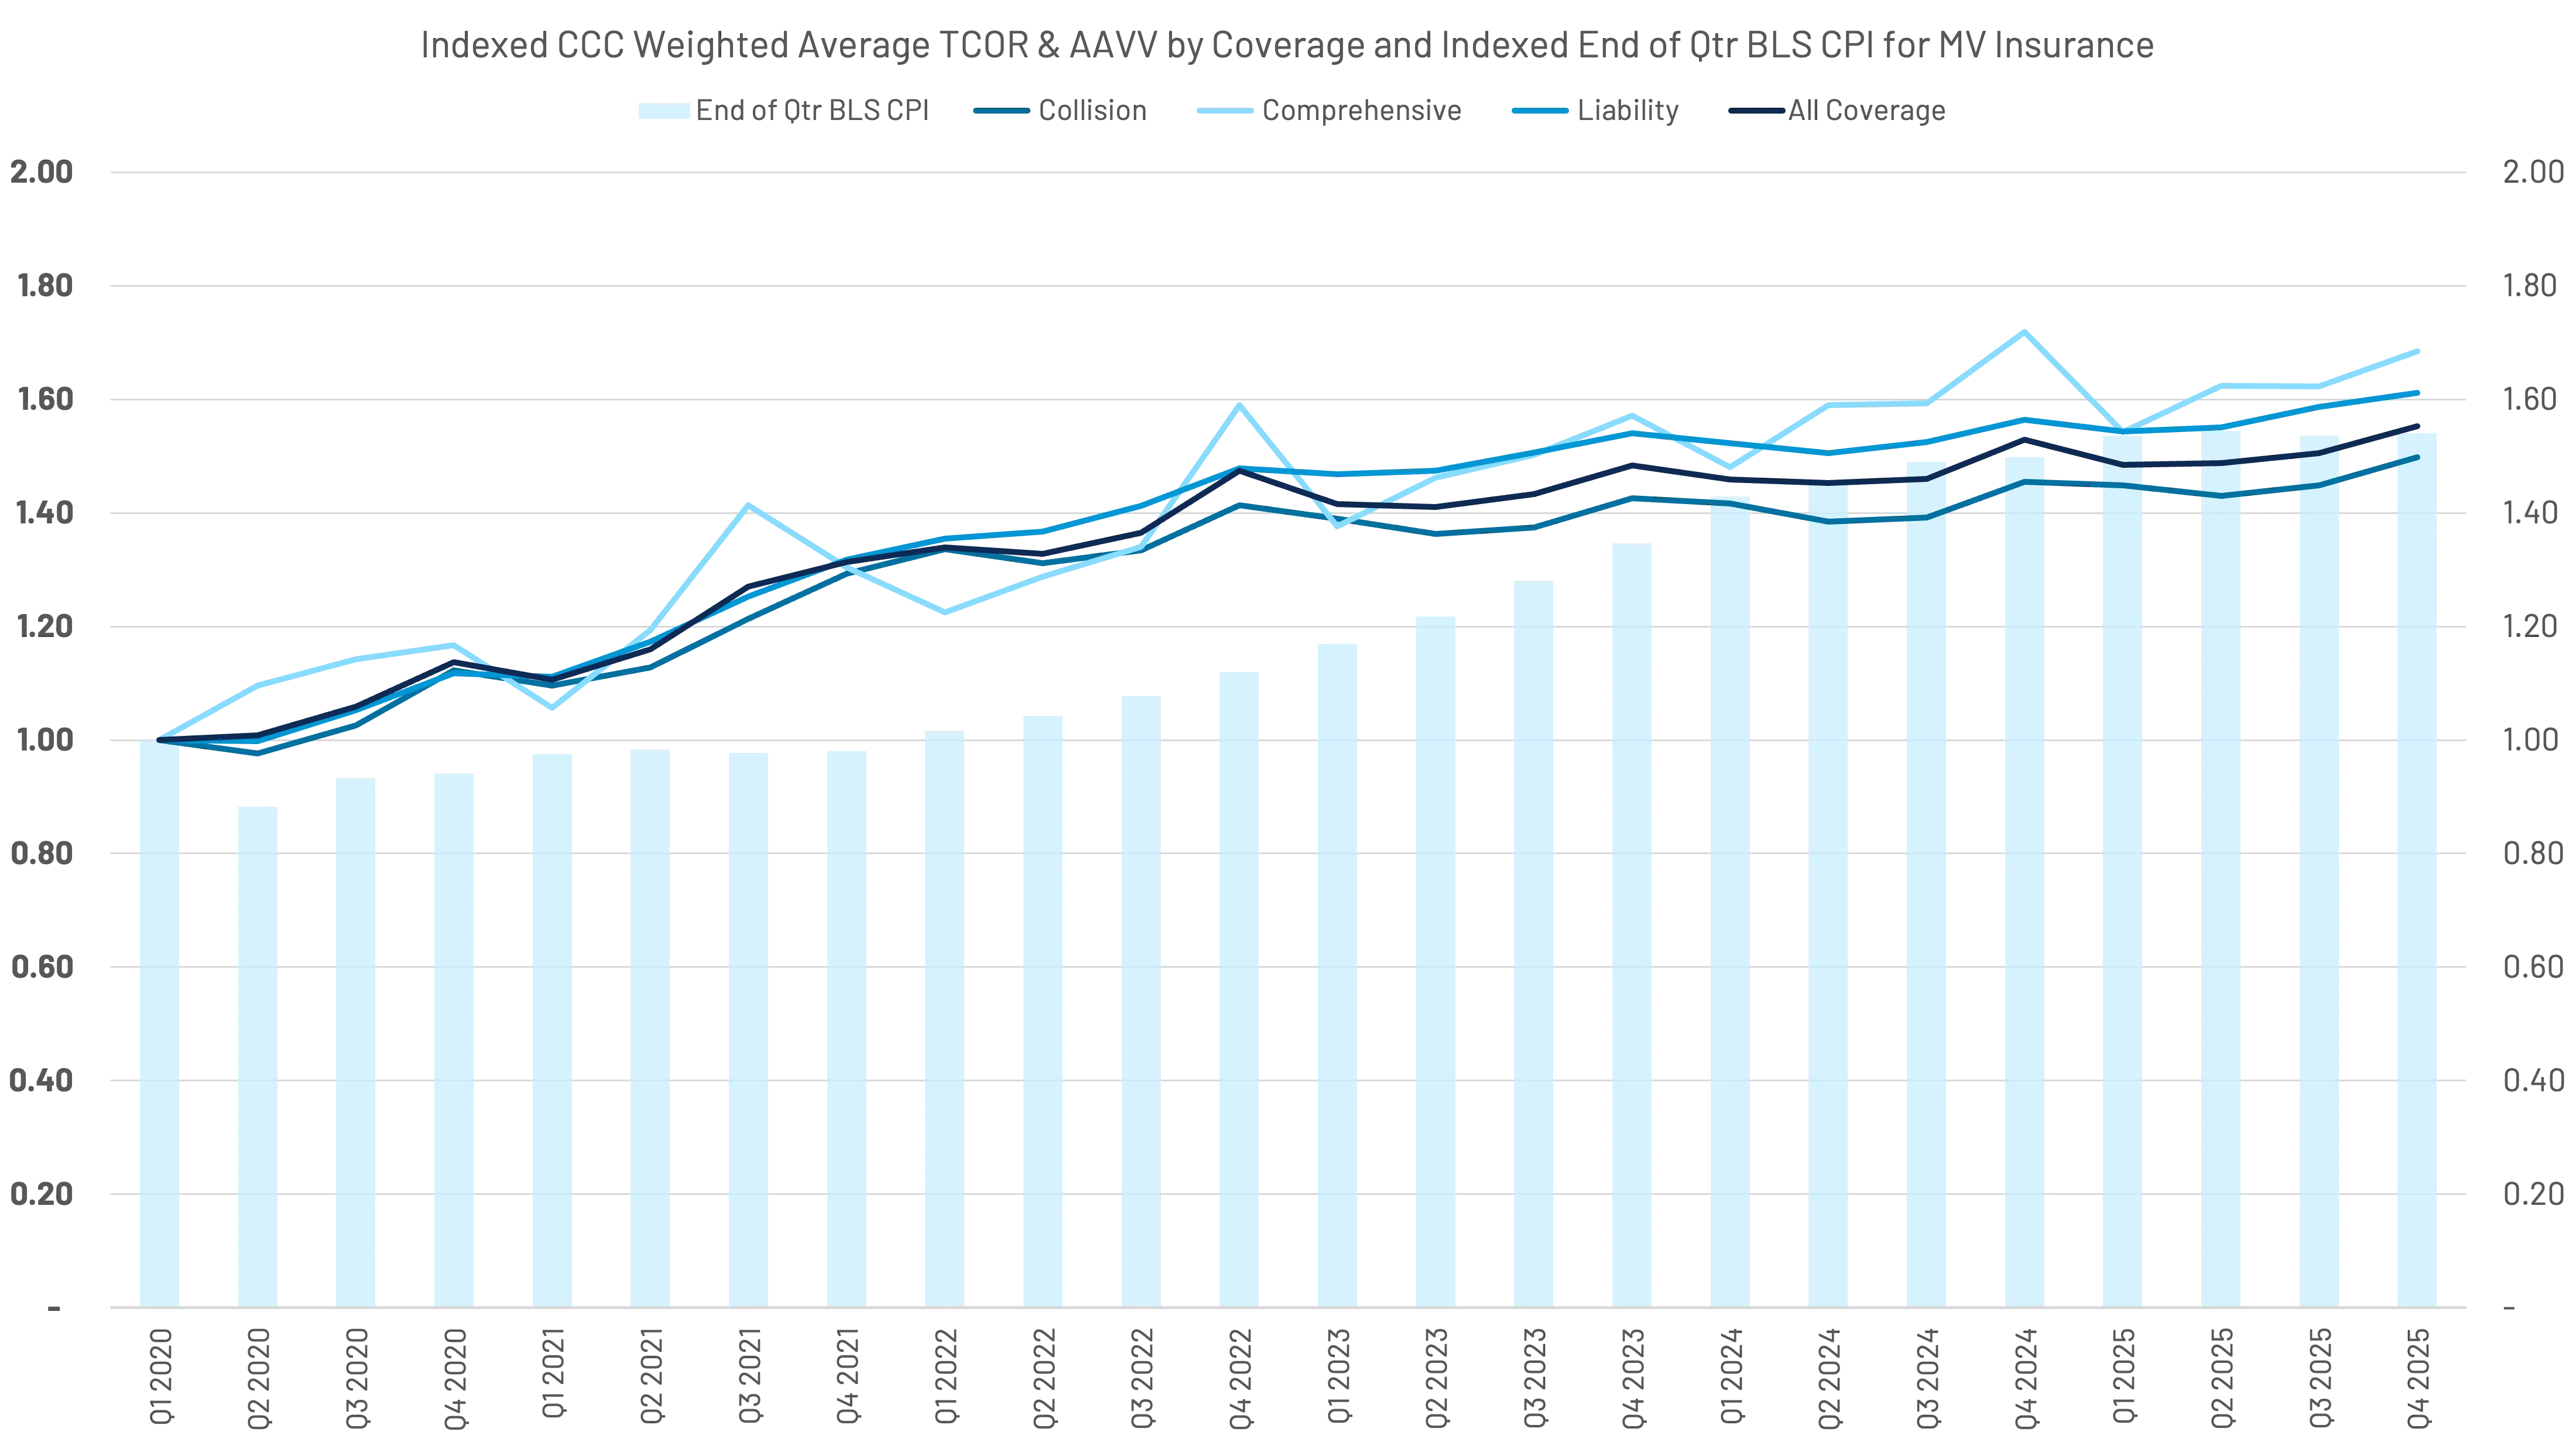
When indexed and compared to the BLS CPI for Motor Vehicle Insurance (last month of each quarter), we found that increases in the weighted average of repairable and total loss claims outpaced the CPI for motor vehicle insurance until the first quarter of 2024. Though not a perfect correlation – as frequency is not considered – this is yet another view that reflects the time and rate required on the insurance carrier side. (Figure 16)
The reduction in lower TCOR claims alters the mix, particularly within total losses.
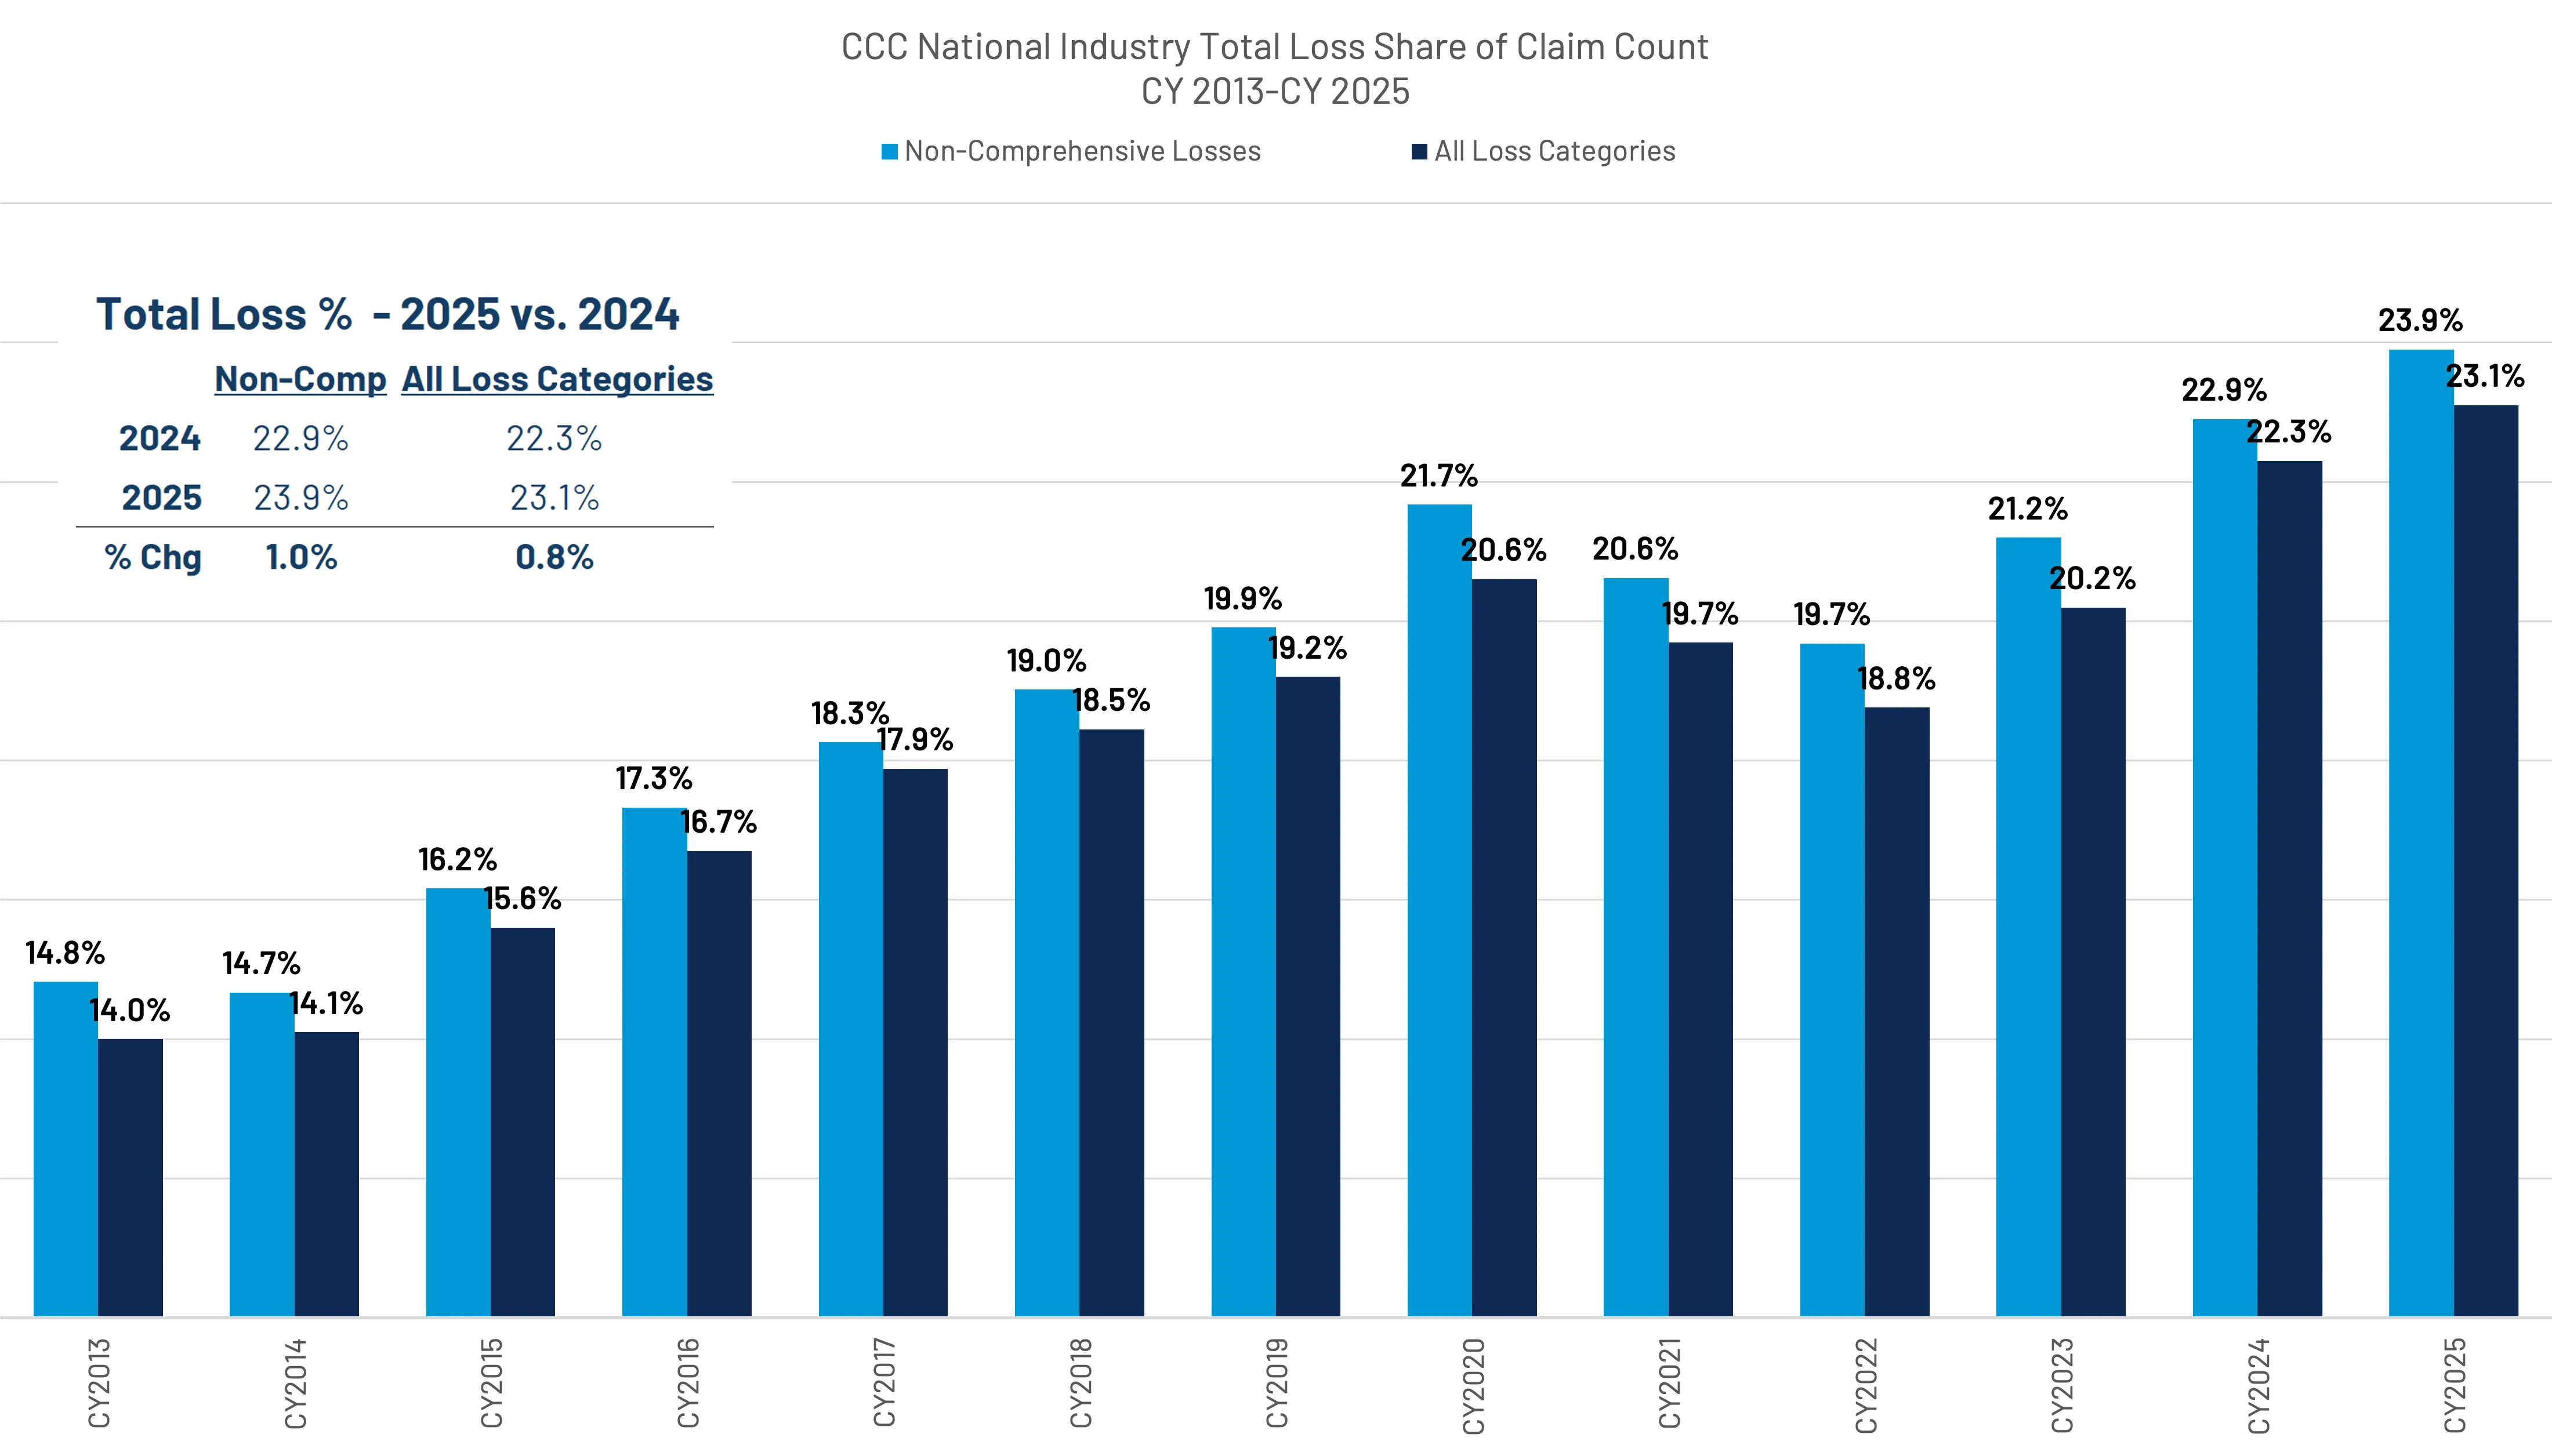
Total loss valuations decreased by 2.9%, while non-comp valuations were down only 0.2%. The share of claims flagged total loss increased by 0.8 percentage points to 23.1% across all loss categories, while non-comprehensive claims flagged total loss increased by 1.0 percentage points to 23.9%. This represents a new high watermark for the industry, while being mindful that this ratio is being affected by claim filing behaviors (notably lower-severity 1st party APD claims). (Figure 17)
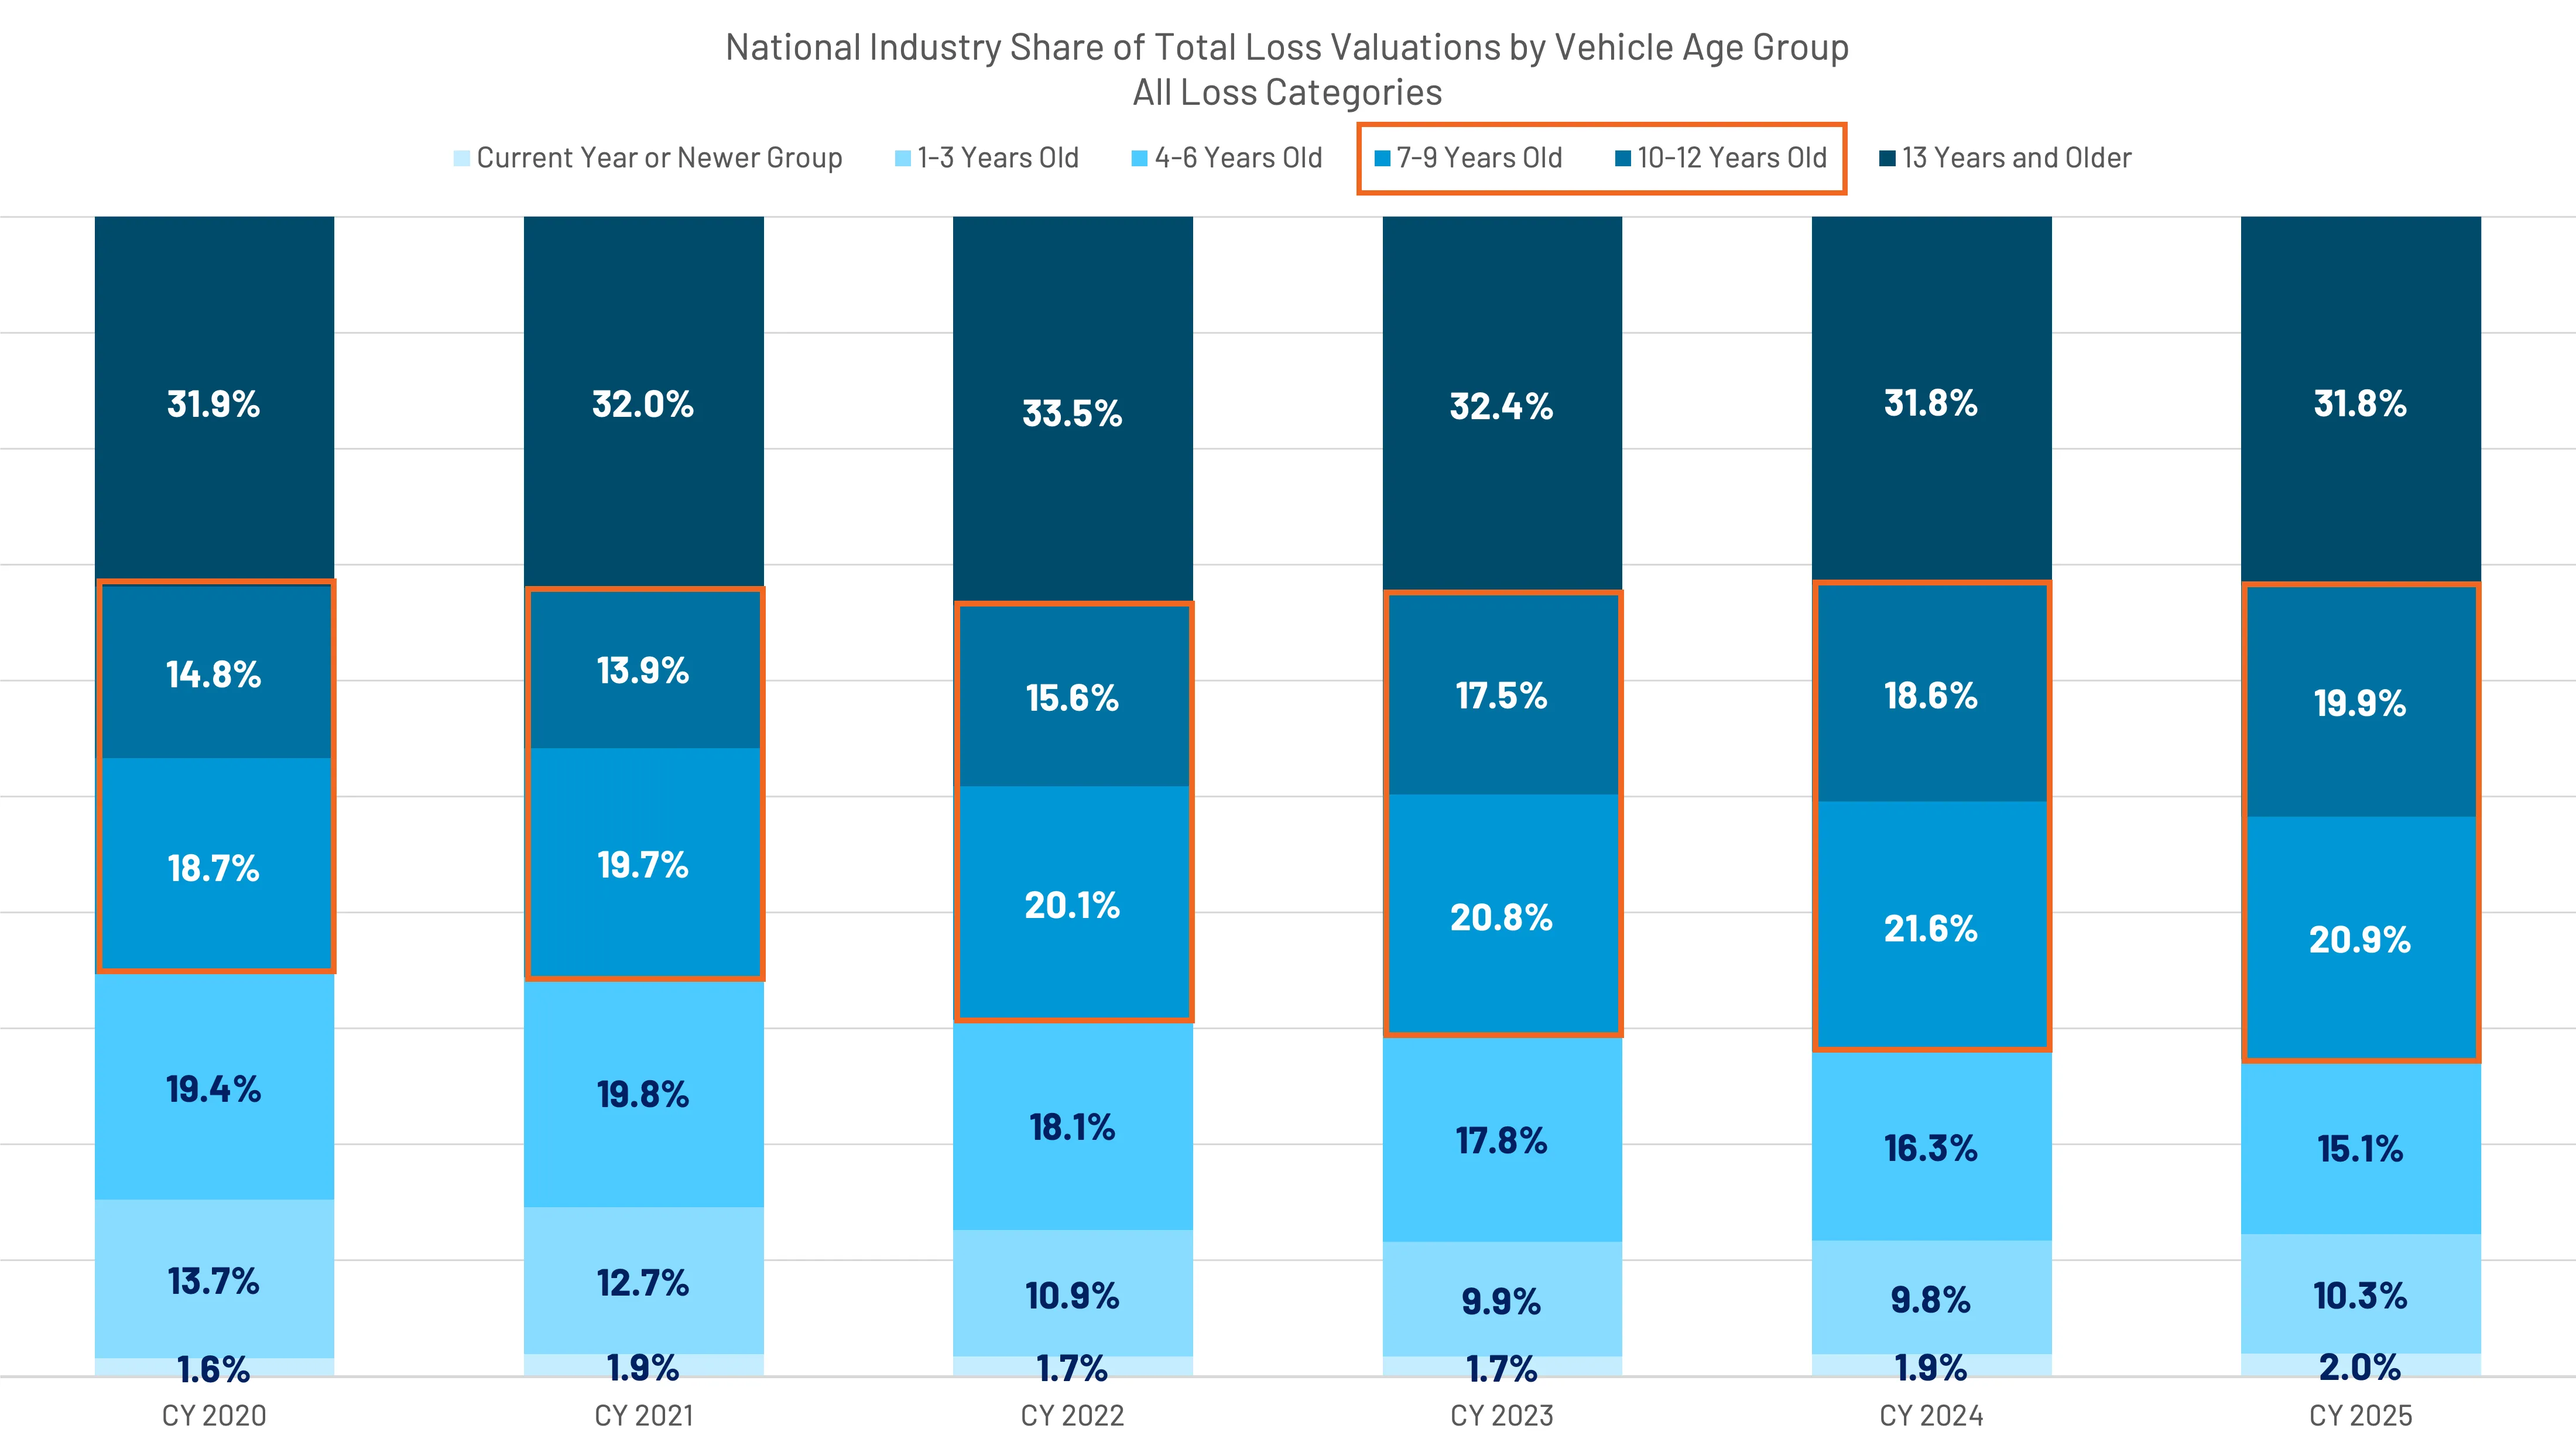
The mix of total loss valuations continues to reflect shifts in the vehicle fleet and insurance coverage decisions. The mix of vehicles 7- to 12-years-old has increased to represent almost 41% amongst valuations in 2025 (up from 33.4% in 2020), while the share of valuations for vehicles 1- to 6-years-old has declined by 7.7% to 25.4% in 2025.
Though it might be too early to consider this a trend, it is noteworthy to mention that the share of vehicles 1- to 3-years-old increased in 2025; vehicles current year or newer saw increased share in both 2024 and 2025 – a result of the gradual increase in new vehicle sales over the past few years.
Historically, CCC reported on vehicle age based on four primary buckets:
- Current year or newer
- 1-3 years old
- 4-6 years old
- 7 years or older
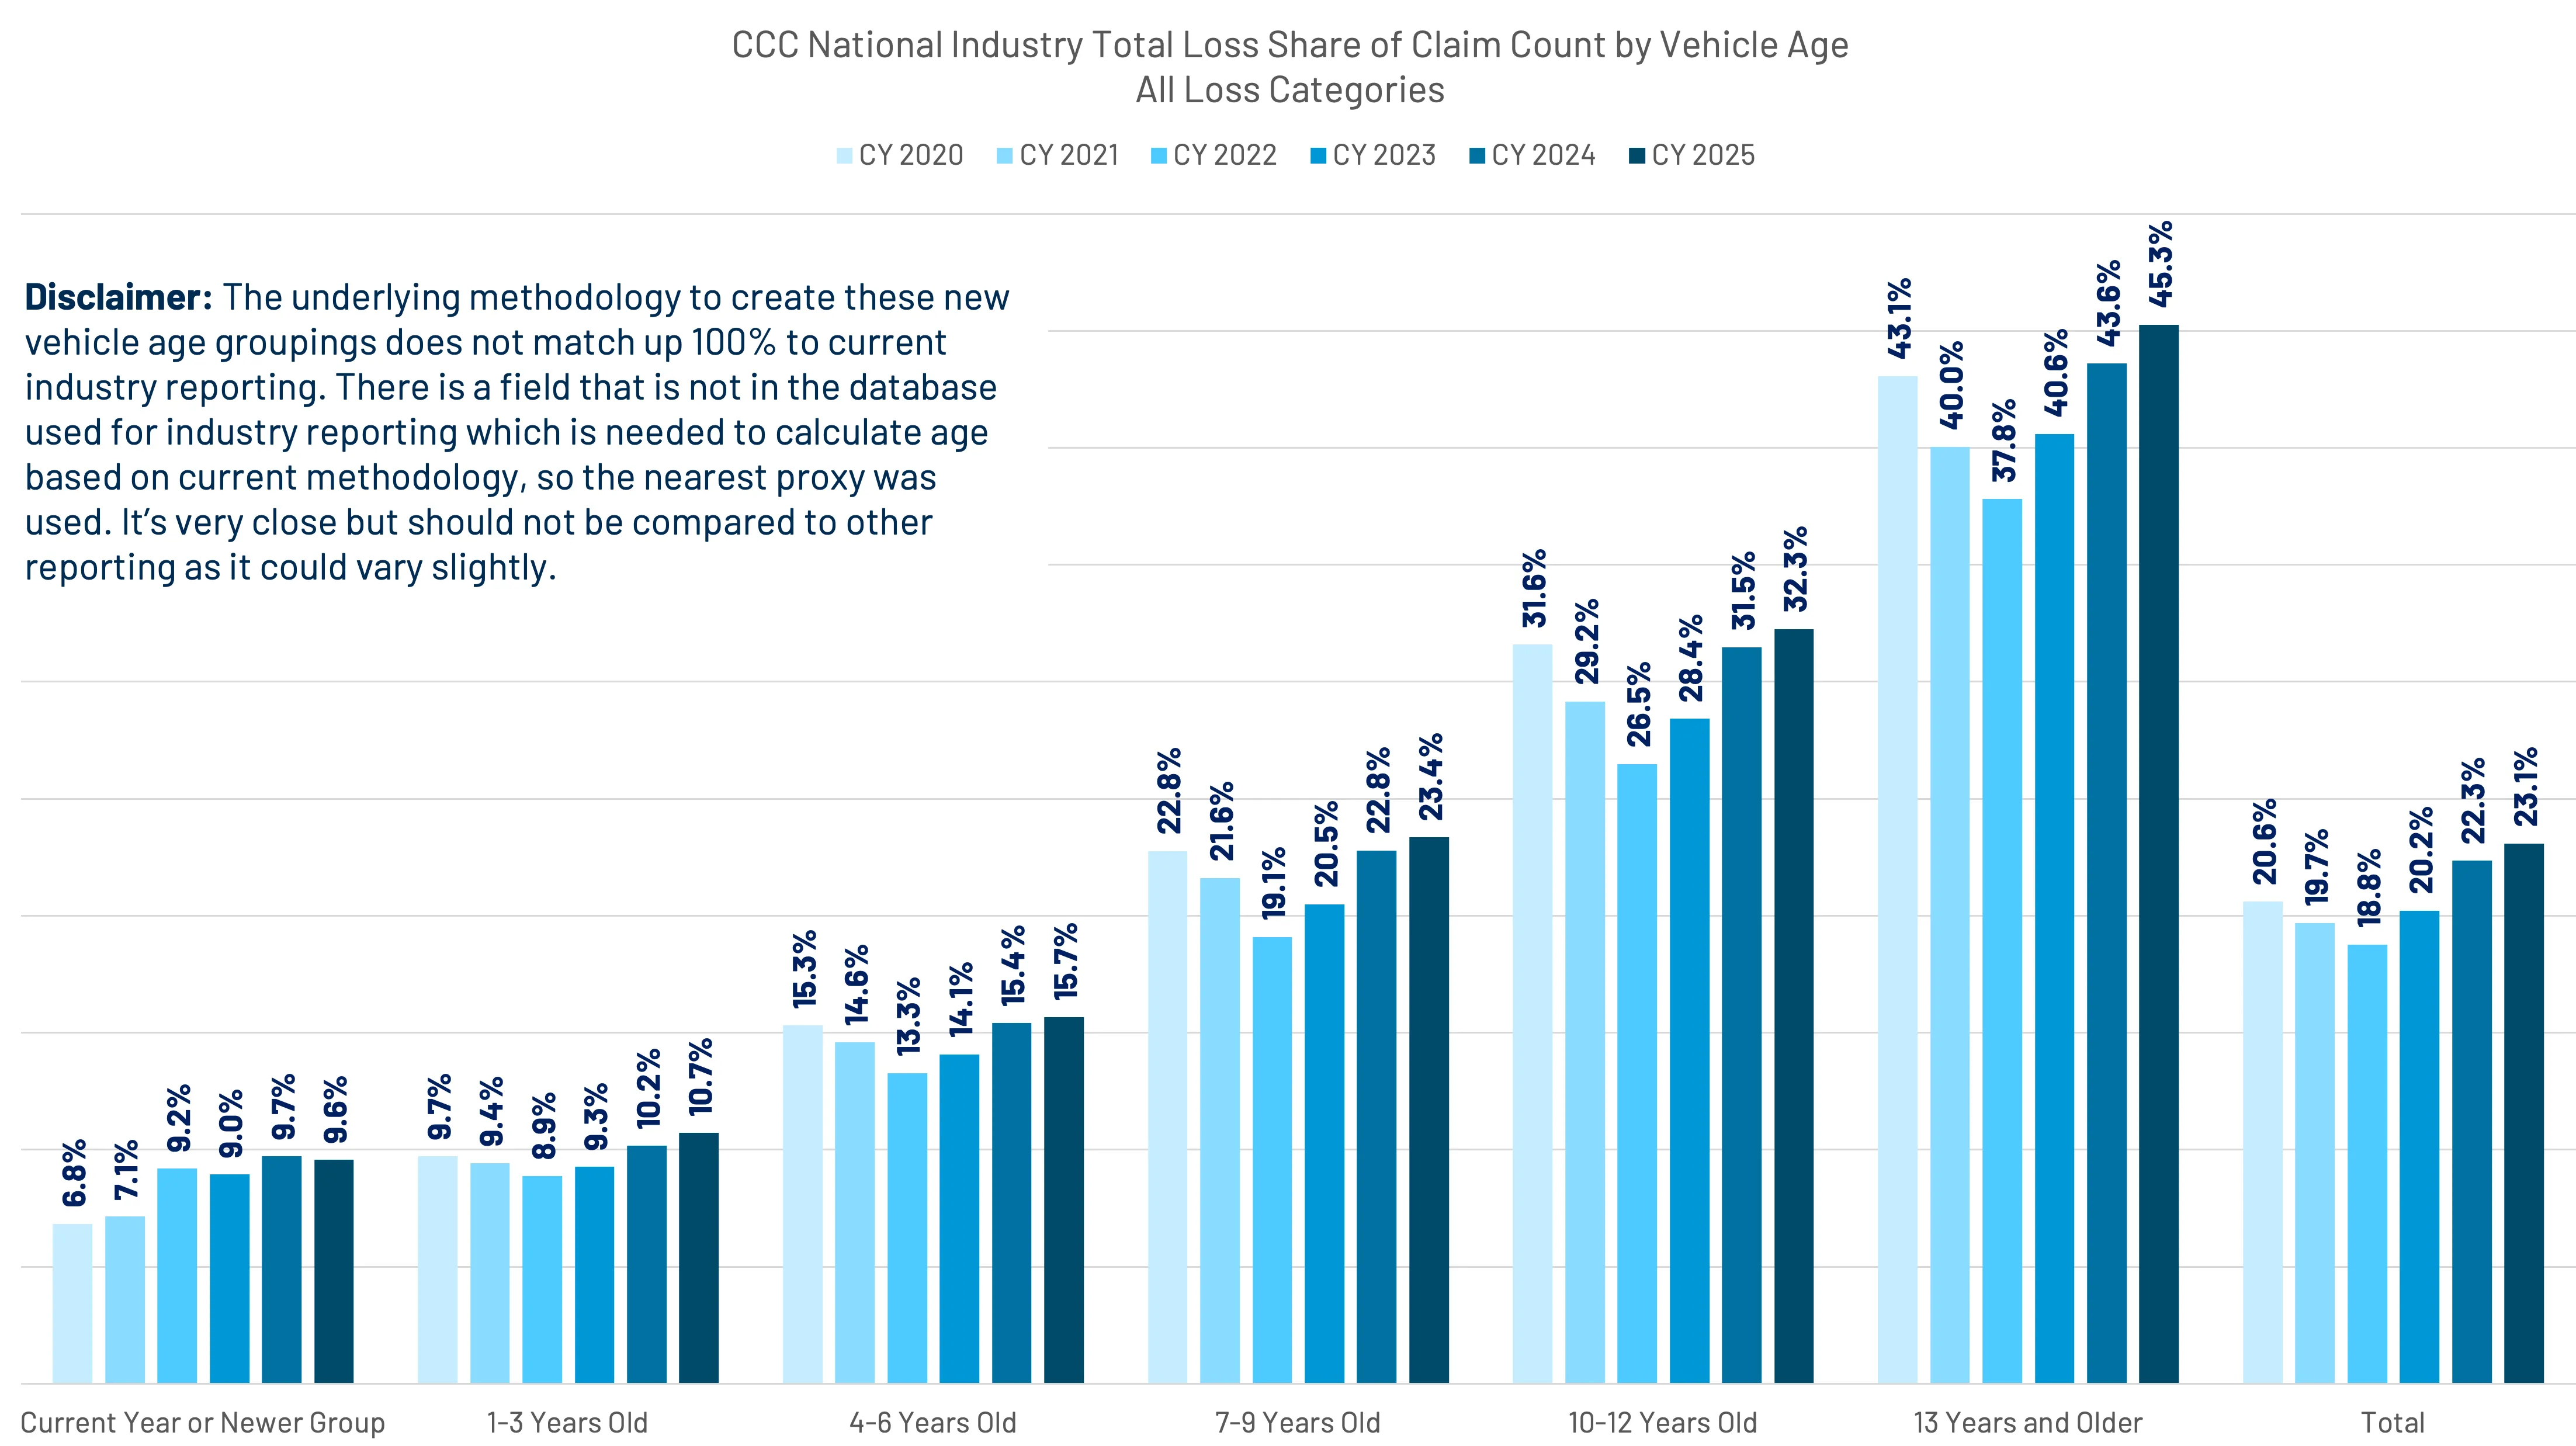
Because the share of vehicles aged 7 years and older makes up ~70% of the total loss valuation mix, we further segmented the data to provide richer insights around industry trends. (Figure 18)
As vehicles (on claims) get older, the probability of a total loss increases. For claims that are three years old or newer, 1 in 10 are flagged as a total loss by the insurer, with current year or newer vehicles seeing a noticeable, albeit slight increase over the past few years.
Vehicles aged 4- to 6-years-old have a 5 percentage point higher share of total losses than vehicles aged 1- to 3-years-old; vehicles aged 7- to 9-years-old have an almost 8 percentage point higher share of total losses than vehicles aged 4- to 6-years-old; vehicles aged 10- to 12-years-old, an almost 9 percentage point larger share compared to vehicles aged 7- to 9-years-old; and, vehicles aged 13 years or older saw a 13 percentage point increase over vehicles aged 10- to 12-years-old (at 45.3%). (Figure 19)
Thru December Comparison
Something that might be overlooked is the increase in driveable total losses, or "rolling totals." Driveable vehicle claims flagged as a total loss have seen a steady increase since 2021, bucking the industry trend by increasing slightly in 2022, as opposed to decreasing like the share of overall total losses did.
The share of driveable vehicles flagged as total losses has continued to increase at a rate higher than the overall share of driveable claims. Driveable claims are +3.5 percentage points compared to 2021, while driveable total losses are +4.2% since 2021. Similar to the overall share of total loss claims, vehicles 7- to 12-years-old have increased in their share of driveable total losses by 6.1% since 2020. (Figures 20 and 21)
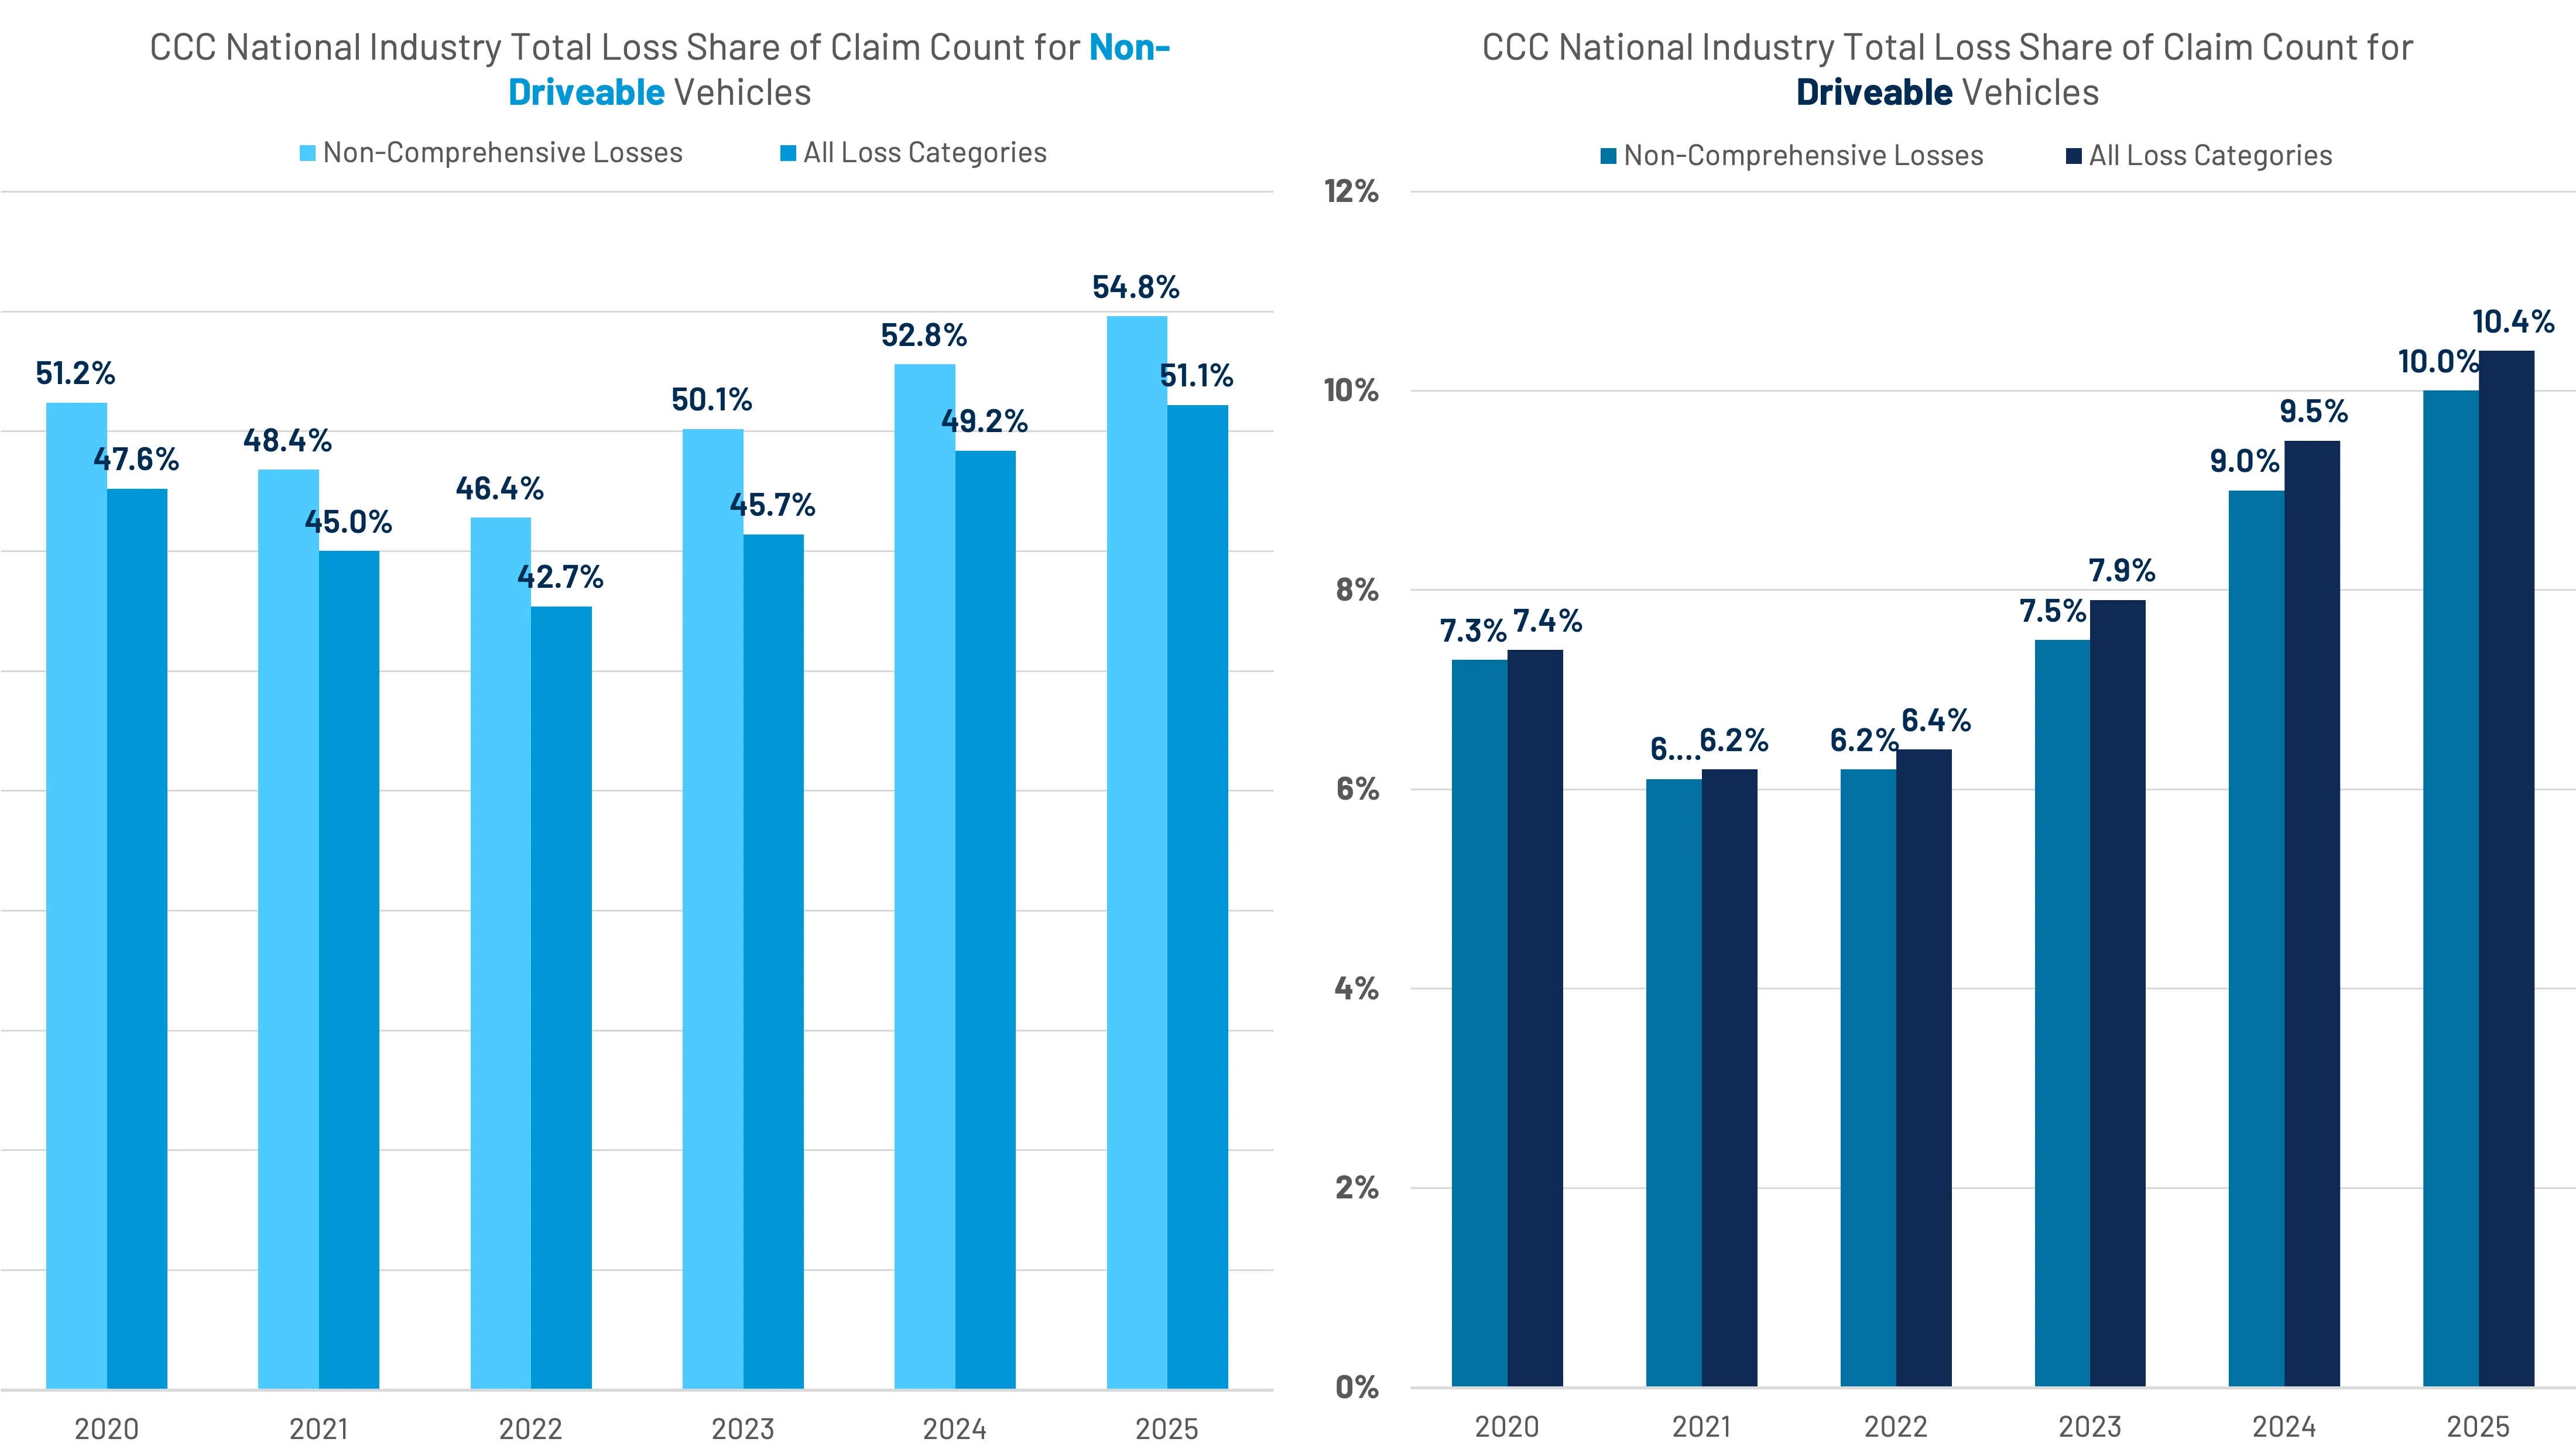
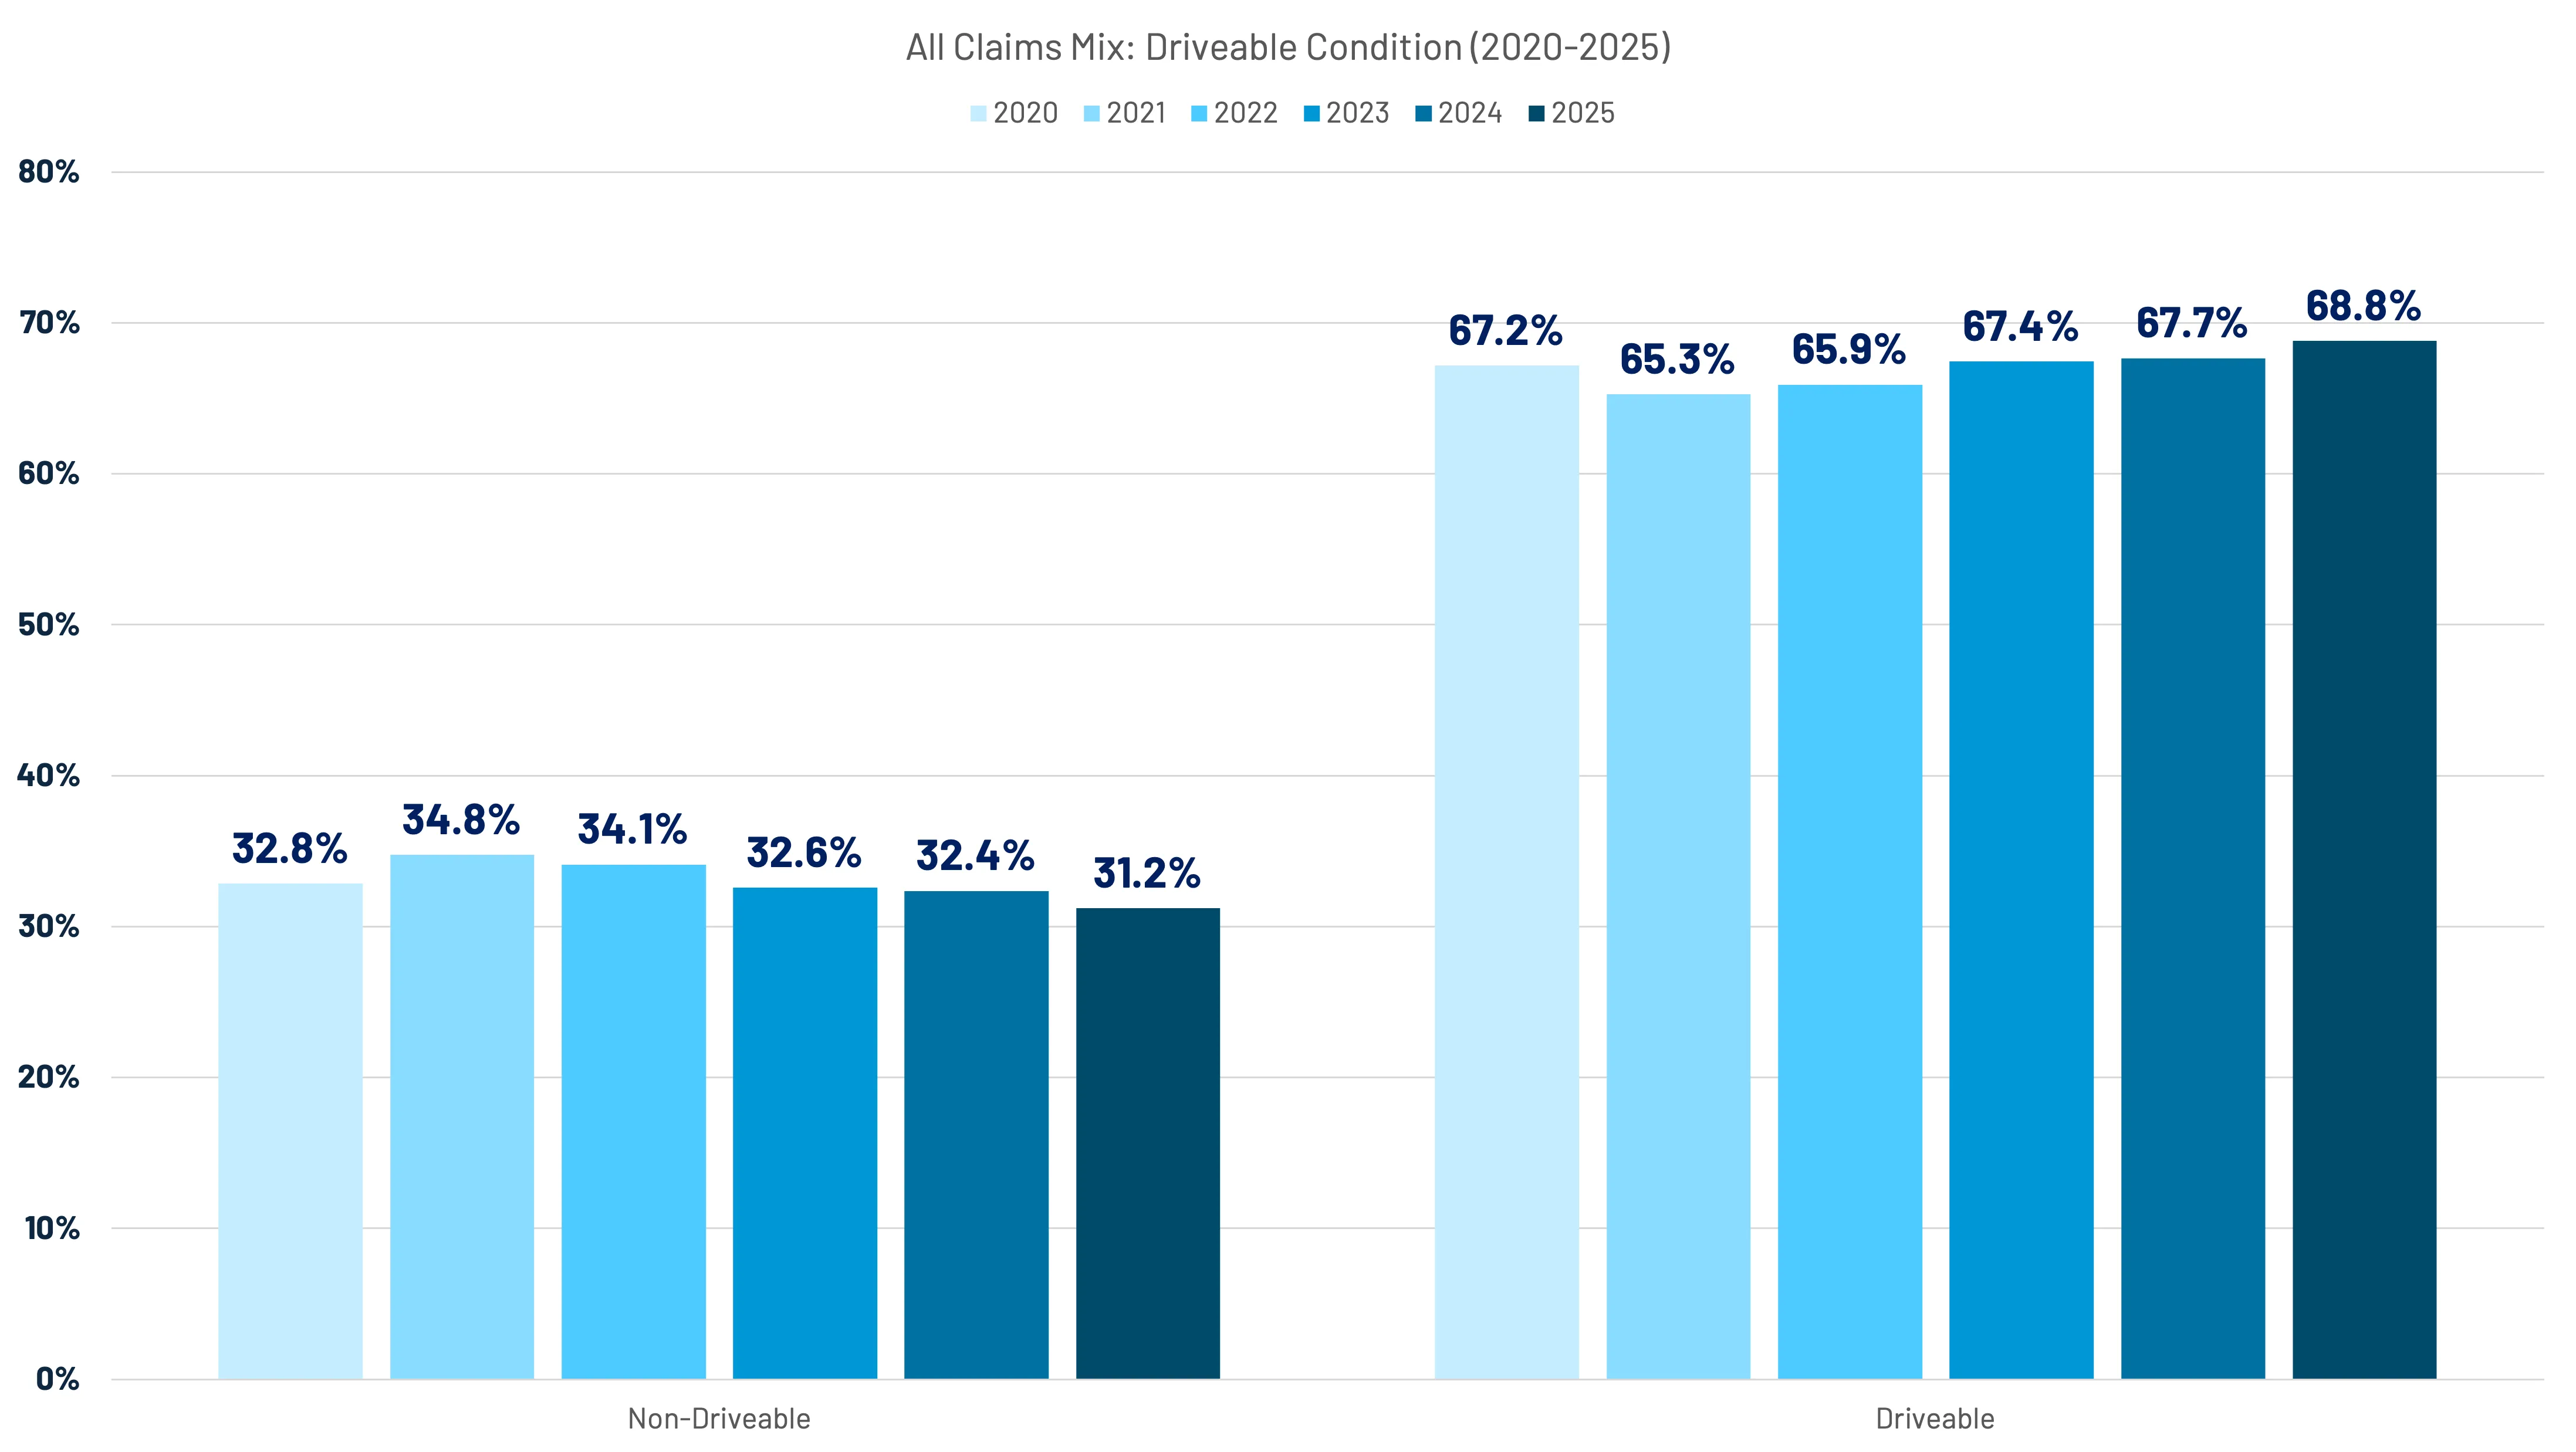
The increasing share of driveable total losses reflects one of the most challenging paradigms in claims at present, especially when considering the aging vehicle fleet. Consumers opting to retain damaged driveable vehicles are likely doing so given the costs associated with replacing a vehicle.
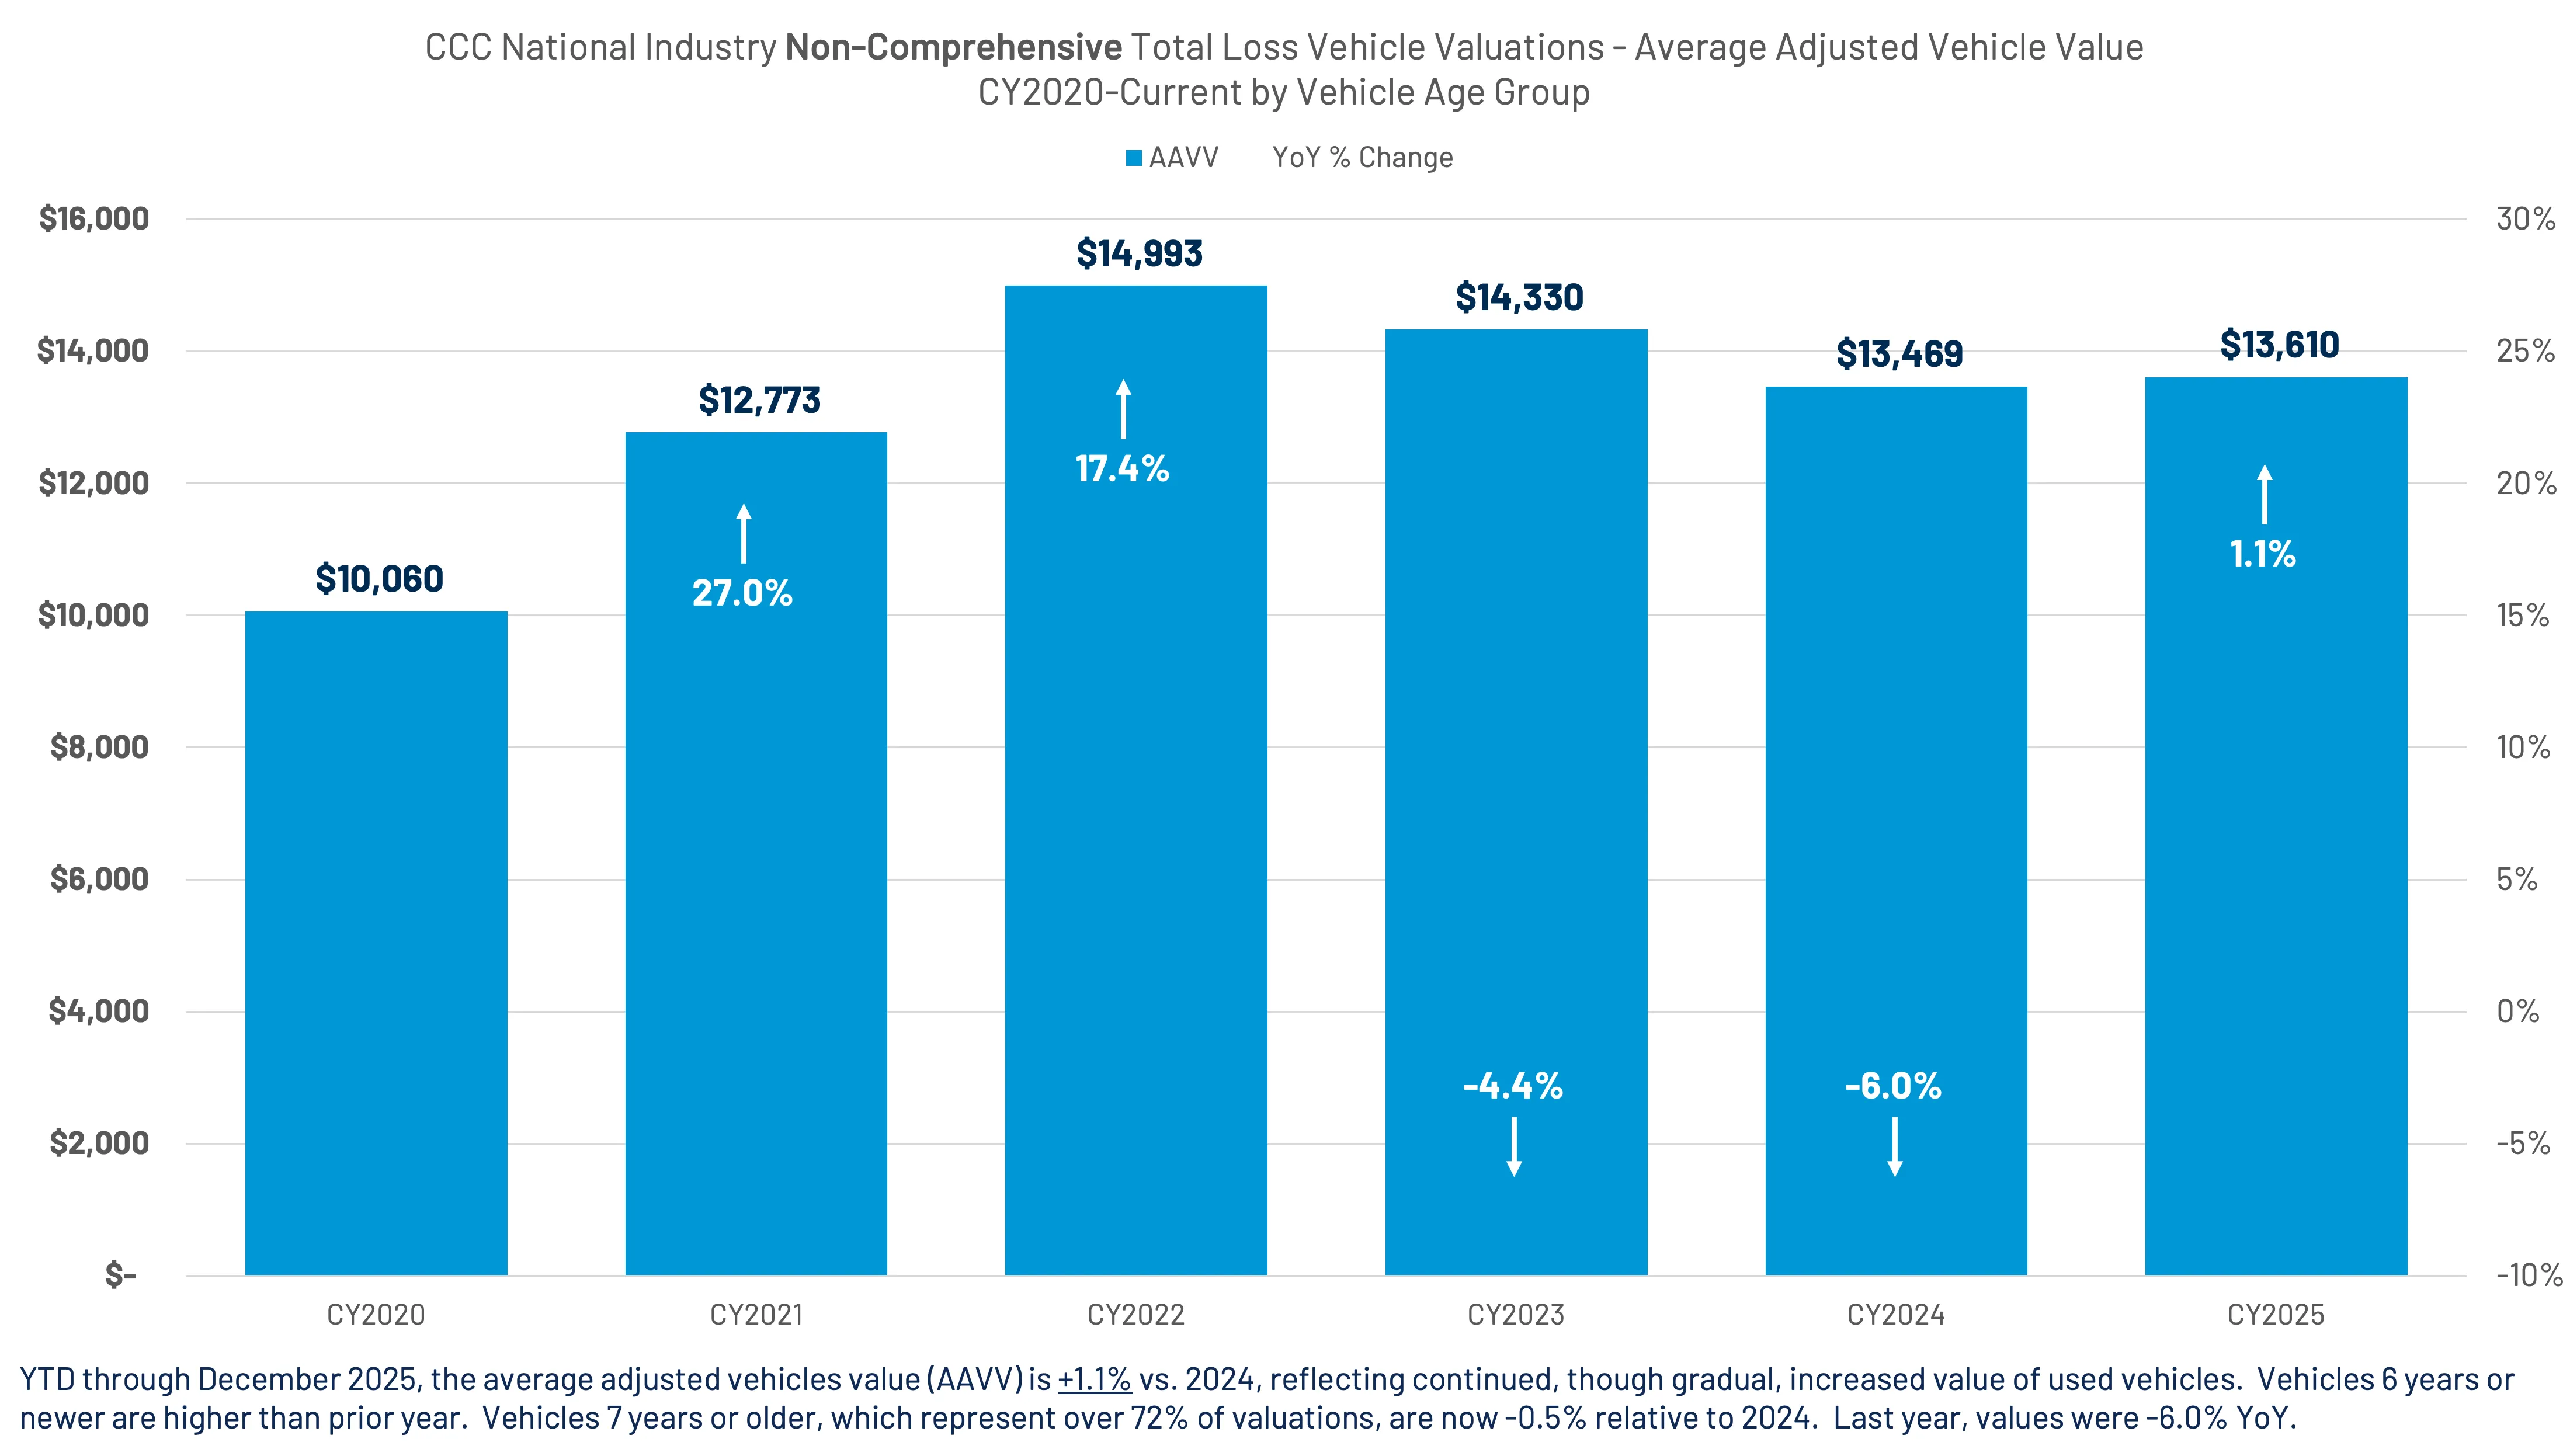
Average adjusted vehicle values (AAVV) for valuations run through CCC fluctuated throughout 2025, following relative declines in 2023 and 2024. Inflationary conditions in 2021 and 2022 led to unprecedented increases in used vehicle values, which was reflected in the valuations for potential total losses. (Figure 22)
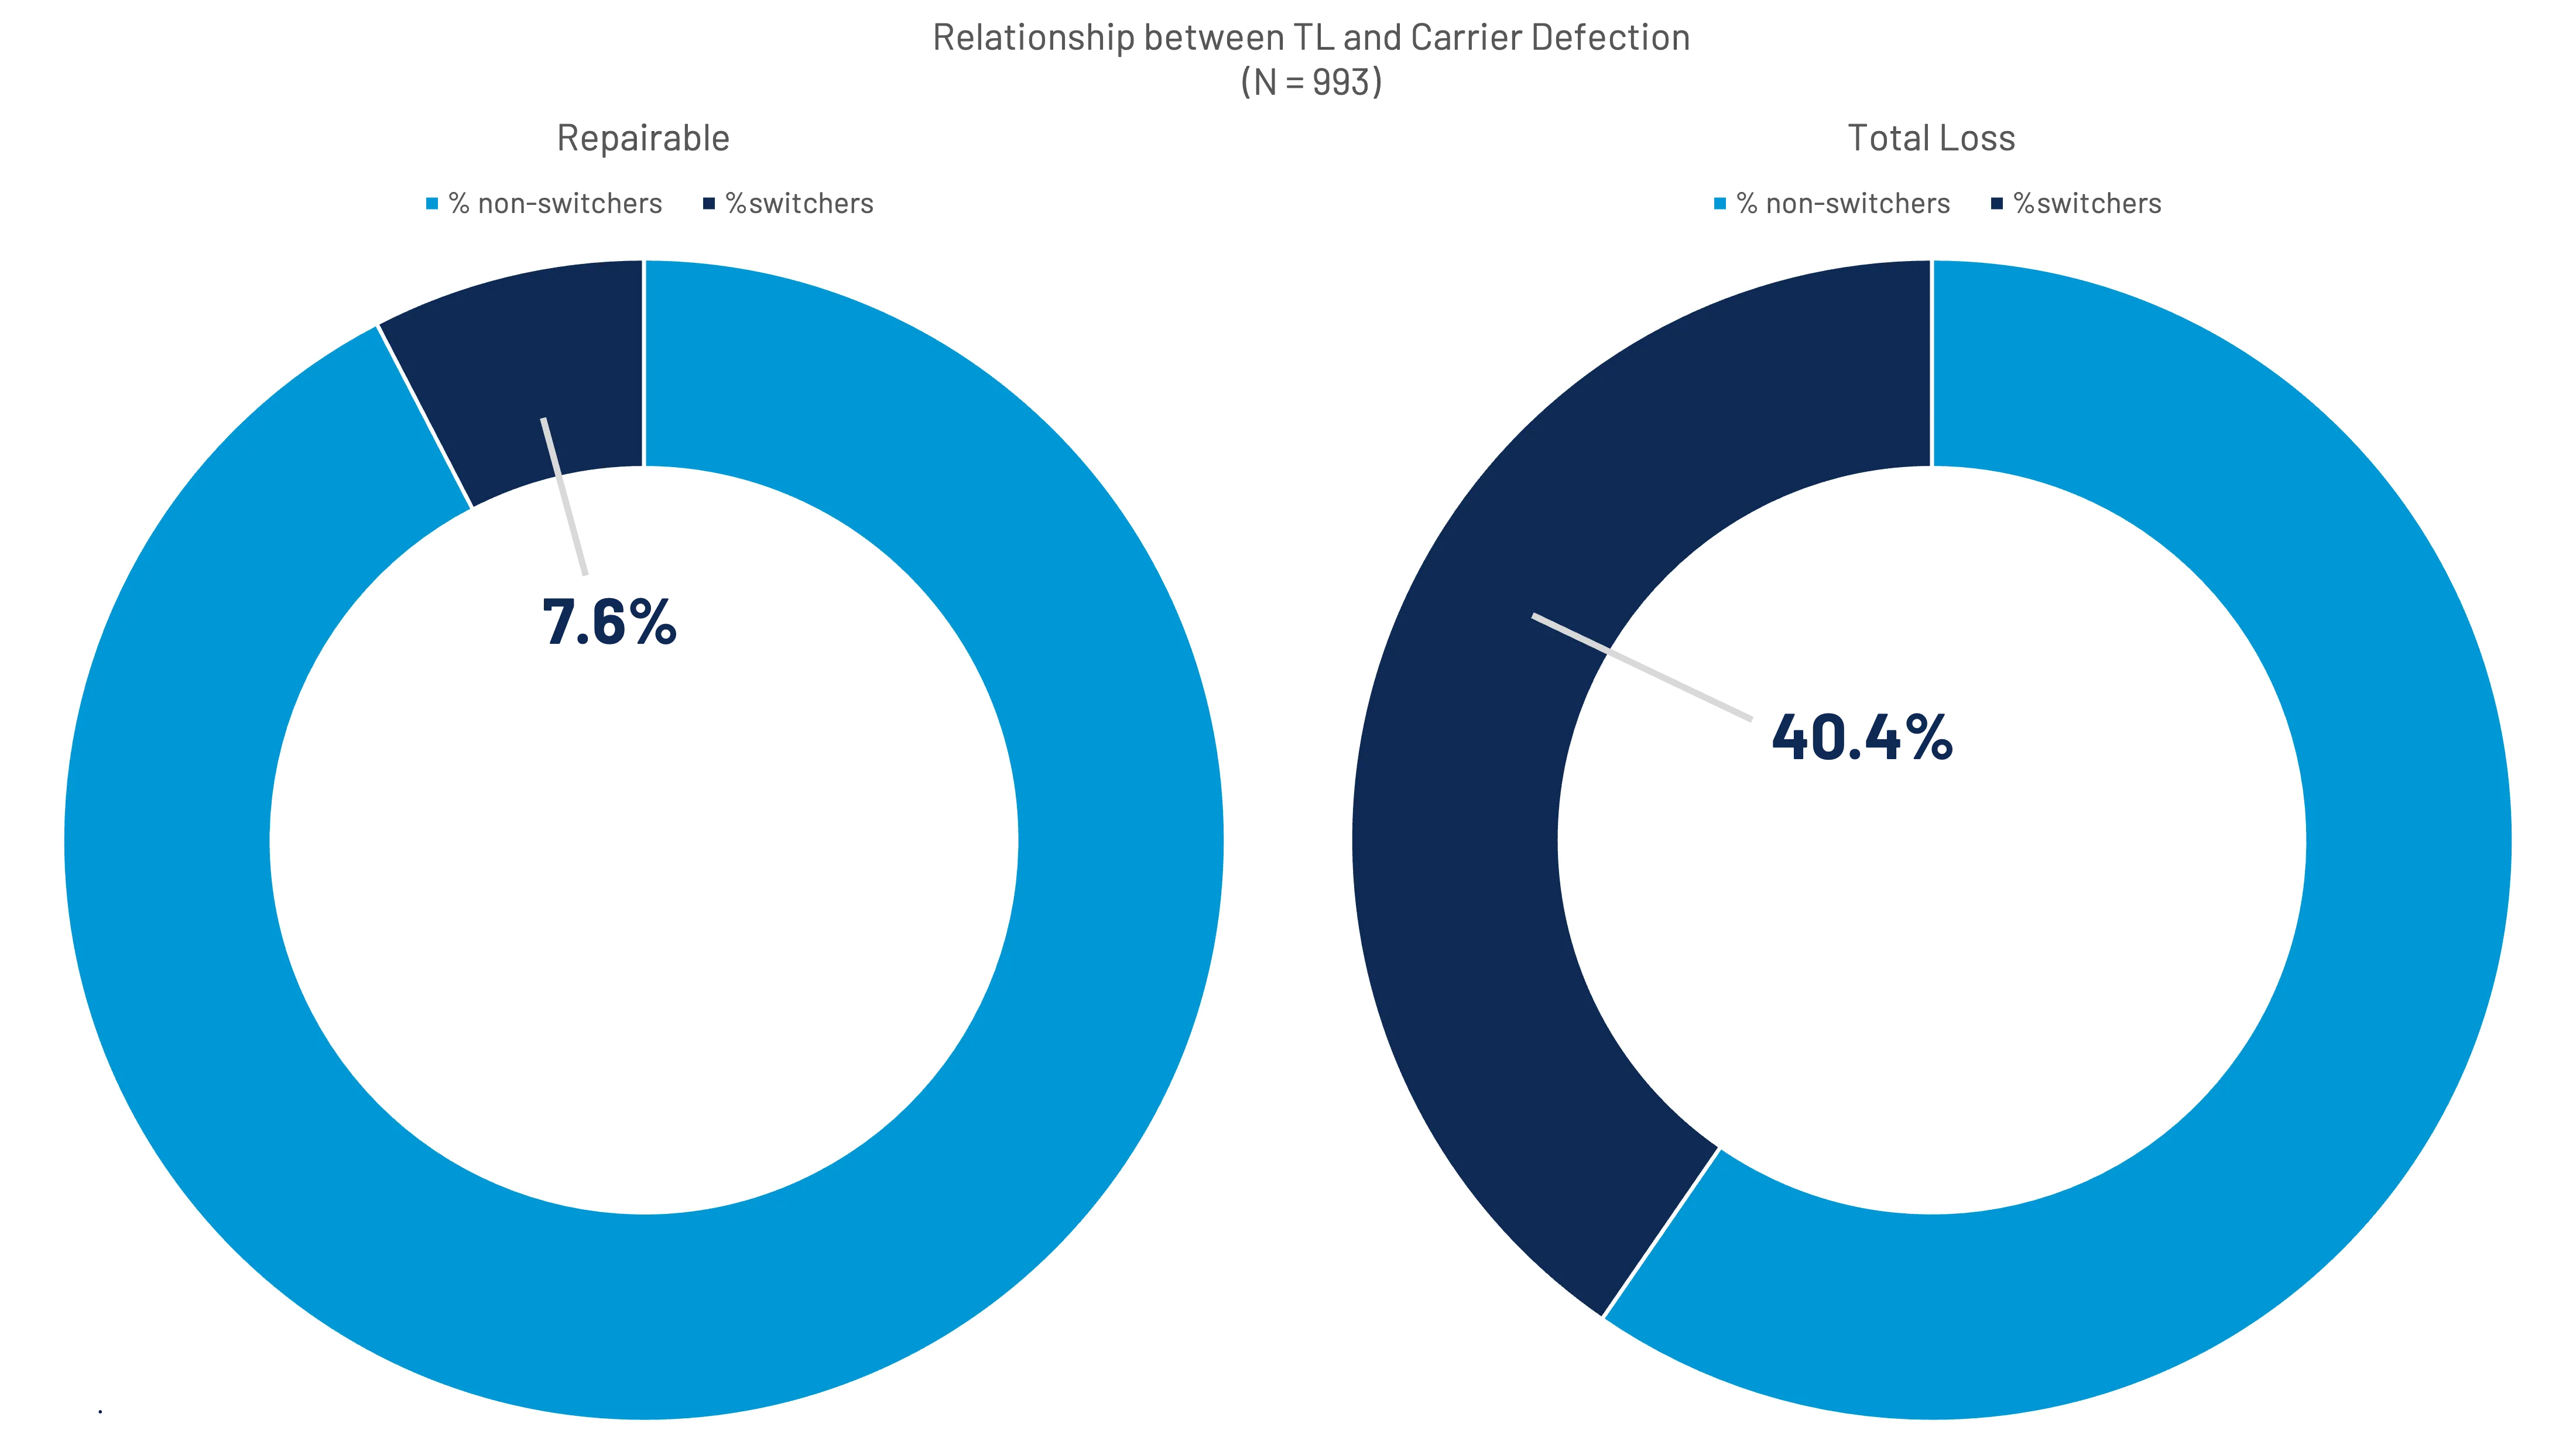
Considering the seemingly high probability of sustained total loss frequency - given the share of older vehicles - one finding from CCC's 2024 Moments of Truth report on customer experience appears especially poignant. The study found that in 40.4% of collision claims that resulted in a total loss, the insured defected to another carrier, some 33% higher than with repairable claims. (Figure 23)
As first-party filing behavior becomes more discretionary, the liability side of the equation tells a different story. While smaller first-party APD claims are being absorbed through higher deductibles or self-pay decisions, liability (property damage) and bodily injury claims are not following the same trajectory.
In other words, as the lower end of the severity spectrum thins out, the upper end – particularly within casualty claims – is becoming more pronounced.

As previously mentioned, while most major personal auto lines – collision, property damage, and PIP – have seen claim frequency drift downward over the last two years, bodily injury (BI) is the clear outlier.
According to Fast Track, BI paid claim frequency has increased 11% over the last two years, while property damage liability claims decreased 7.6% over the same period. (Figure 24)
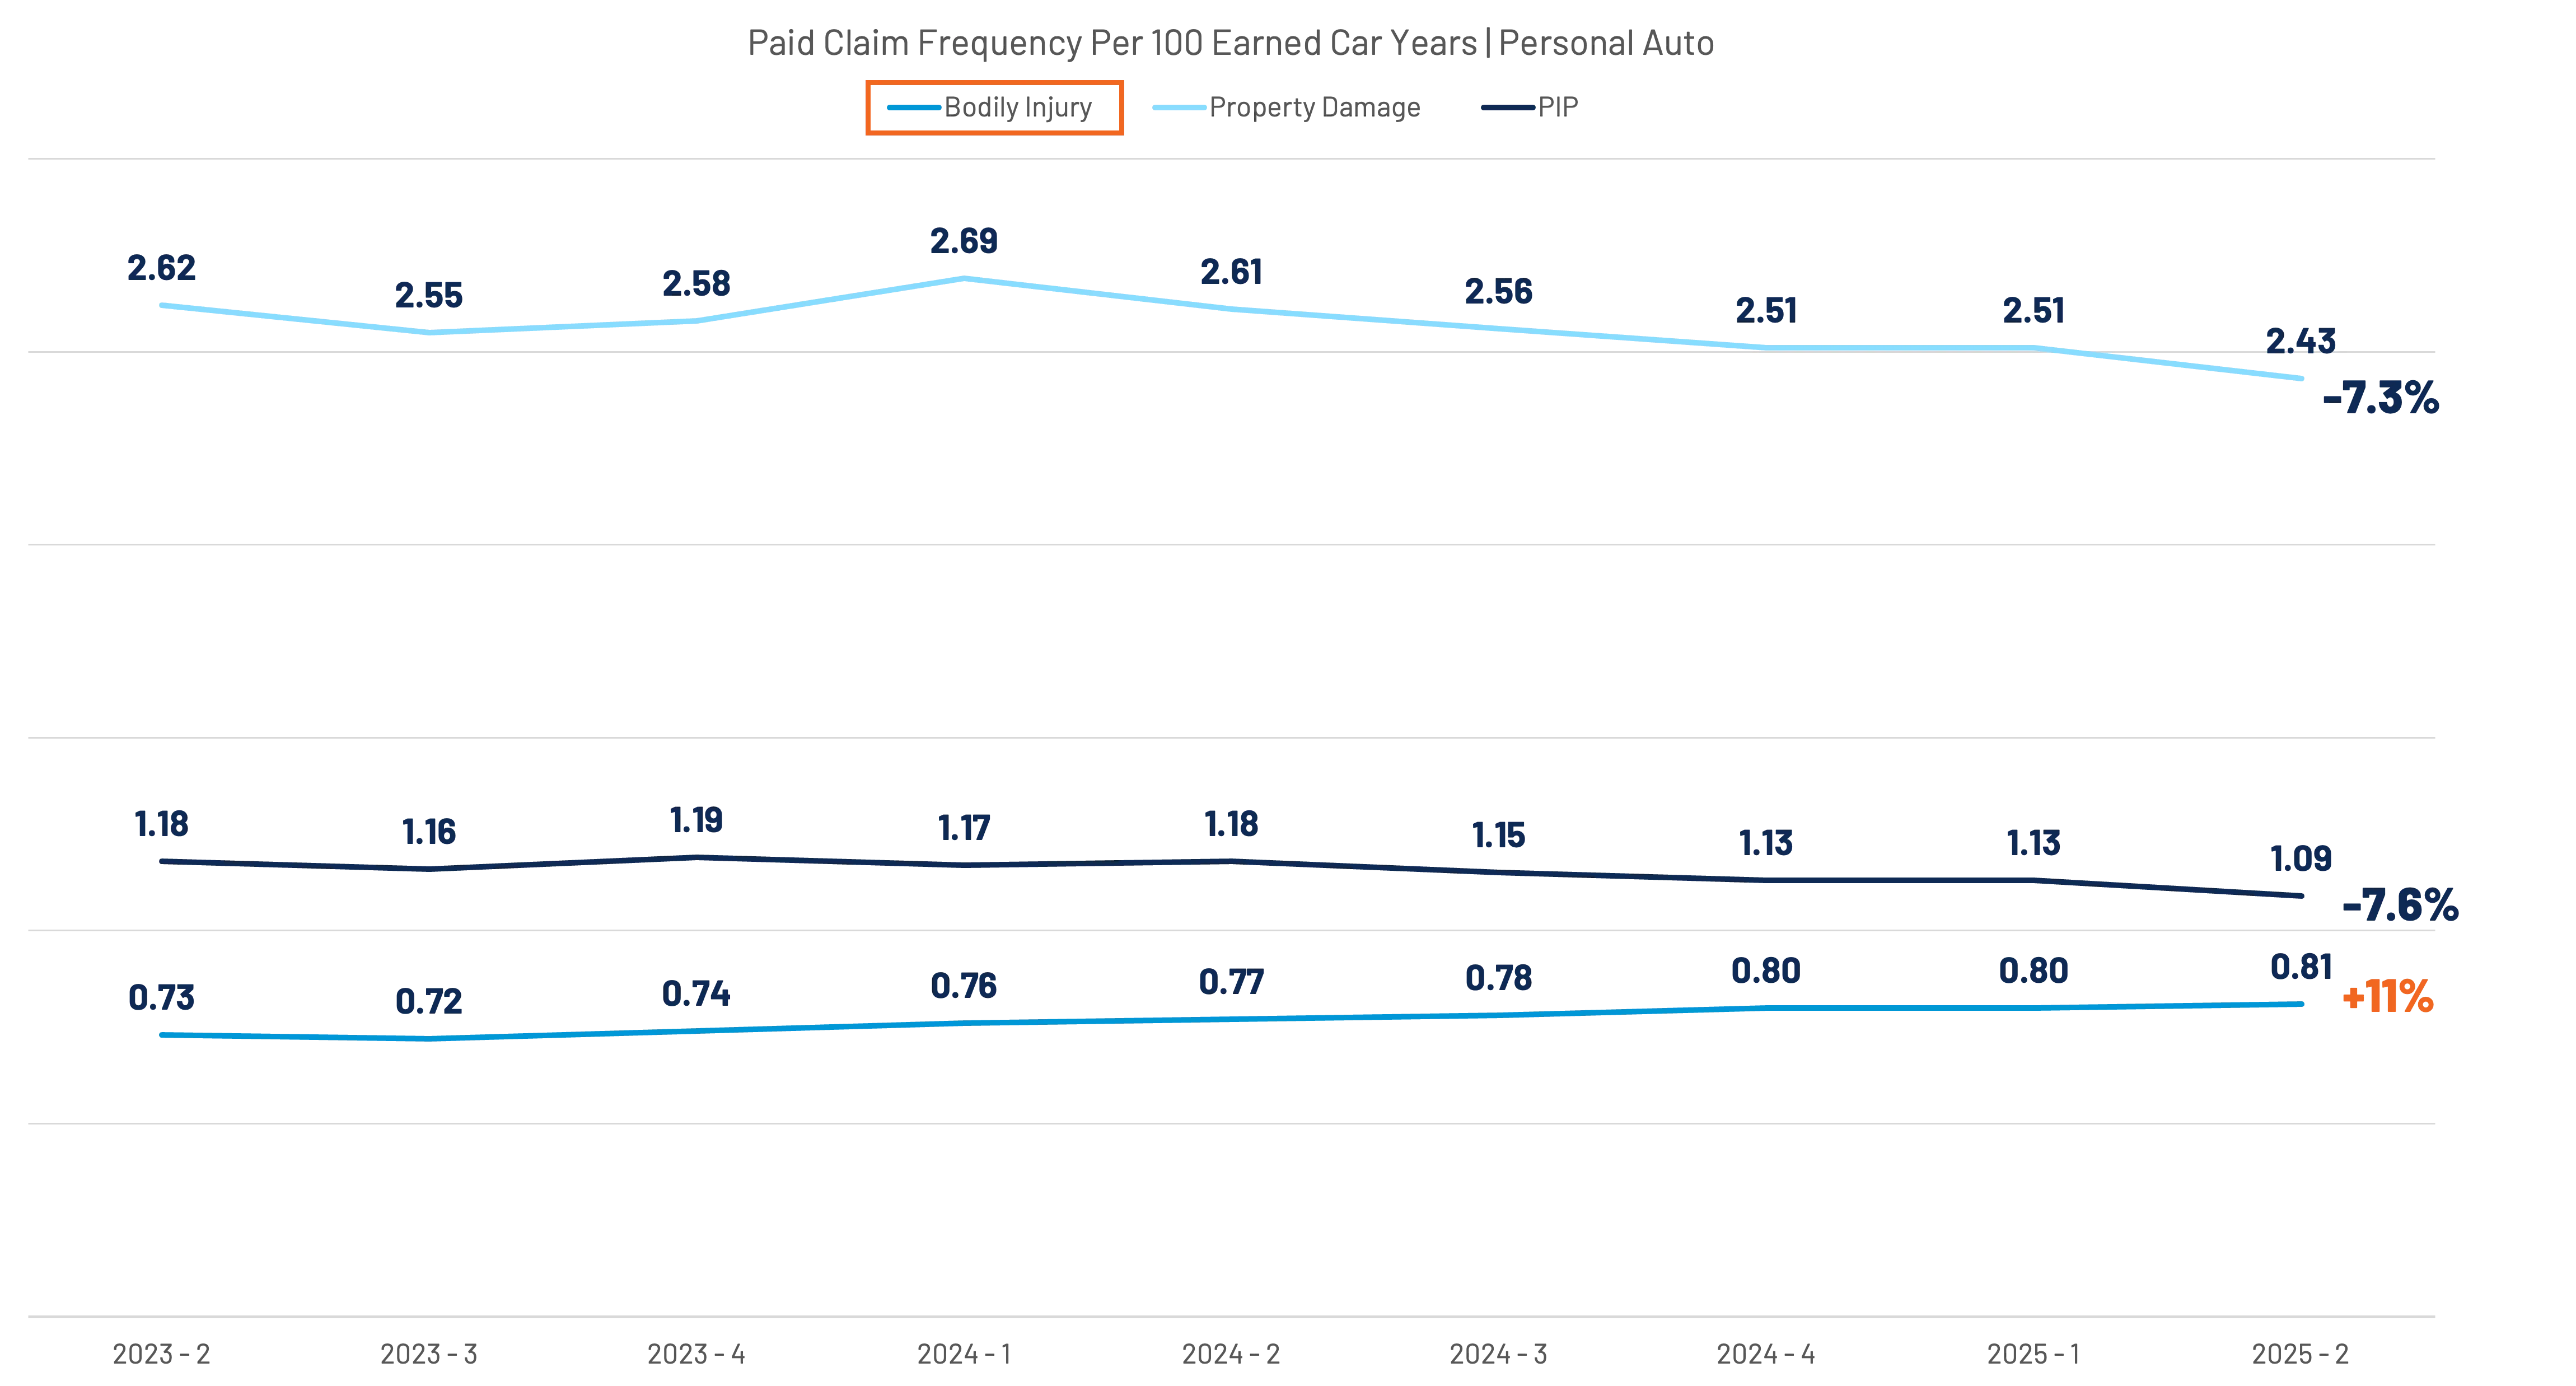
That divergence is significant.
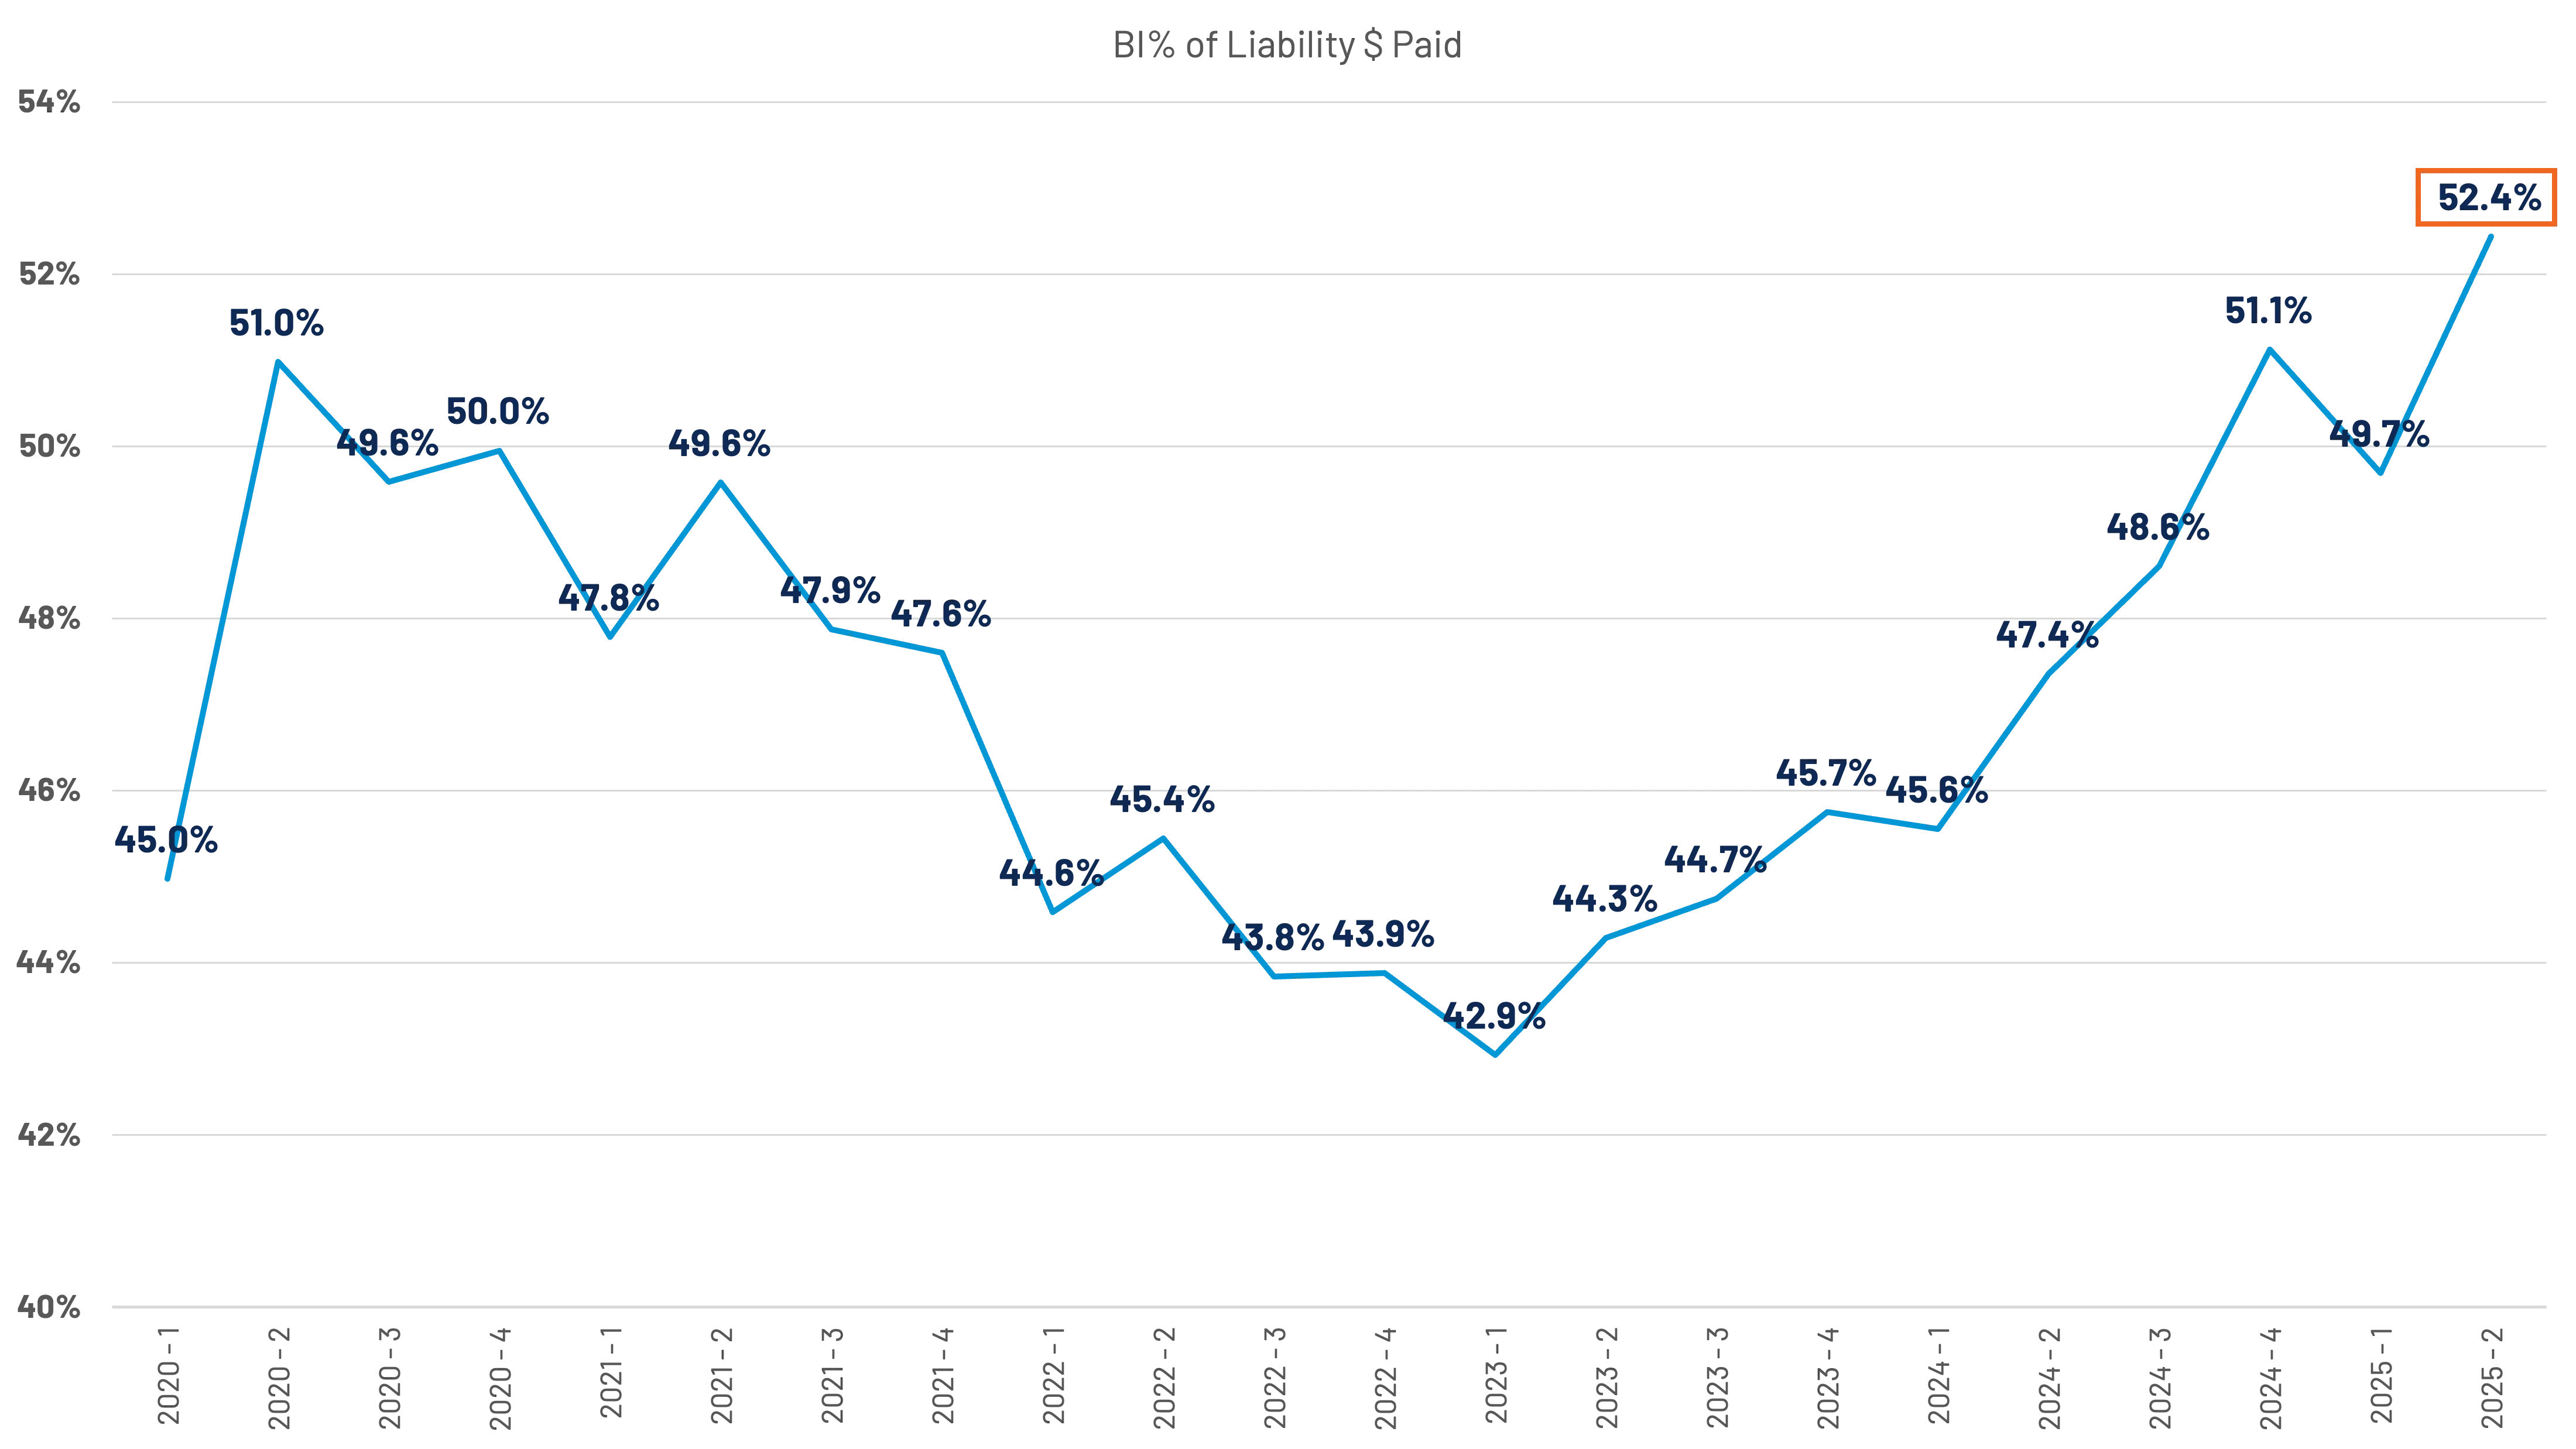
Per-exposure indemnity costs are rising at roughly four times the rate of general inflation, and when paired with rising frequency, the financial impact compounds quickly. BI now accounts for 52.4% of total liability dollars paid, despite only about one in four property damage exposures carrying an associated BI exposure. (Figure 25) This signals a new high-water mark for a line already vulnerable to overpayment risk tied to unsupported or inflated injury claims.
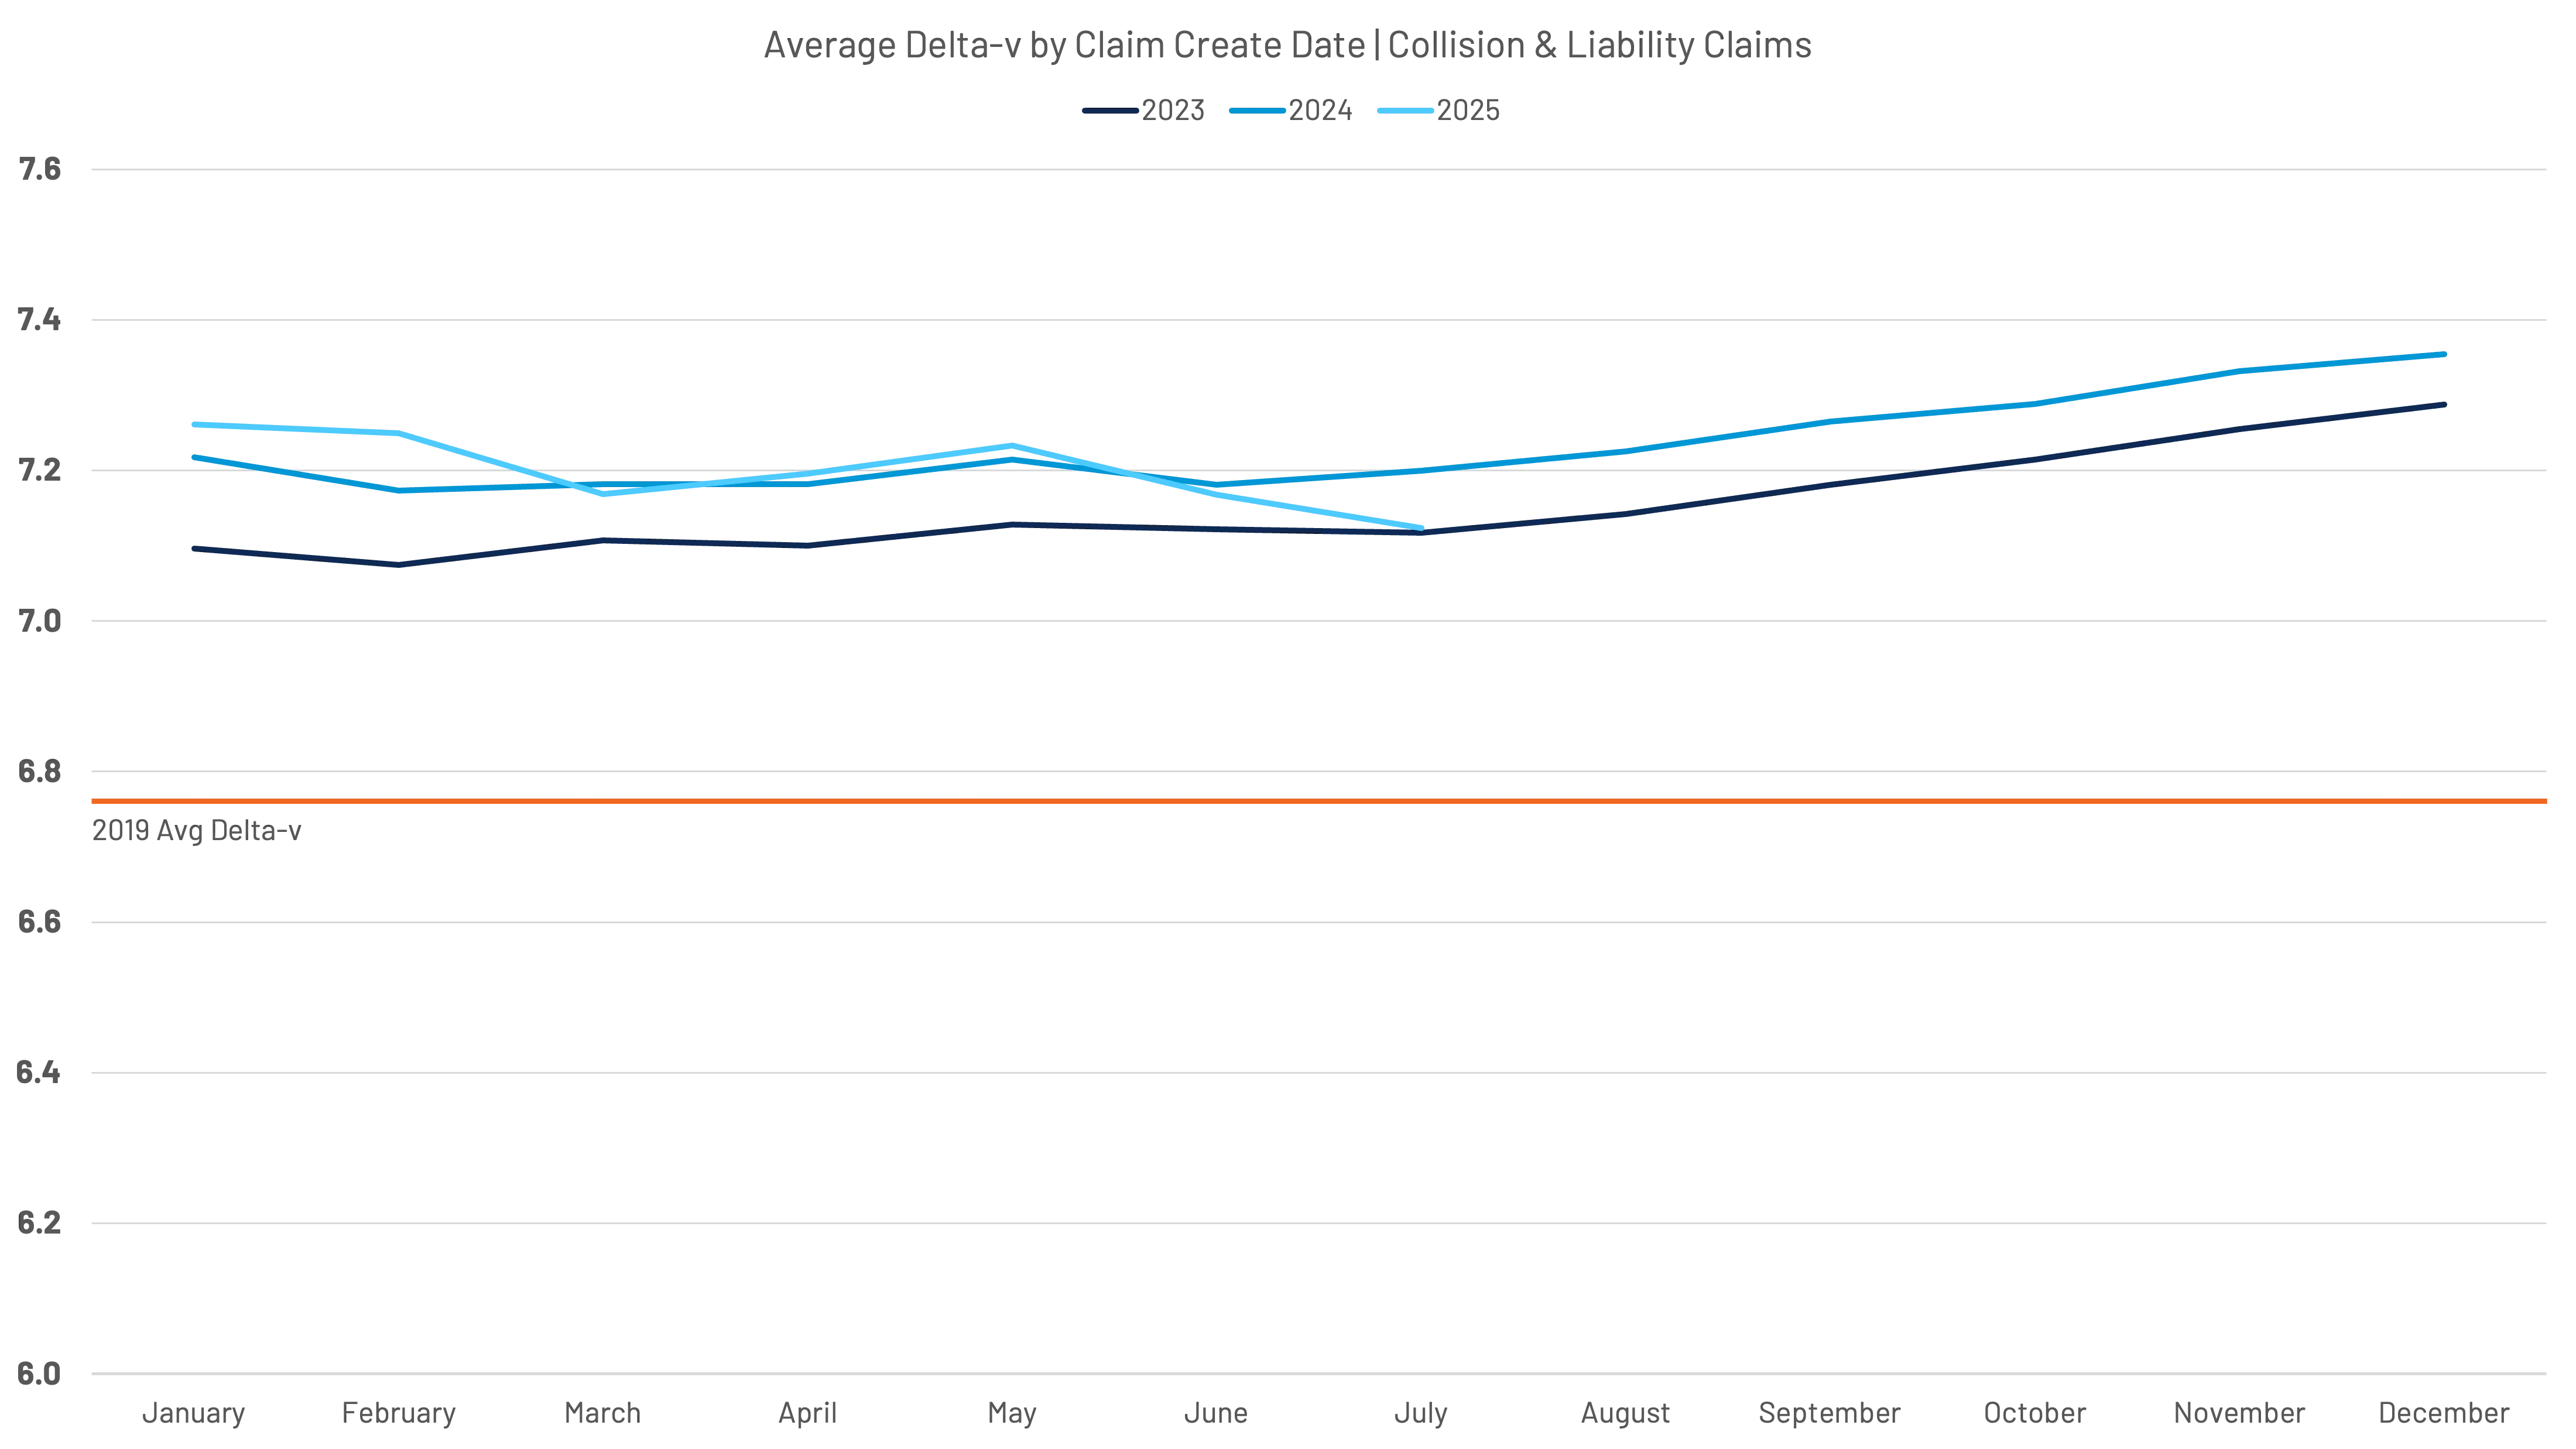
Importantly, this does not appear to be driven by more severe crashes. CCC Casualty data shows average Delta-v (change in velocity at impact) remains only slightly above 2019 levels and has changed little over the last three years. (Figure 26)
Instead, broader forces appear to be at play – particularly social inflation.
Independent indicators reinforce this trend:
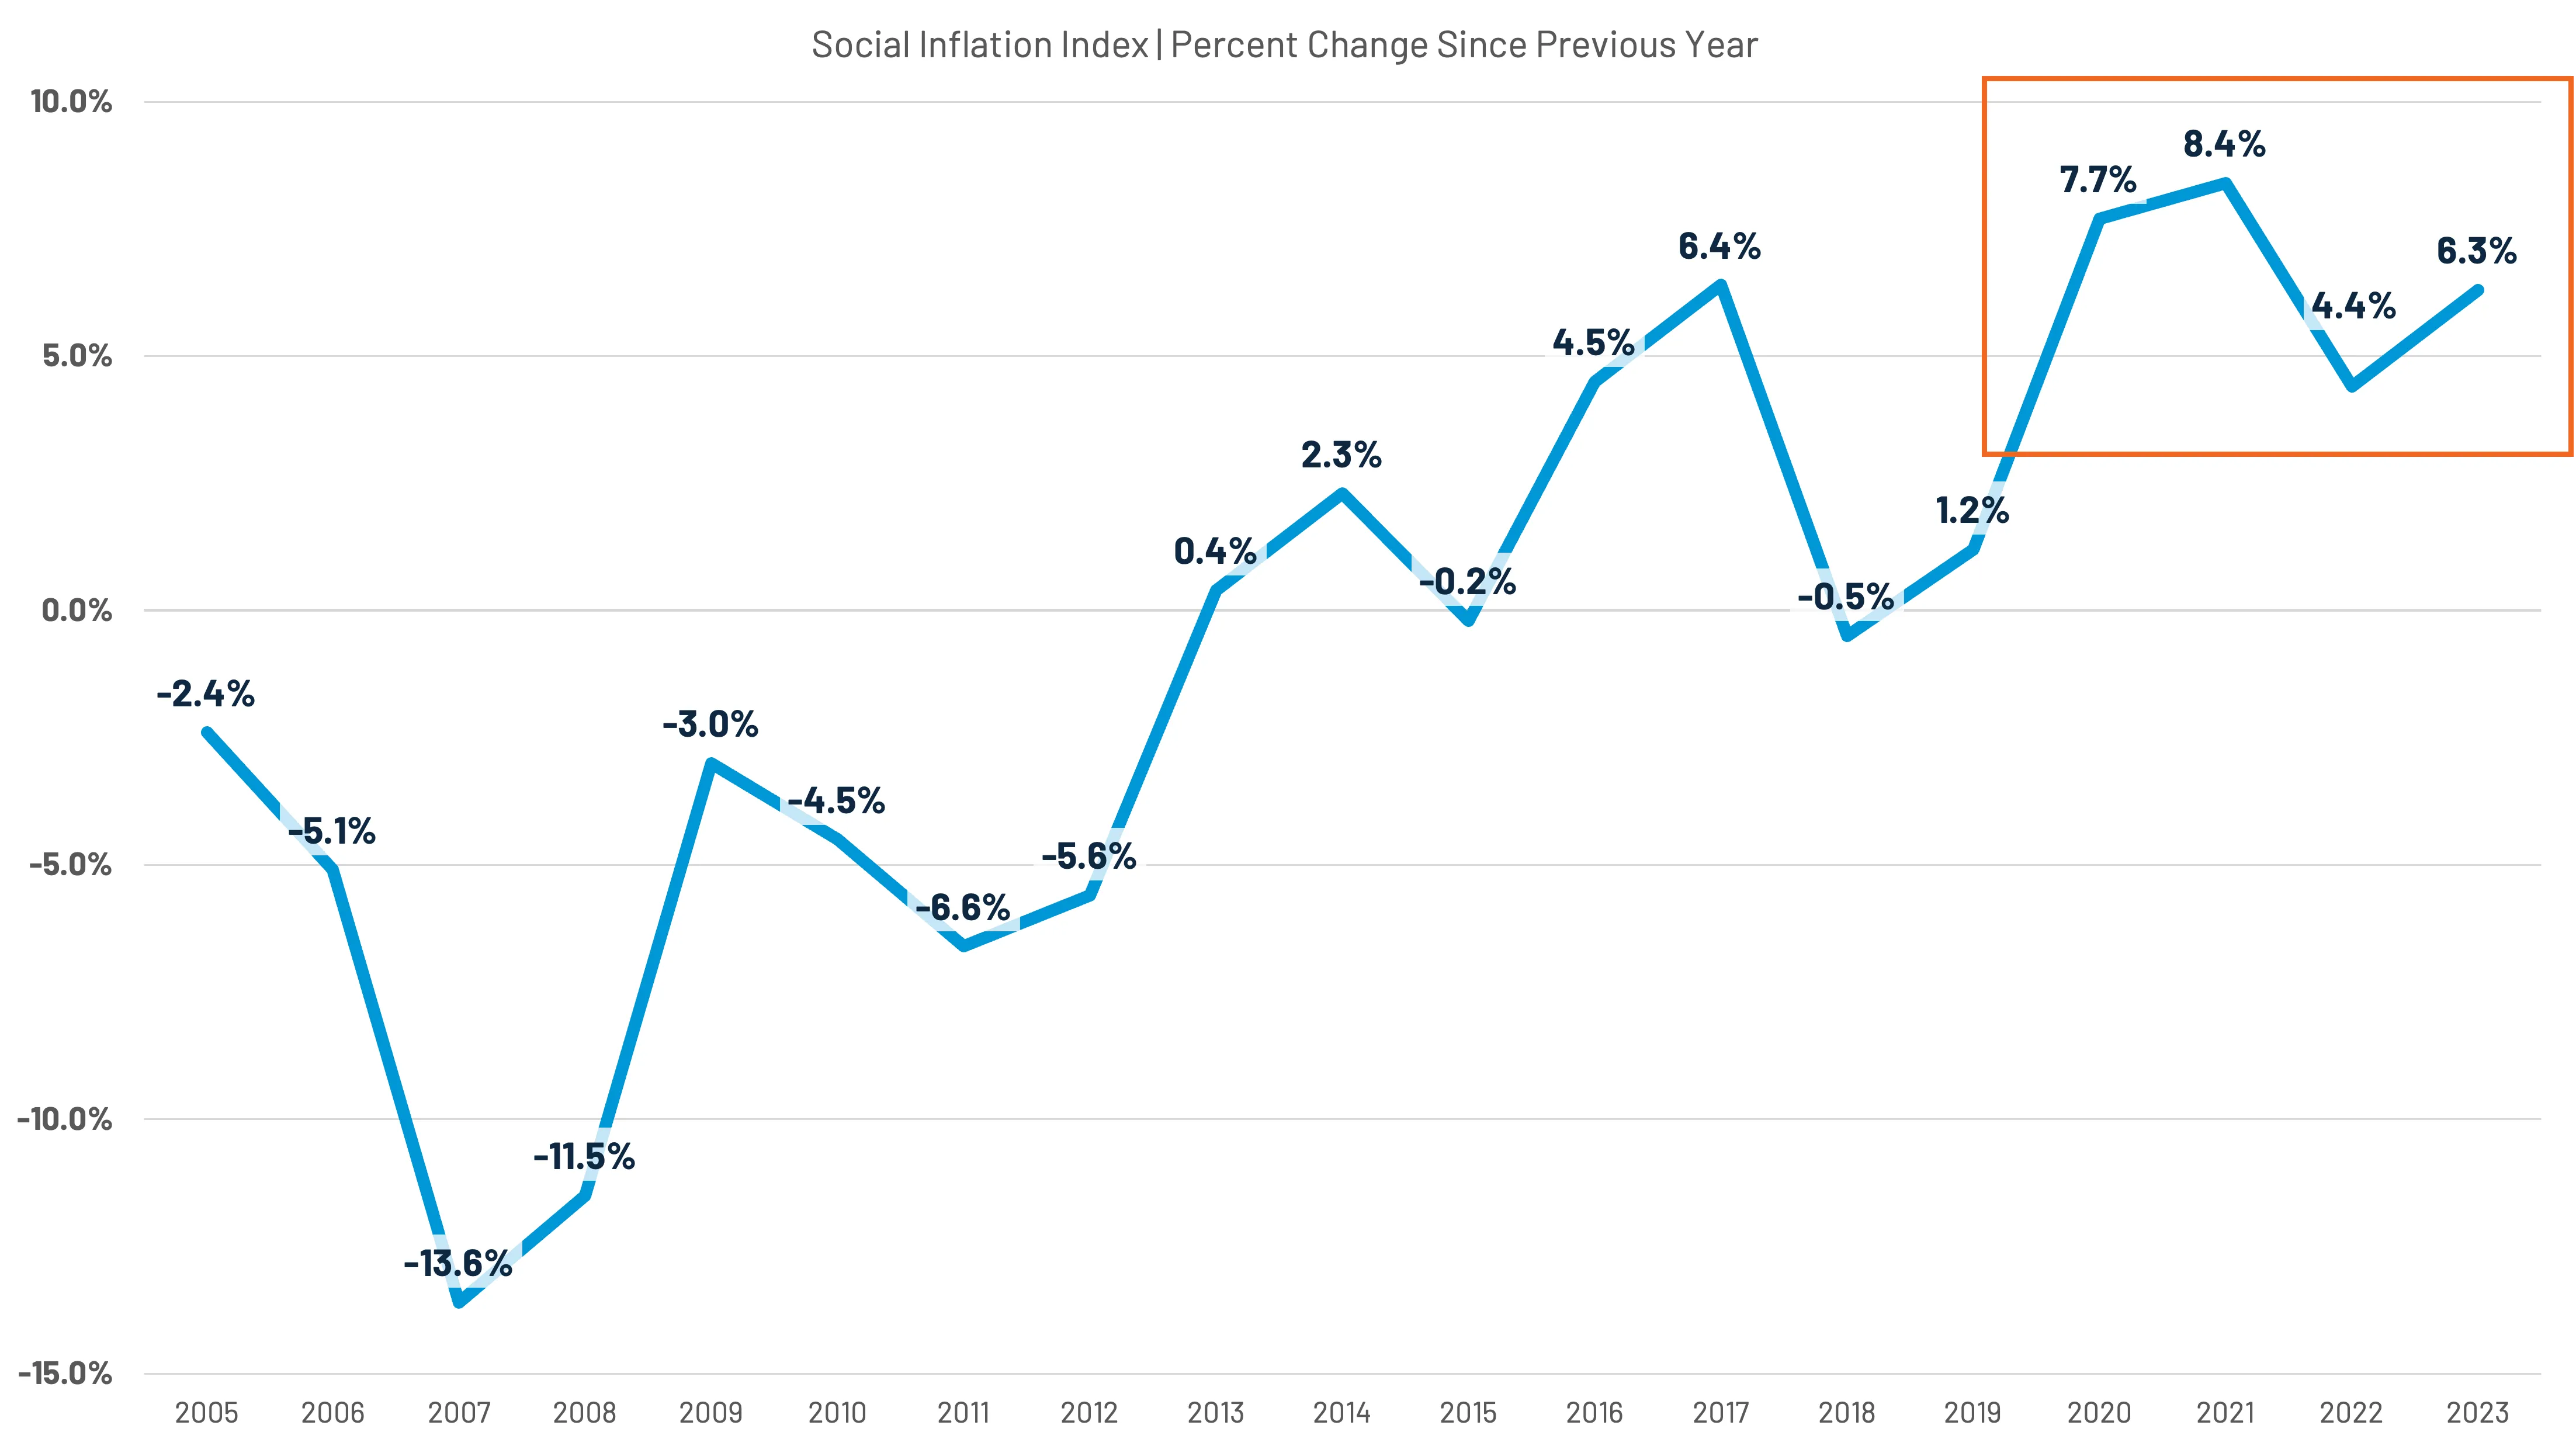
- Swiss Re's Social Inflation Index shows a 33% increase in liability costs from 2020–2024 tied to social inflation alone. (Figure 27)
- Marathon Strategies reports nuclear verdicts ($10M+) rose 52% from 2023 to 2024.
- A Triple-I + CAS study estimates $92–$102 billion in combined economic and social inflation impact on personal auto over the past decade, with the majority occurring post-pandemic.
These findings collectively suggest that post-COVID affordability pressures, healthcare cost inflation, litigation intensity, and evolving jury behavior have fundamentally shifted the liability landscape.
This is what makes the increasing BI claims trend unprecedented – not a surge in crash energy, but a change in the environment influencing injury claiming behavior, treatment patterns, and legal outcomes. This trend underscores a broader pattern emerging across the claims ecosystem: complexity is concentrating at the higher end of severity.
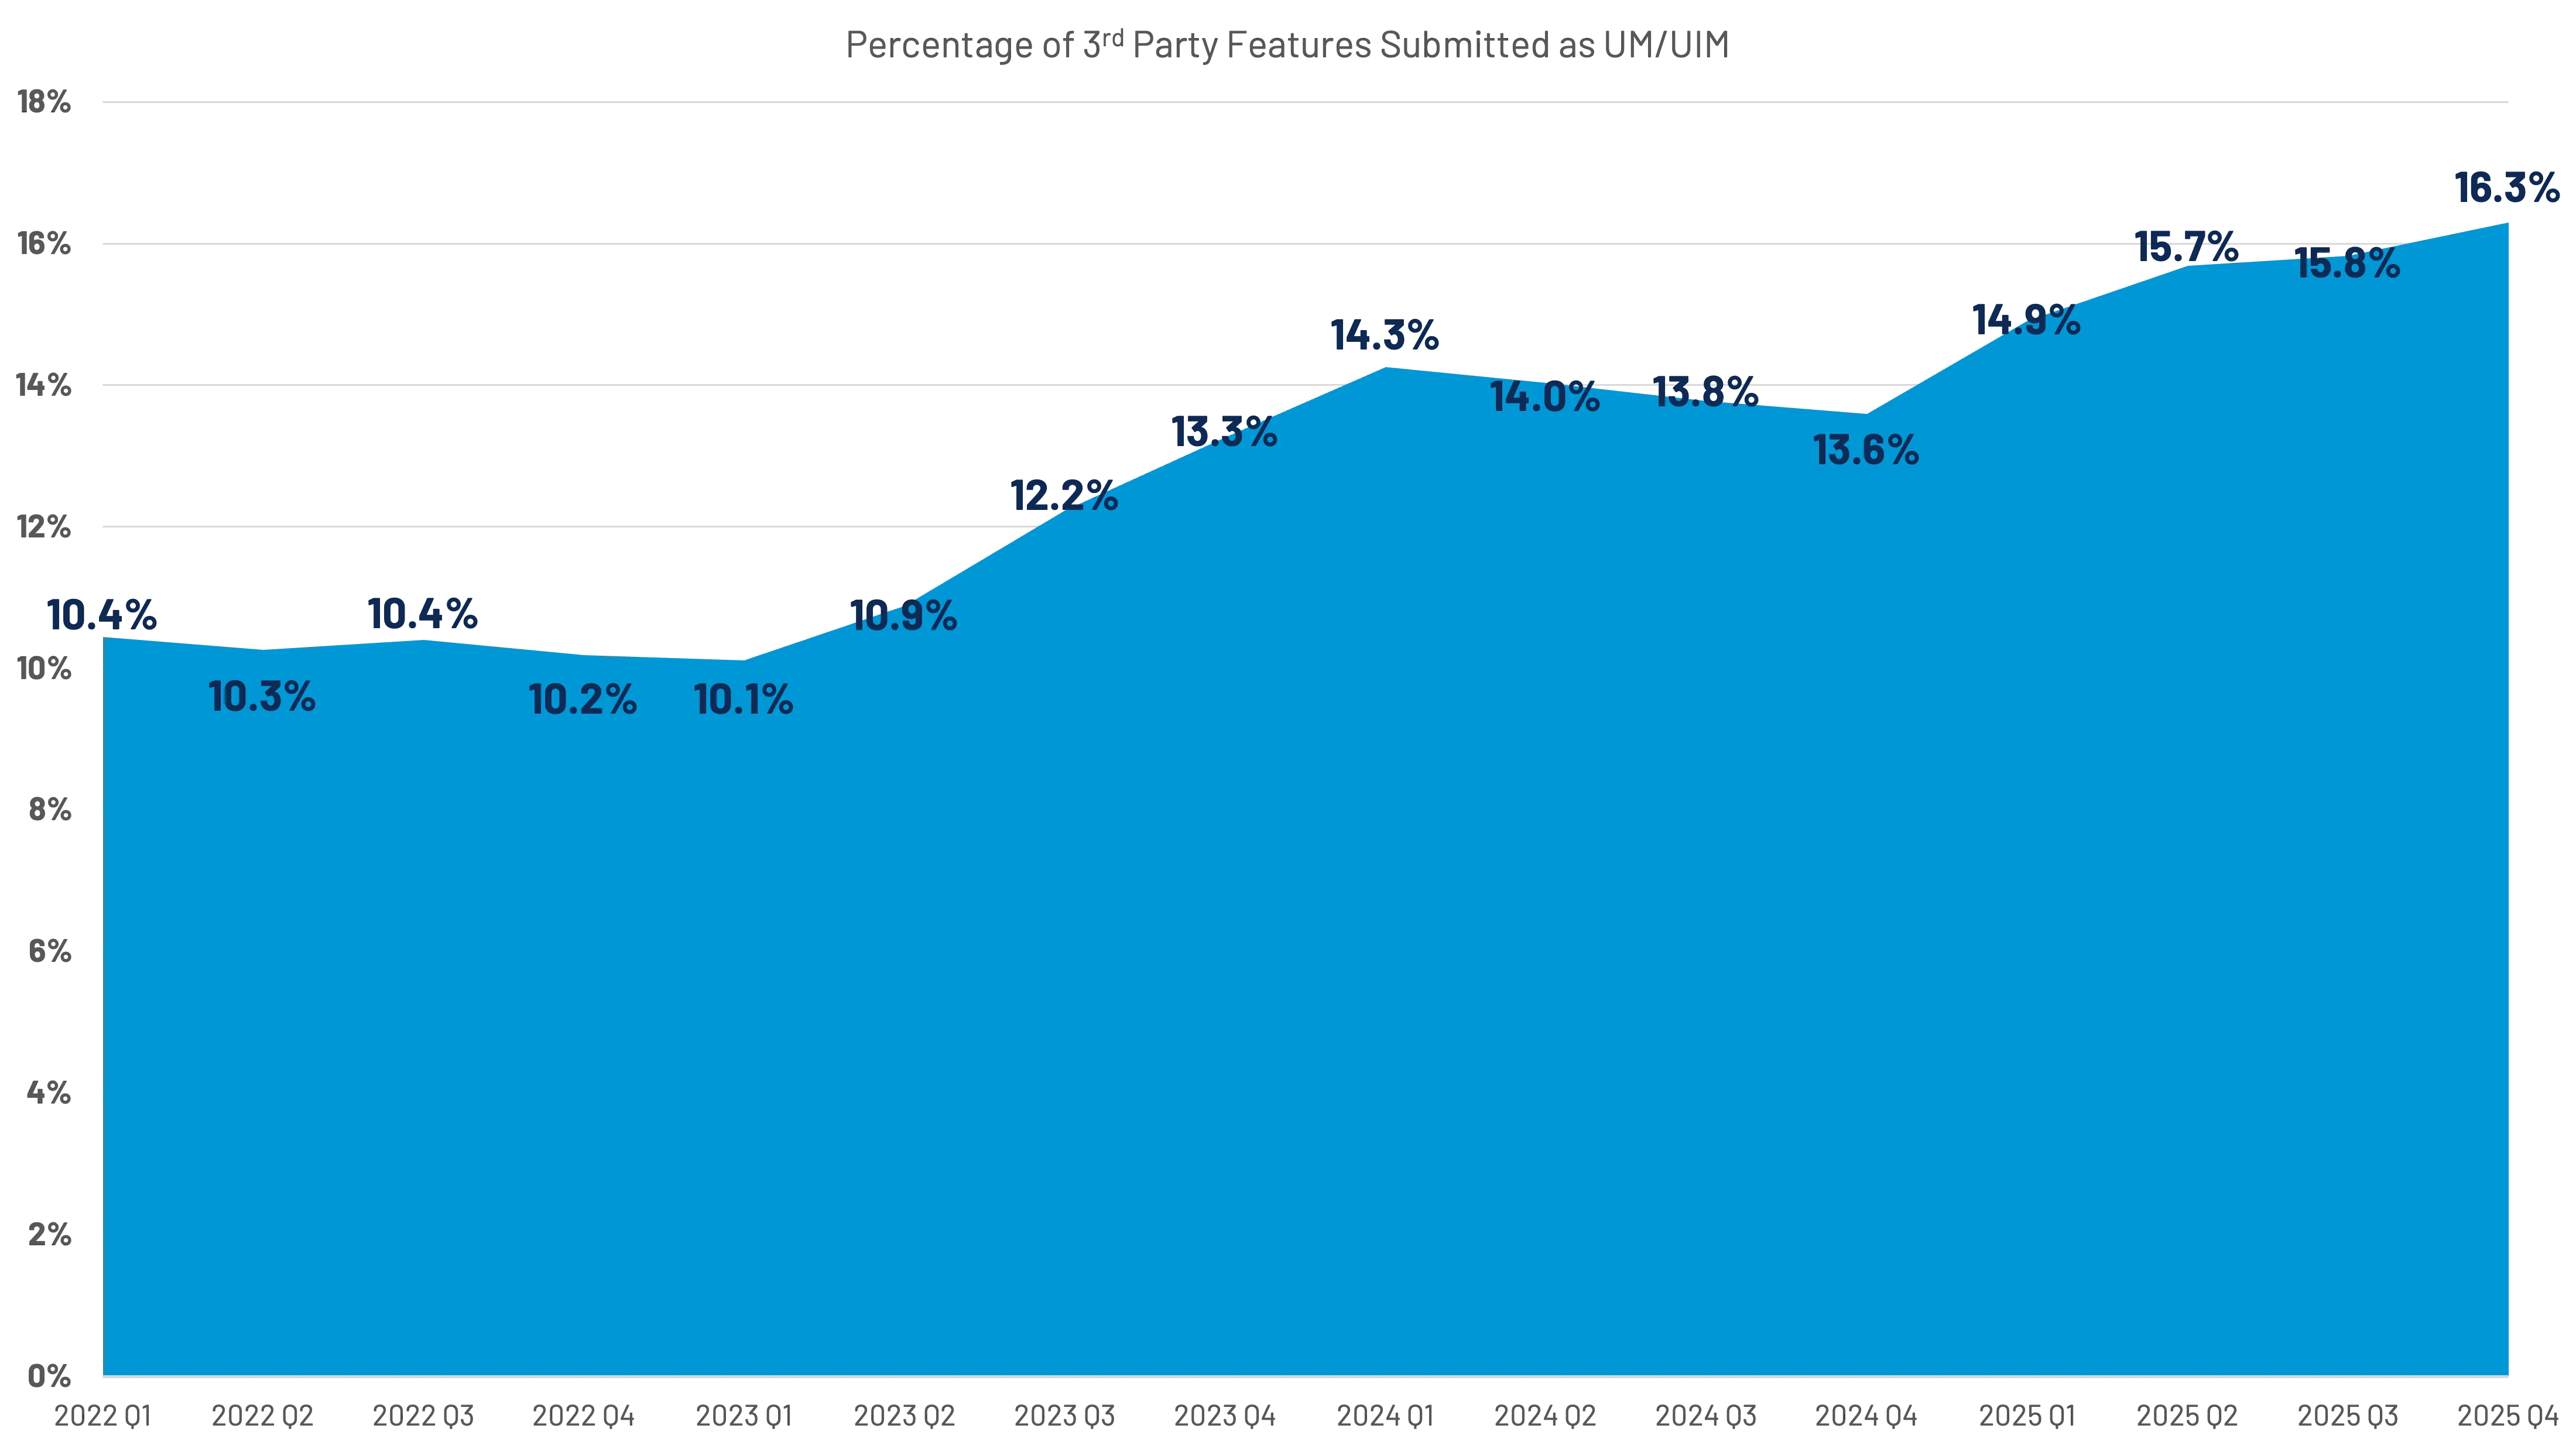
At the same time, notable increases in uninsured and underinsured drivers on the roadways further shifts cost burden to compliant, adequately insured policyholders. In a recent report, Insurance Research Council estimated that the combined population of uninsured and underinsured on the U.S. roadways was 33.4% as of 2023, representing a 10% increase since 2017.
As these increases predated double-digit policy premium increases in 2023 and 2024, this number is likely much higher now. The signs are evident in our percentage of UM/UIM injury claim submissions, which continue to increase into 2026, effectively doubling over the last 3-4 years. (Figure 28)
That same concentration dynamic is evident within APD claims. As lower-severity claims fall out of the system and the share of total losses rises, the remaining repairable claims are increasingly skewed toward older vehicles and units with more embedded technology still under repairable thresholds. Understanding today's car parc composition – age, technology content, and part profile – is therefore becoming a more important determinant of claim outcomes.

Advances in vehicle technology – from sensors to embedded safety systems – are increasingly shaping how vehicles are priced, inspected, and repaired. Compounding this structural driver of industry complexity is an aging car parc mix altering the cost distribution across repairable claims.
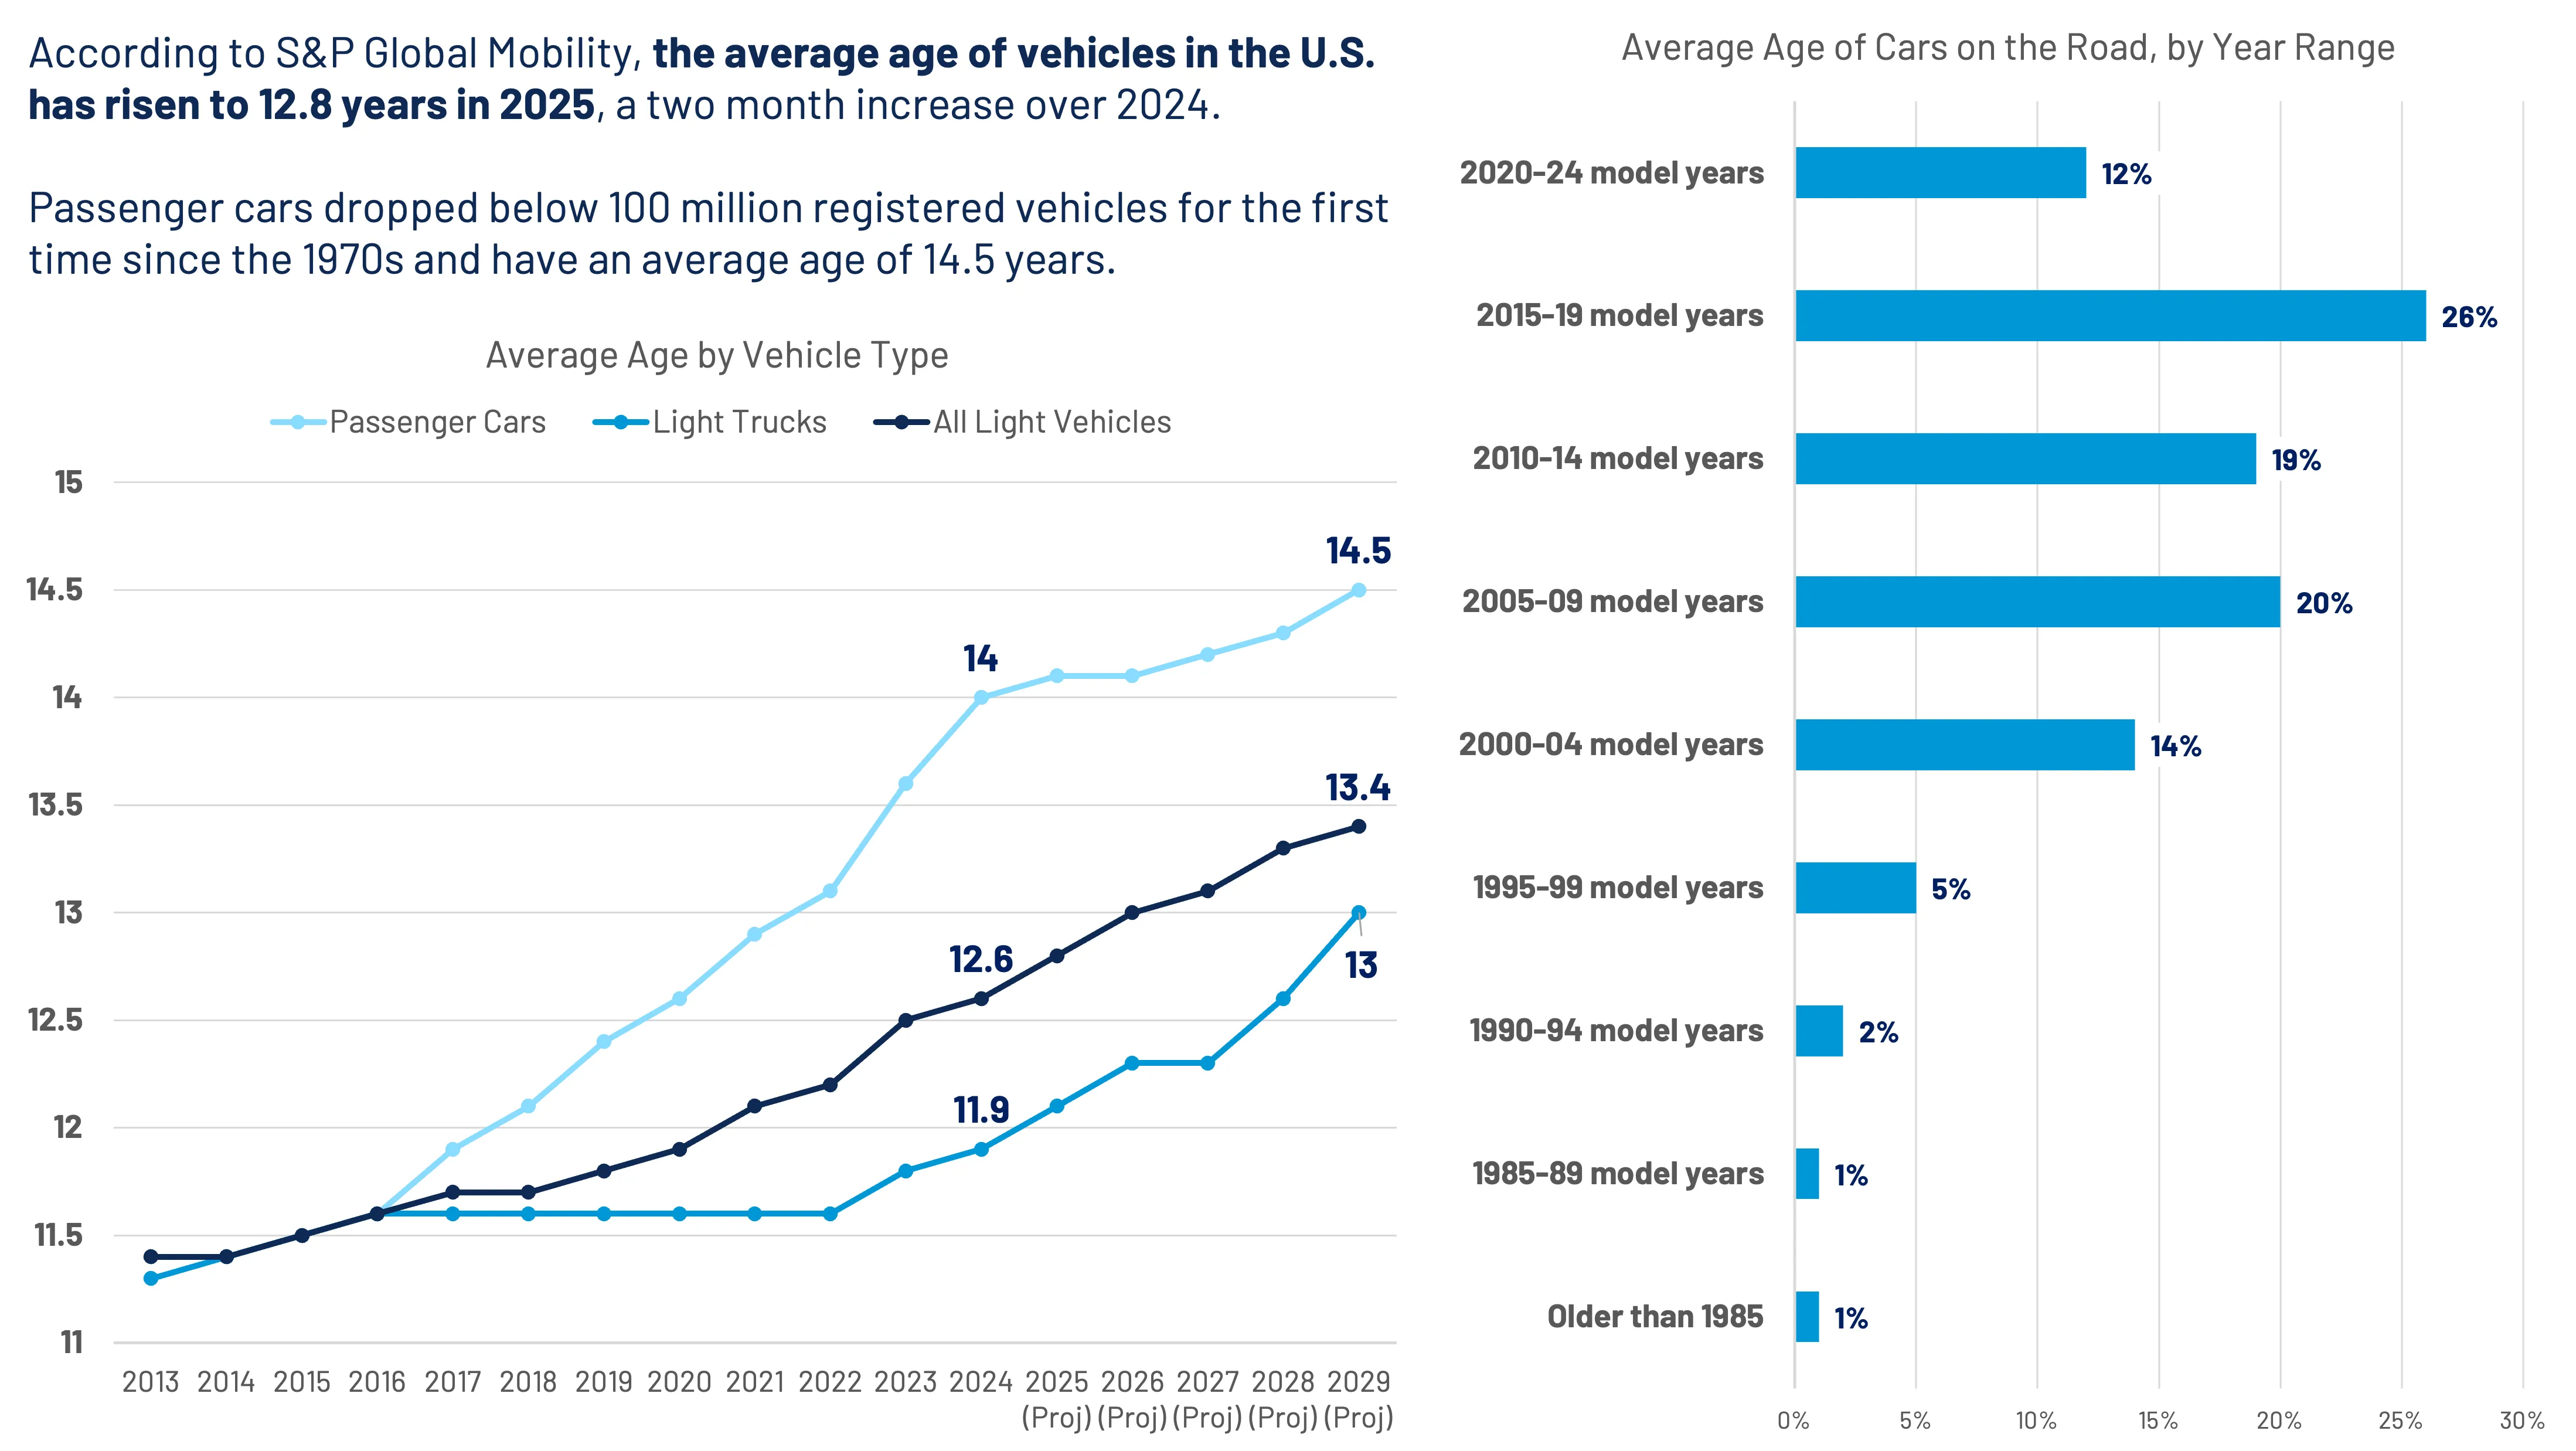
2025 saw the average age of light vehicles reach 12.8 years (S&P) and there is a strong likelihood that the U.S. will hit the 13-year mark in 2026. Not only is the age mix of vehicles shifting, so, too, is the composition of vehicles on America’s roads, as production and preferences lean away from passenger cars and towards light trucks and sport utility vehicles. (Figure 29)
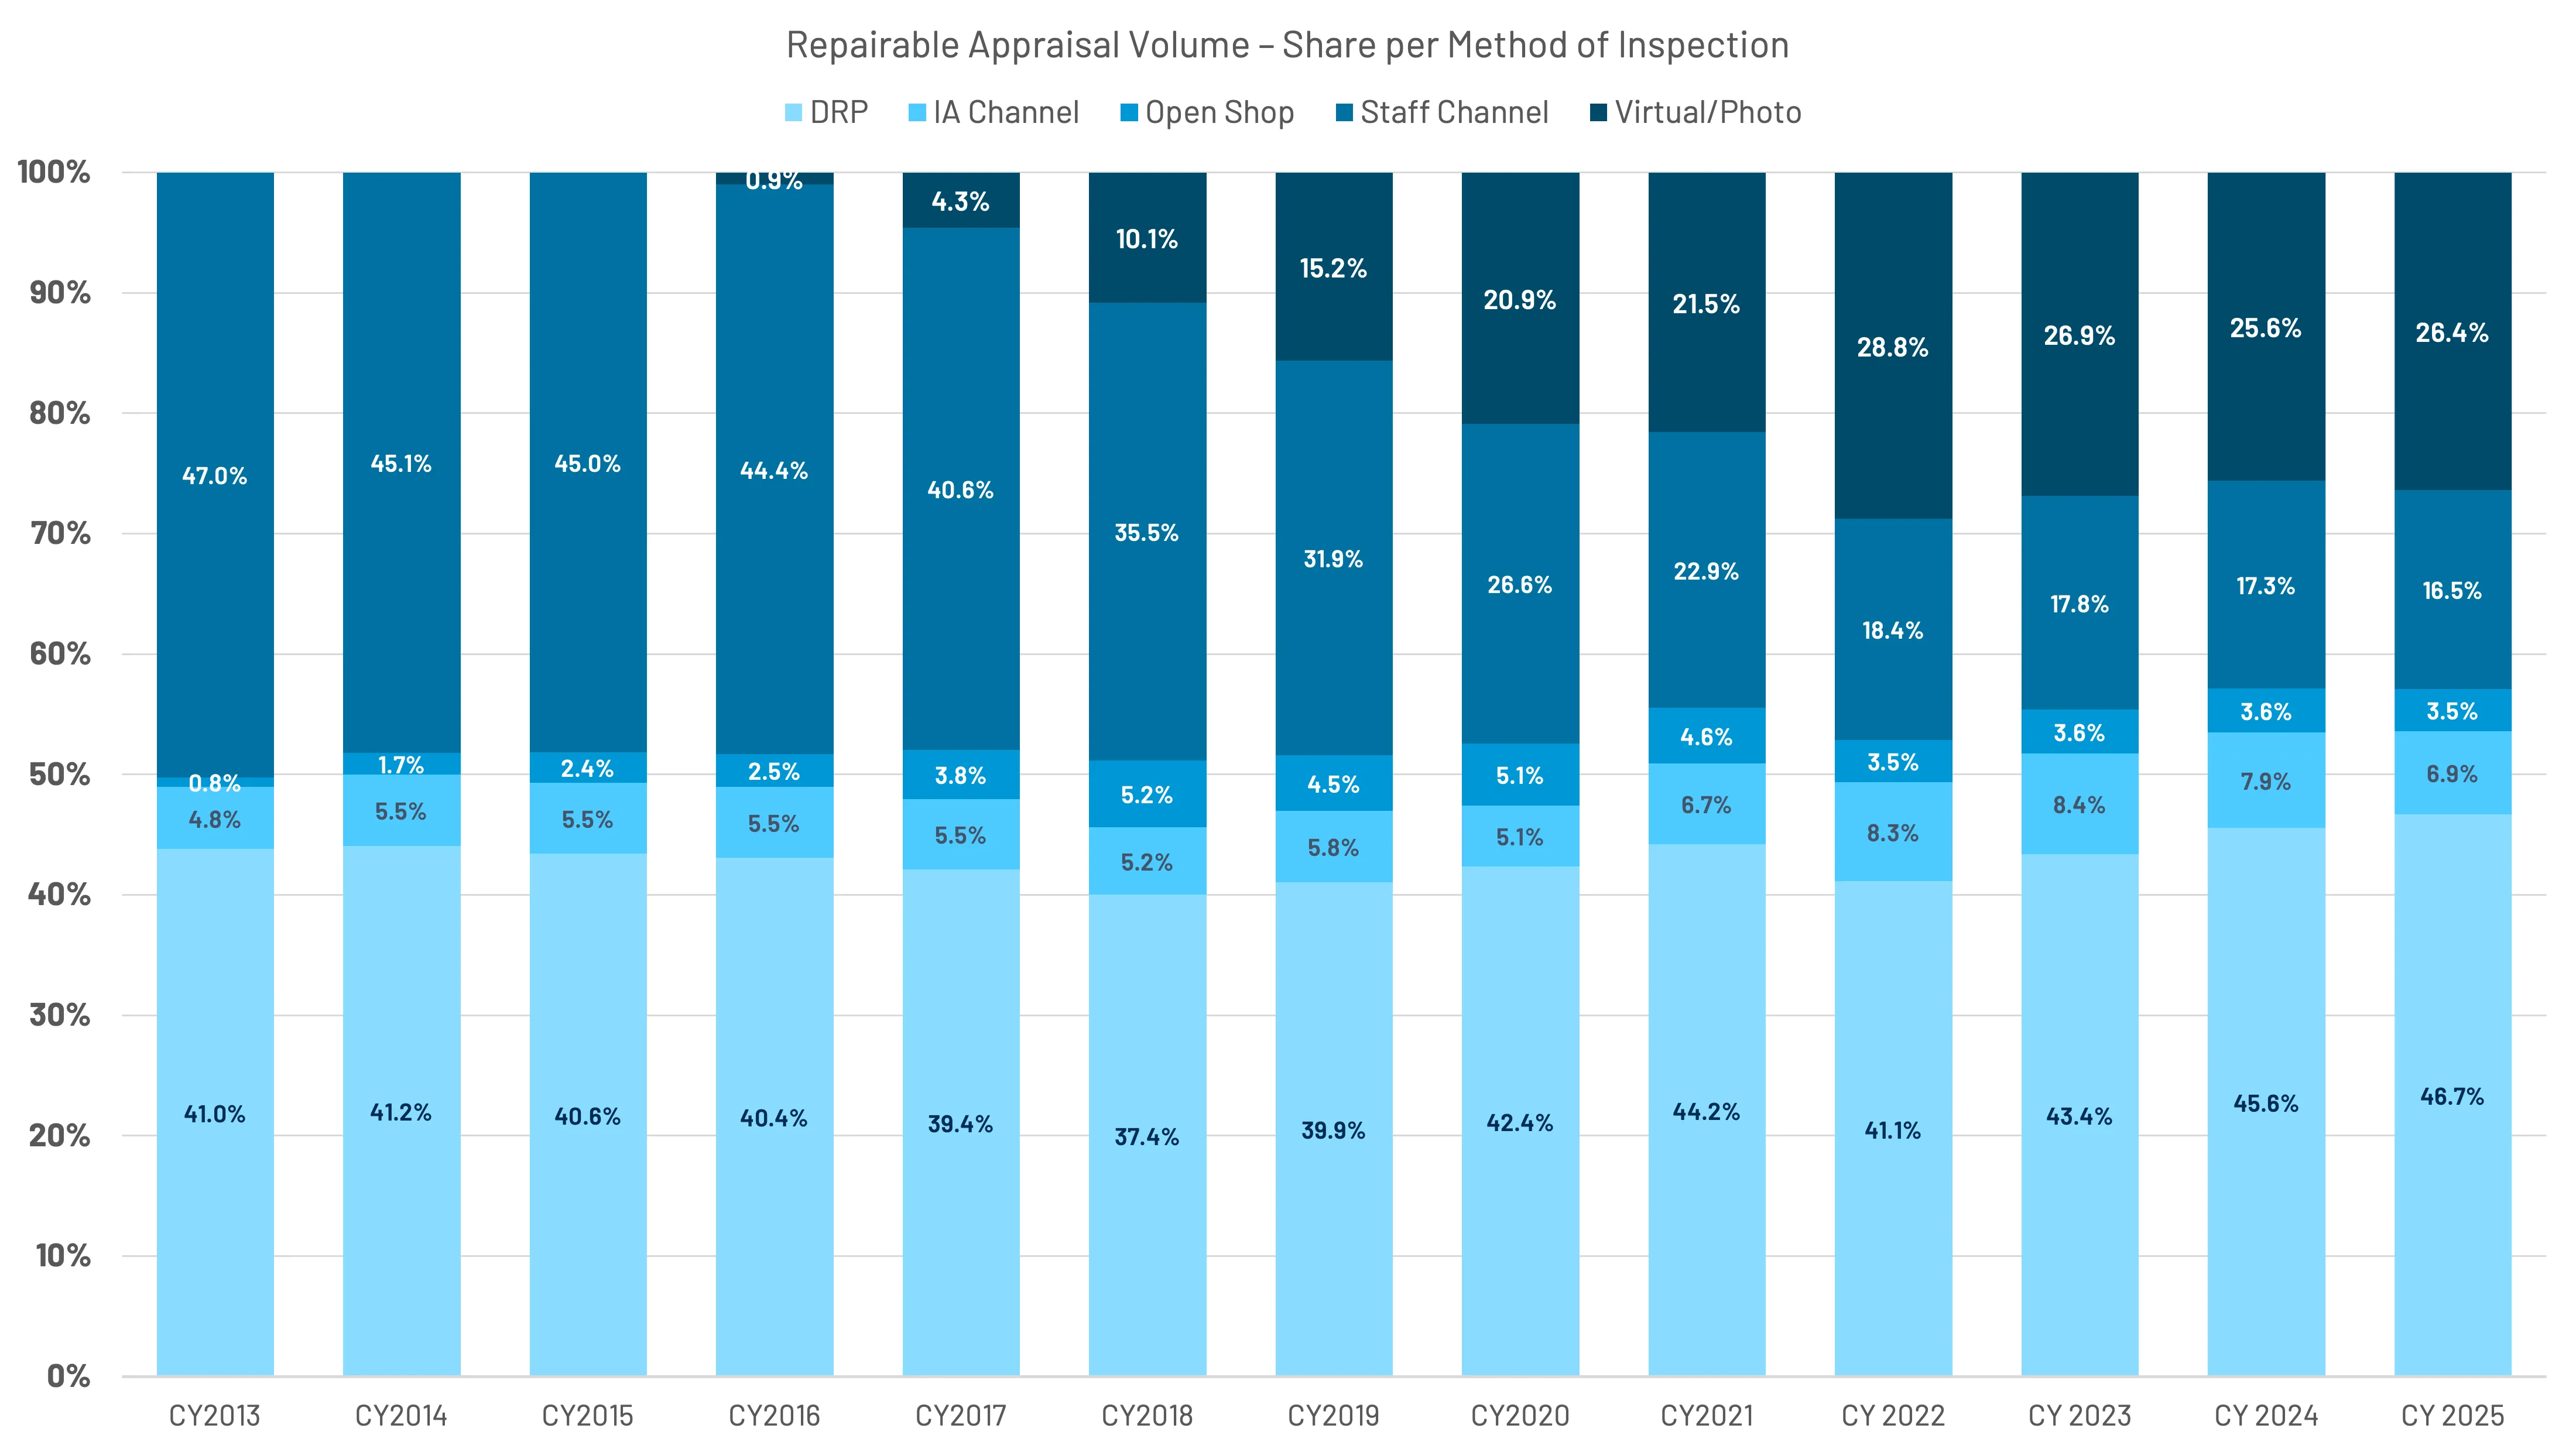
Method of inspection amongst repairable claims continued to shift towards DRP and photo-estimating solutions, with DRP now accounting for 46.7% (+1.1 pp) and photo representing 26.4% (+0.8 pp) in 2025. The independent appraiser (IA) channel saw a 1-point decrease in 2025, while the staff channel decreased by 0.8 points to 16.5%. (Figure 30) It should be noted that staff appraisers account for the largest share of estimates flagged total loss, followed by photo and DRP.
DRP & Photo MOIs Continue to Gain Share
Repairable claim volume declined by 9.7% in 2025 (all coverages), while non-comprehensive volume was -8% for the year. Preliminary average total cost of repairs (TCOR) is $4,818 for 2025, an increase of 1.7% over 2024, representing the lowest percentage increase since 2017. (Figure 31)
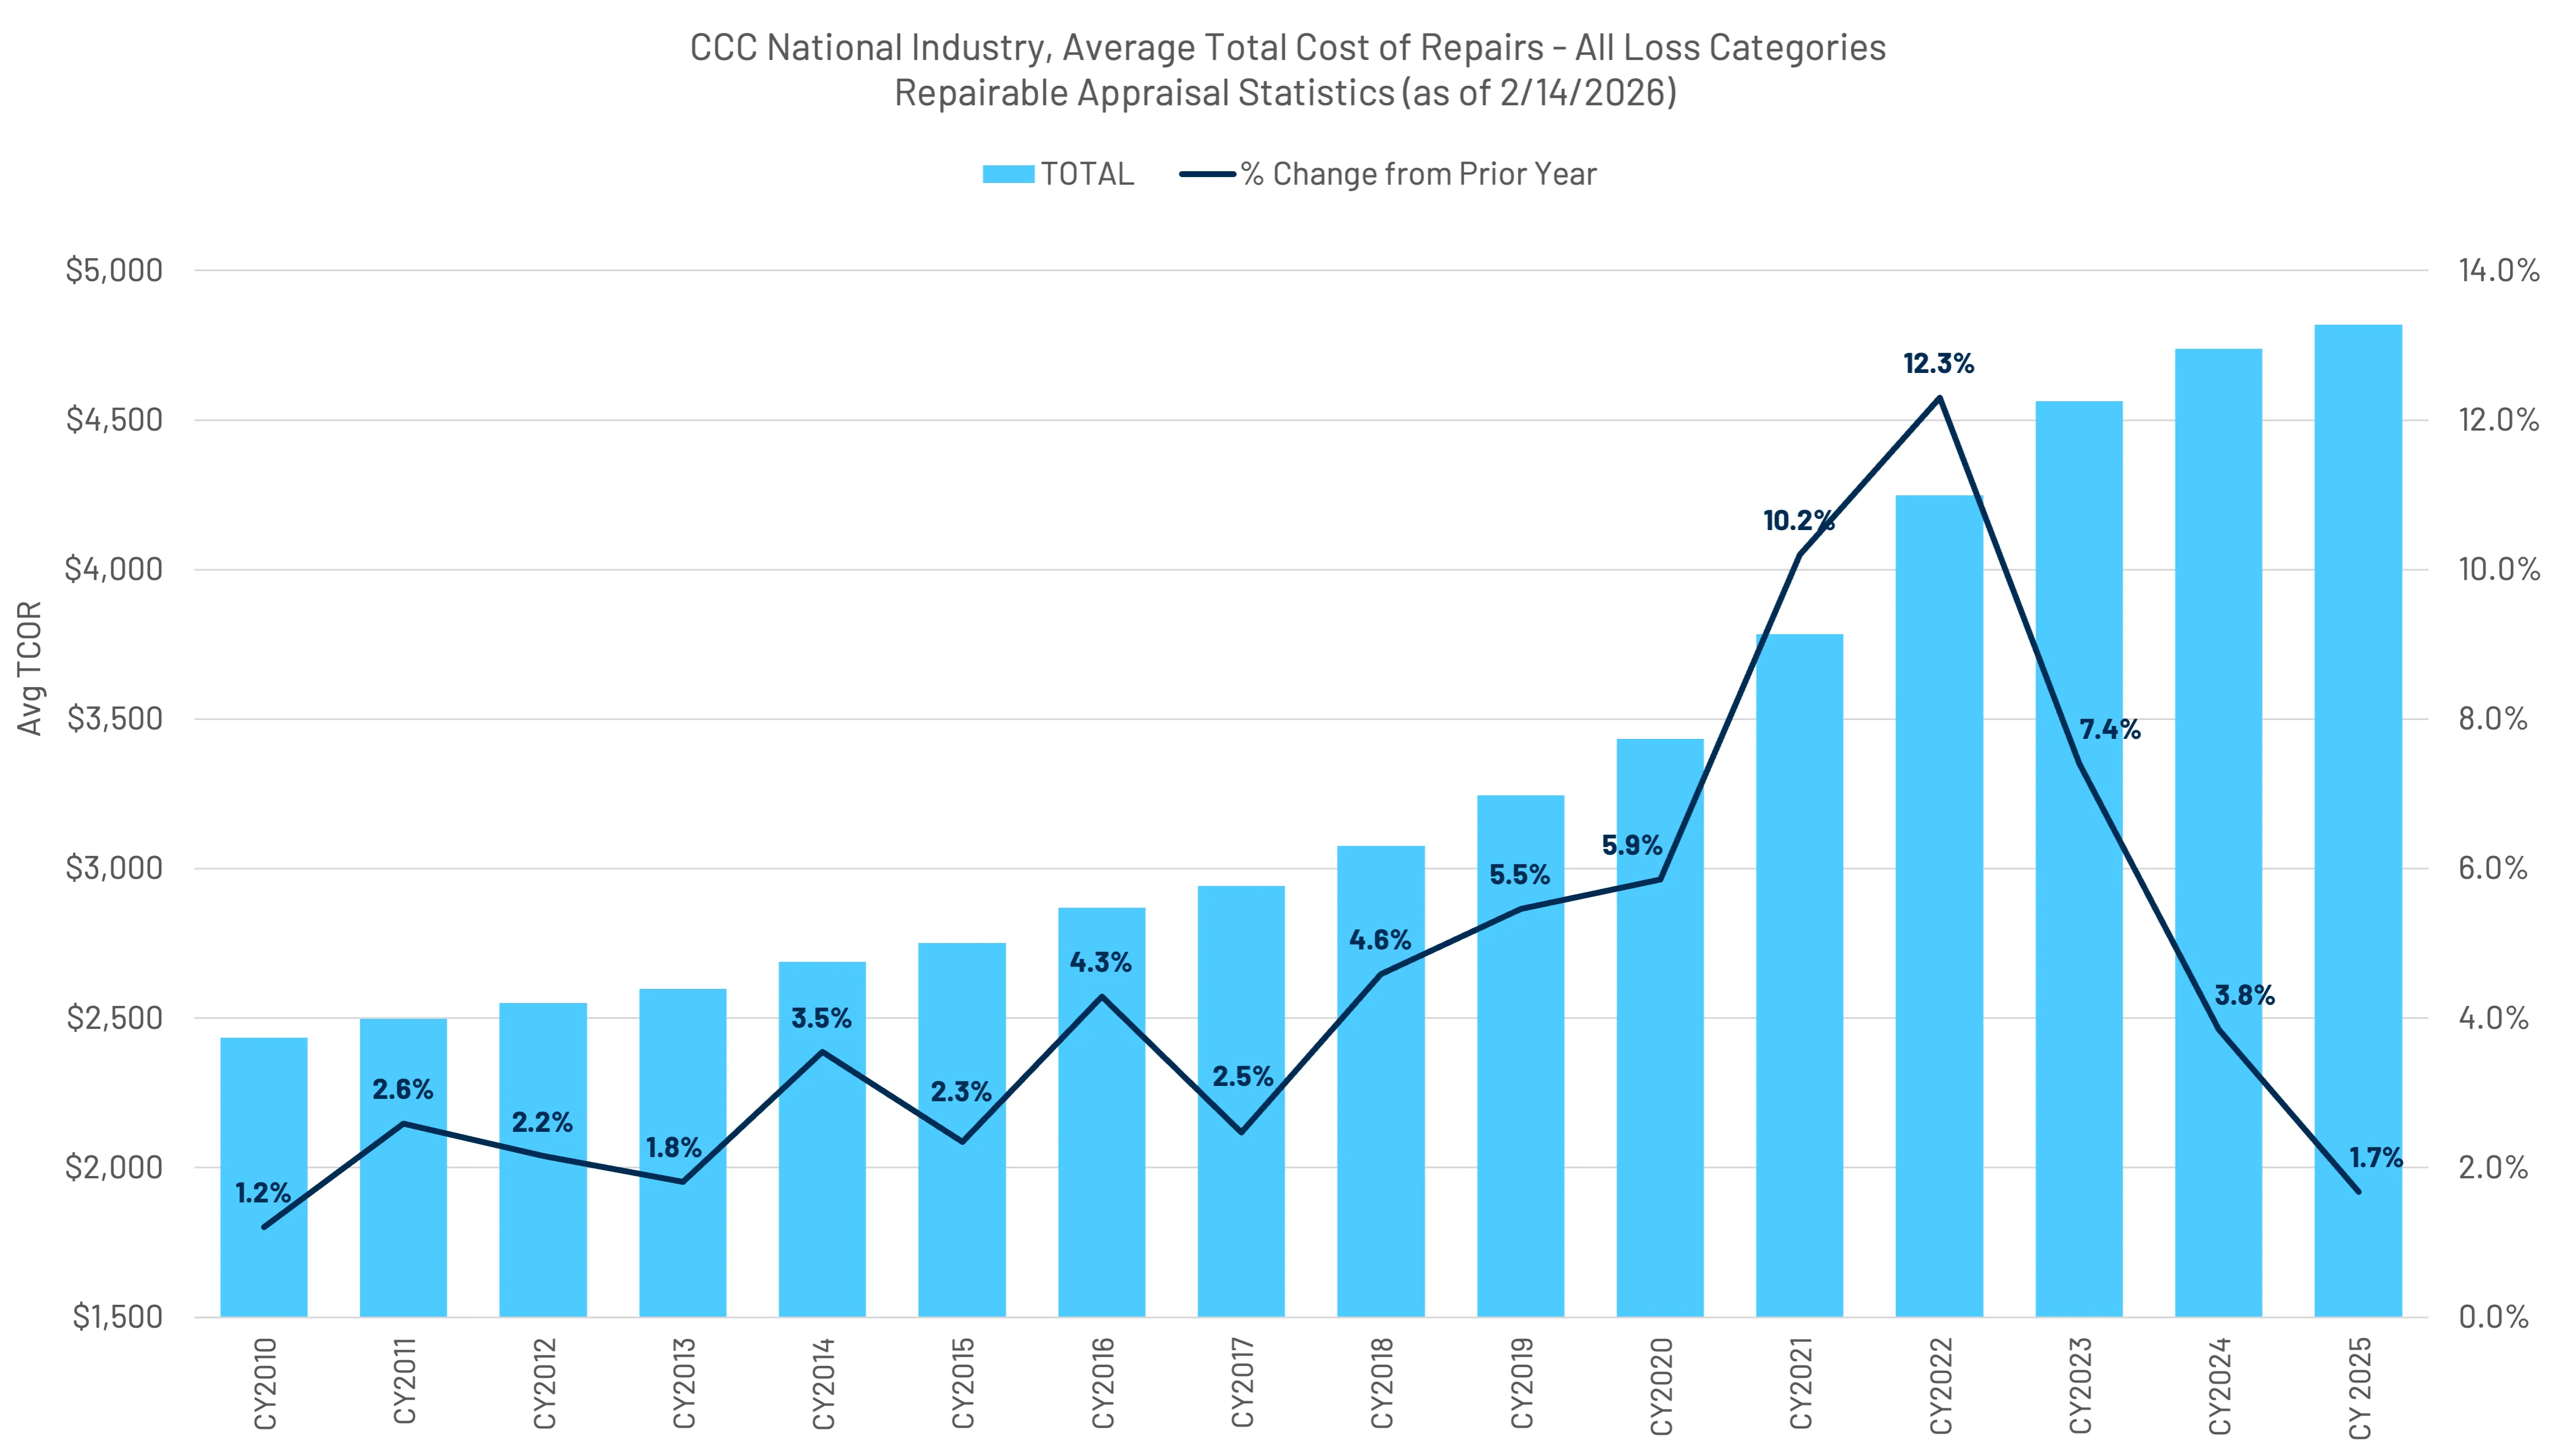
The modest shift in average TCOR was primarily driven by the increase in total part dollars and miscellaneous costs, which often include sublet items, such as diagnostics.
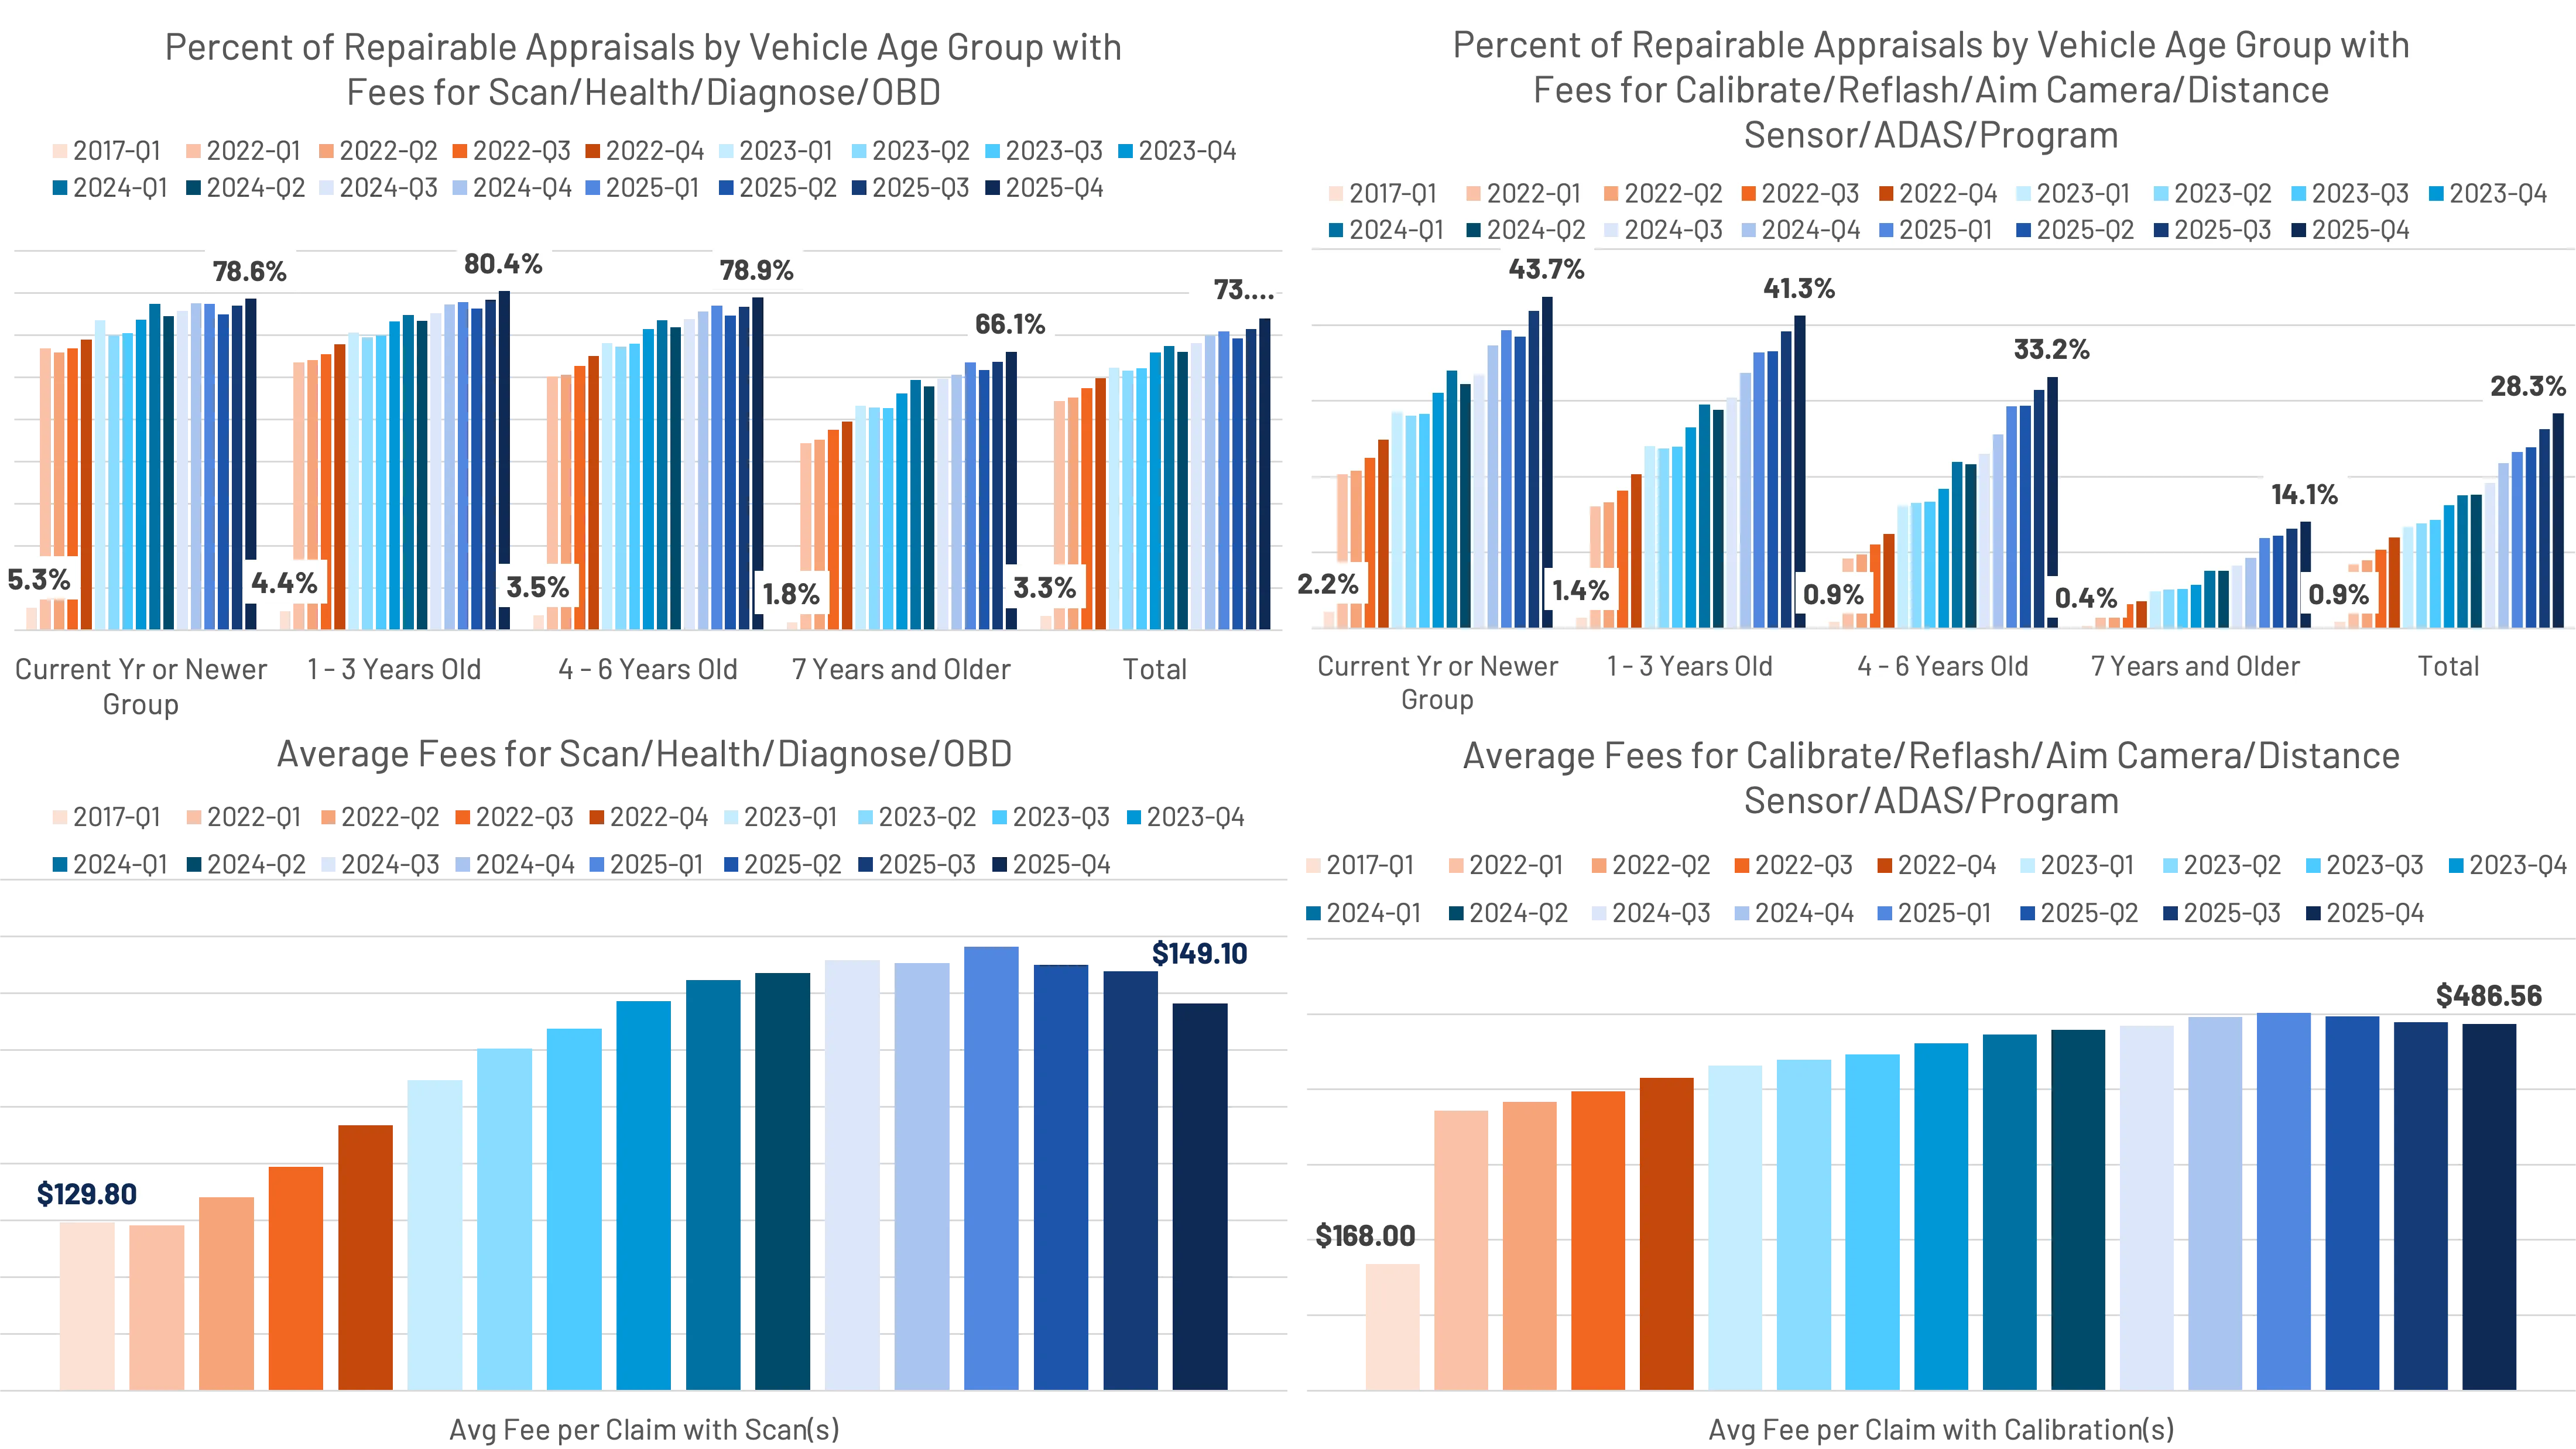
Across all repairable claims, calibrations saw an almost 6.5 percentage point increase, from 21.8% to 28.3% for the year. This equates to a 30% increase in the number of repairable estimates where a calibration was present. (Figure 32)
Non-paint labor dollars saw a slight decrease in overall contribution to cost increases. (Figure 33)
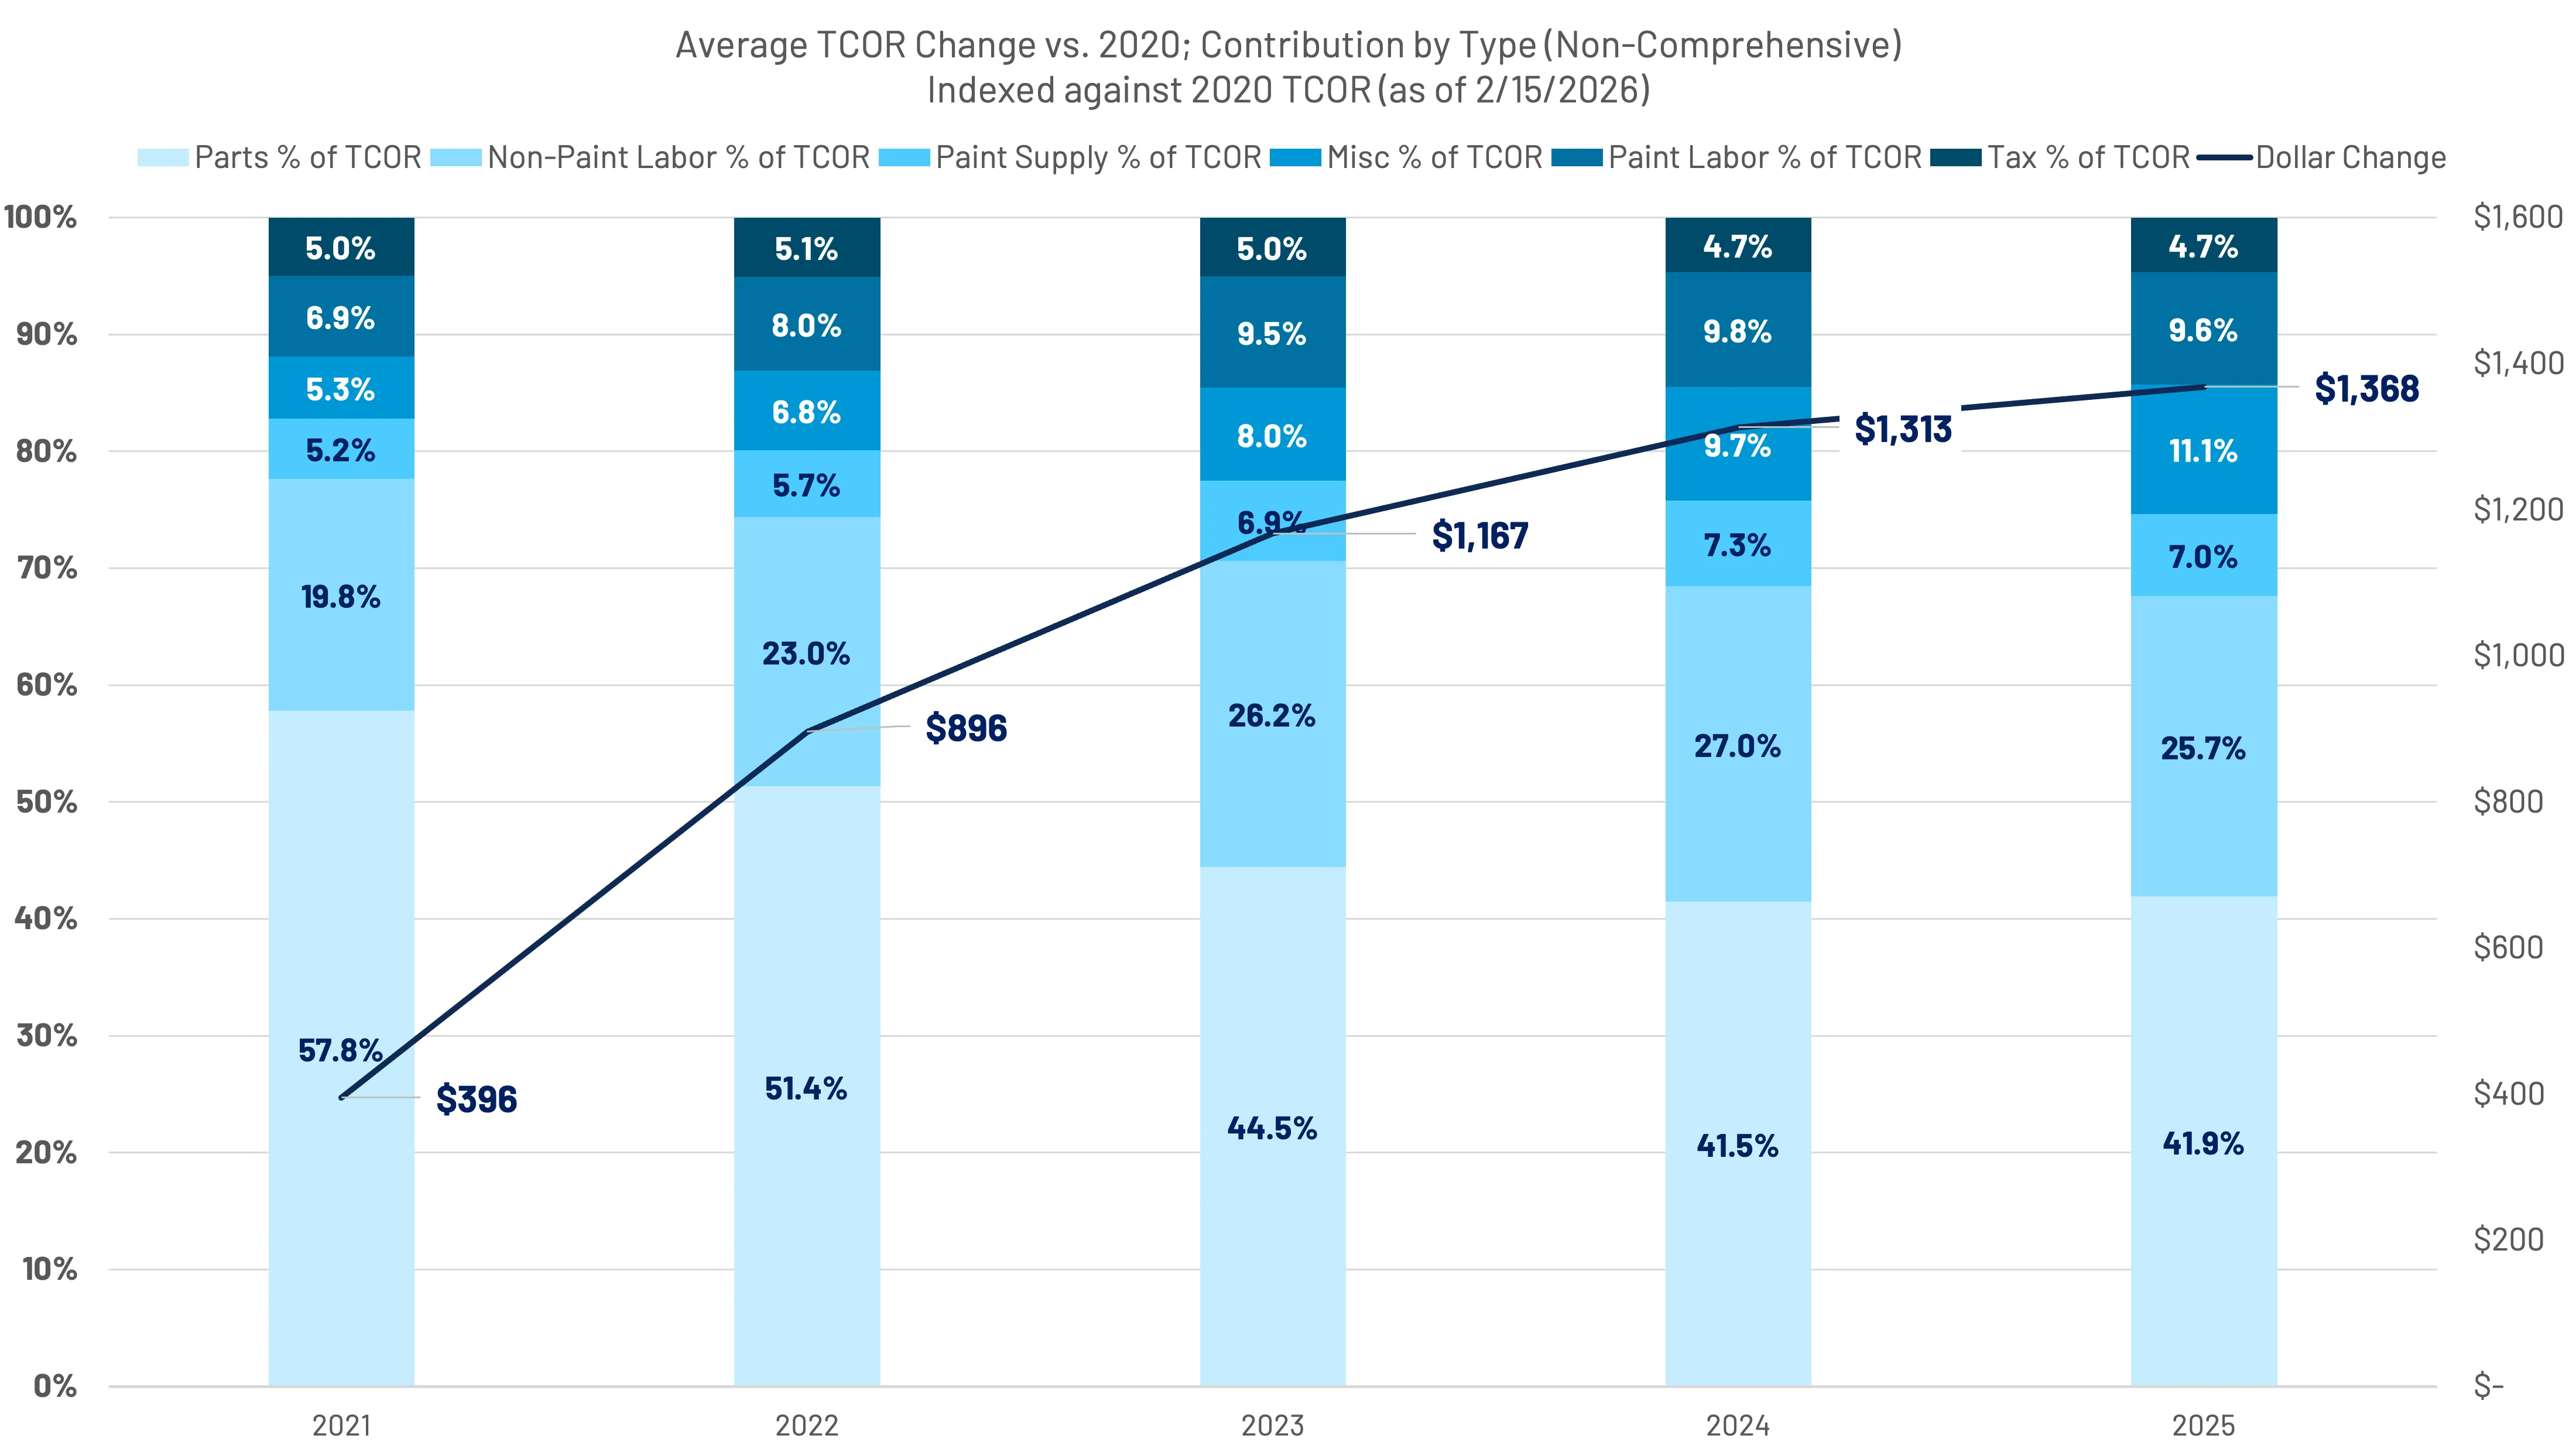
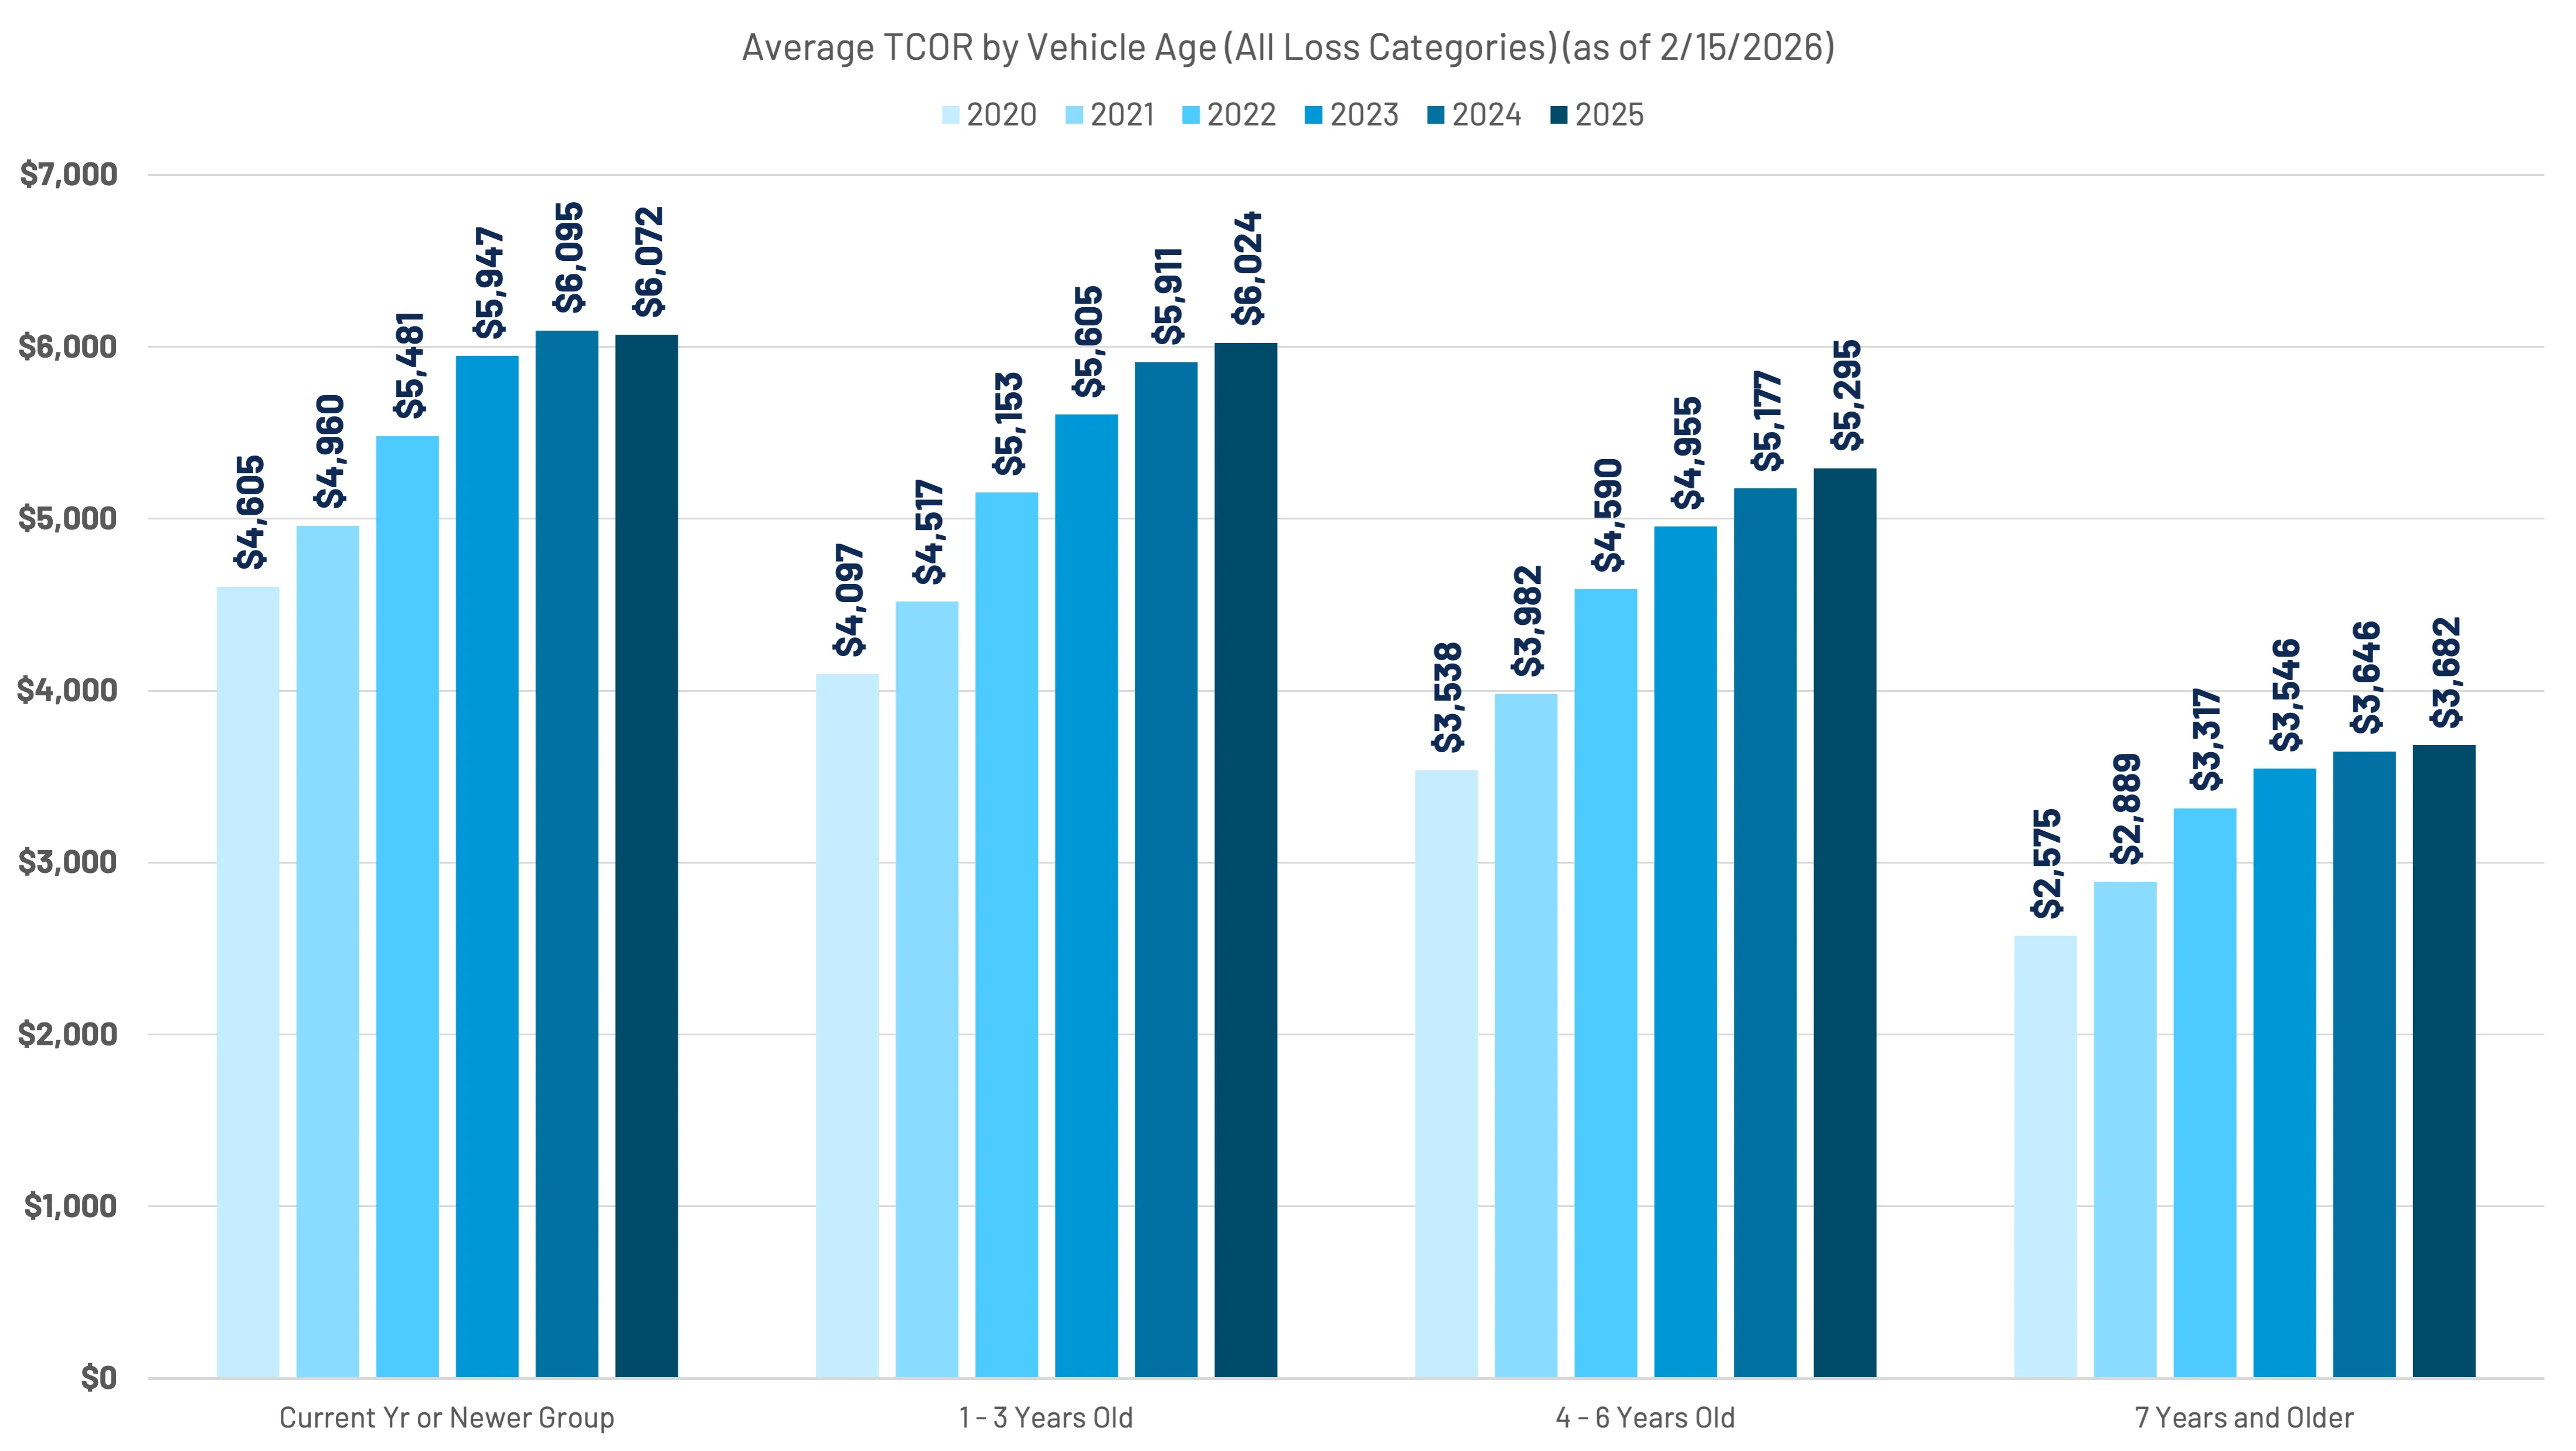
The following views provide increased fidelity around TCOR. The average TCOR for vehicles 6 years old or newer is $5,721. This is $2,039 (+55.4%) more on average than vehicles 7 years or older. While the industry average TCOR increase was +1.7%, the year-over-year variance deviated only slightly by age group. Vehicles 7 years or older was ~+1%; 4-6 years old were +2.3%; 1-3 years old were +1.9%; and current year/newer were -0.4%. (Figure 34)
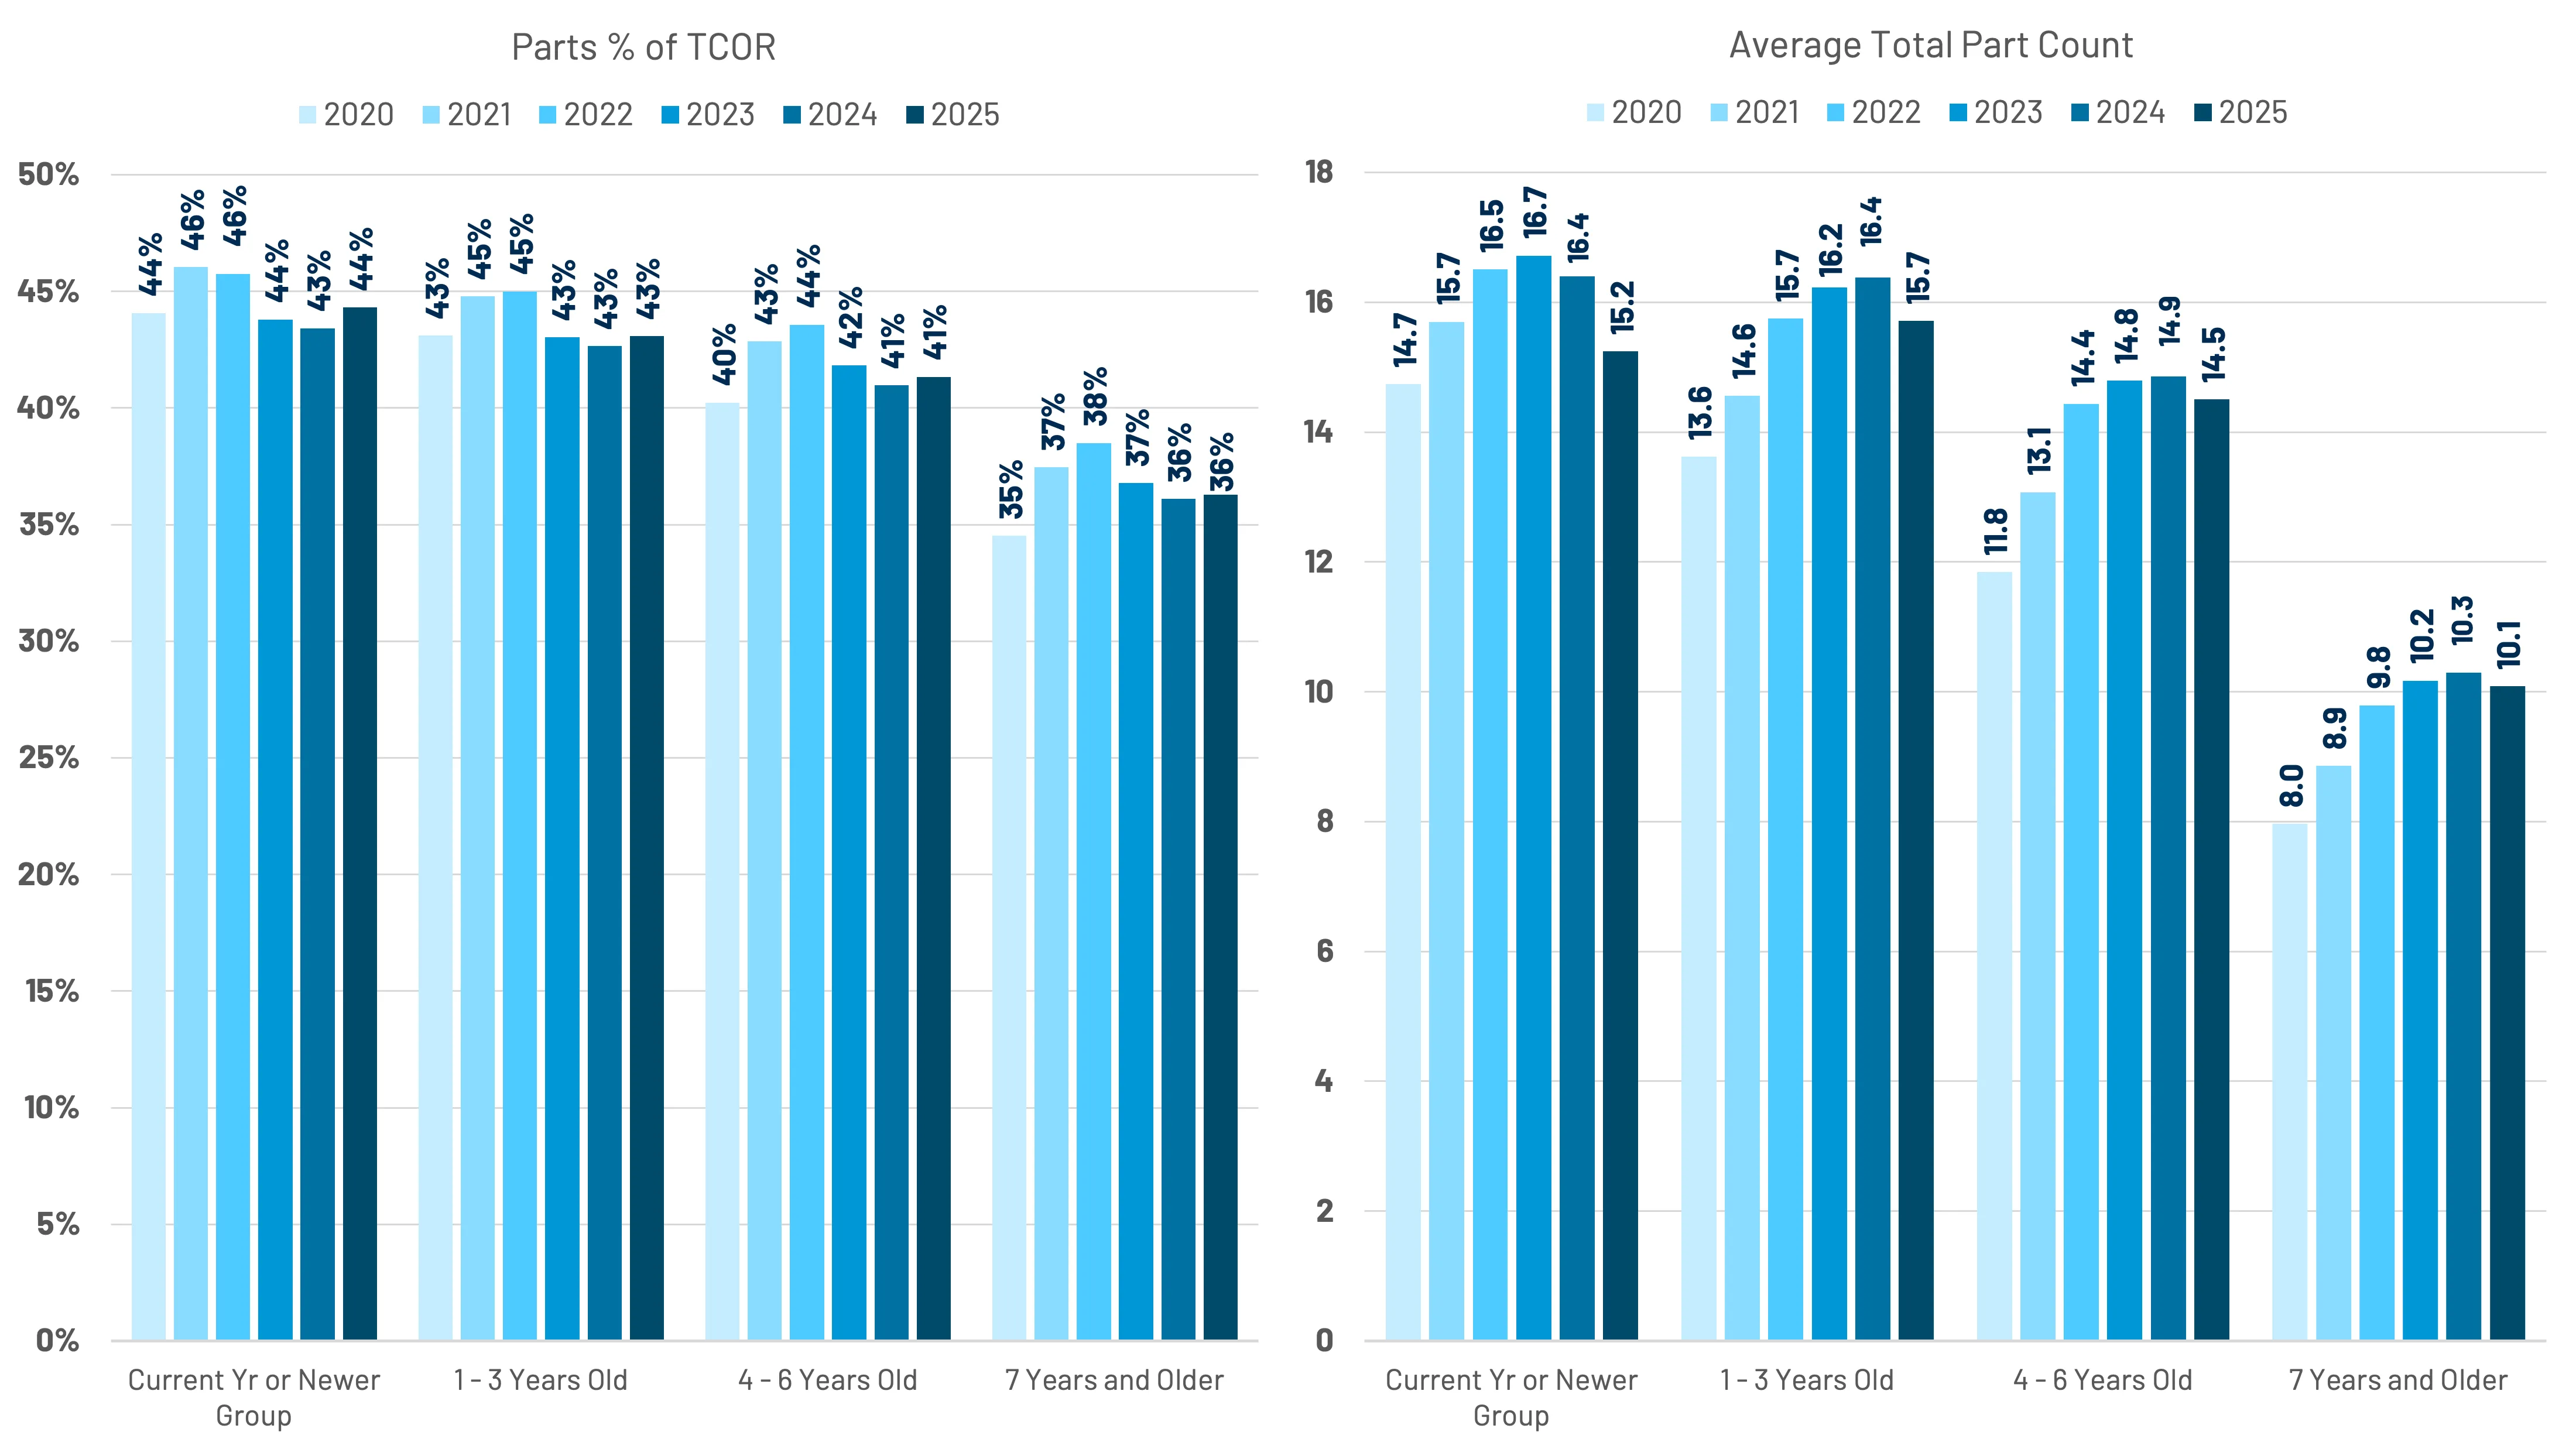
Part dollars, as a share of TCOR, was up slightly year-over-year by vehicle age. (Figure 35) This is one of the more surprising statistics of 2025, as the expectations tended towards large increases are a result of tariffs. (More on this in section 5)
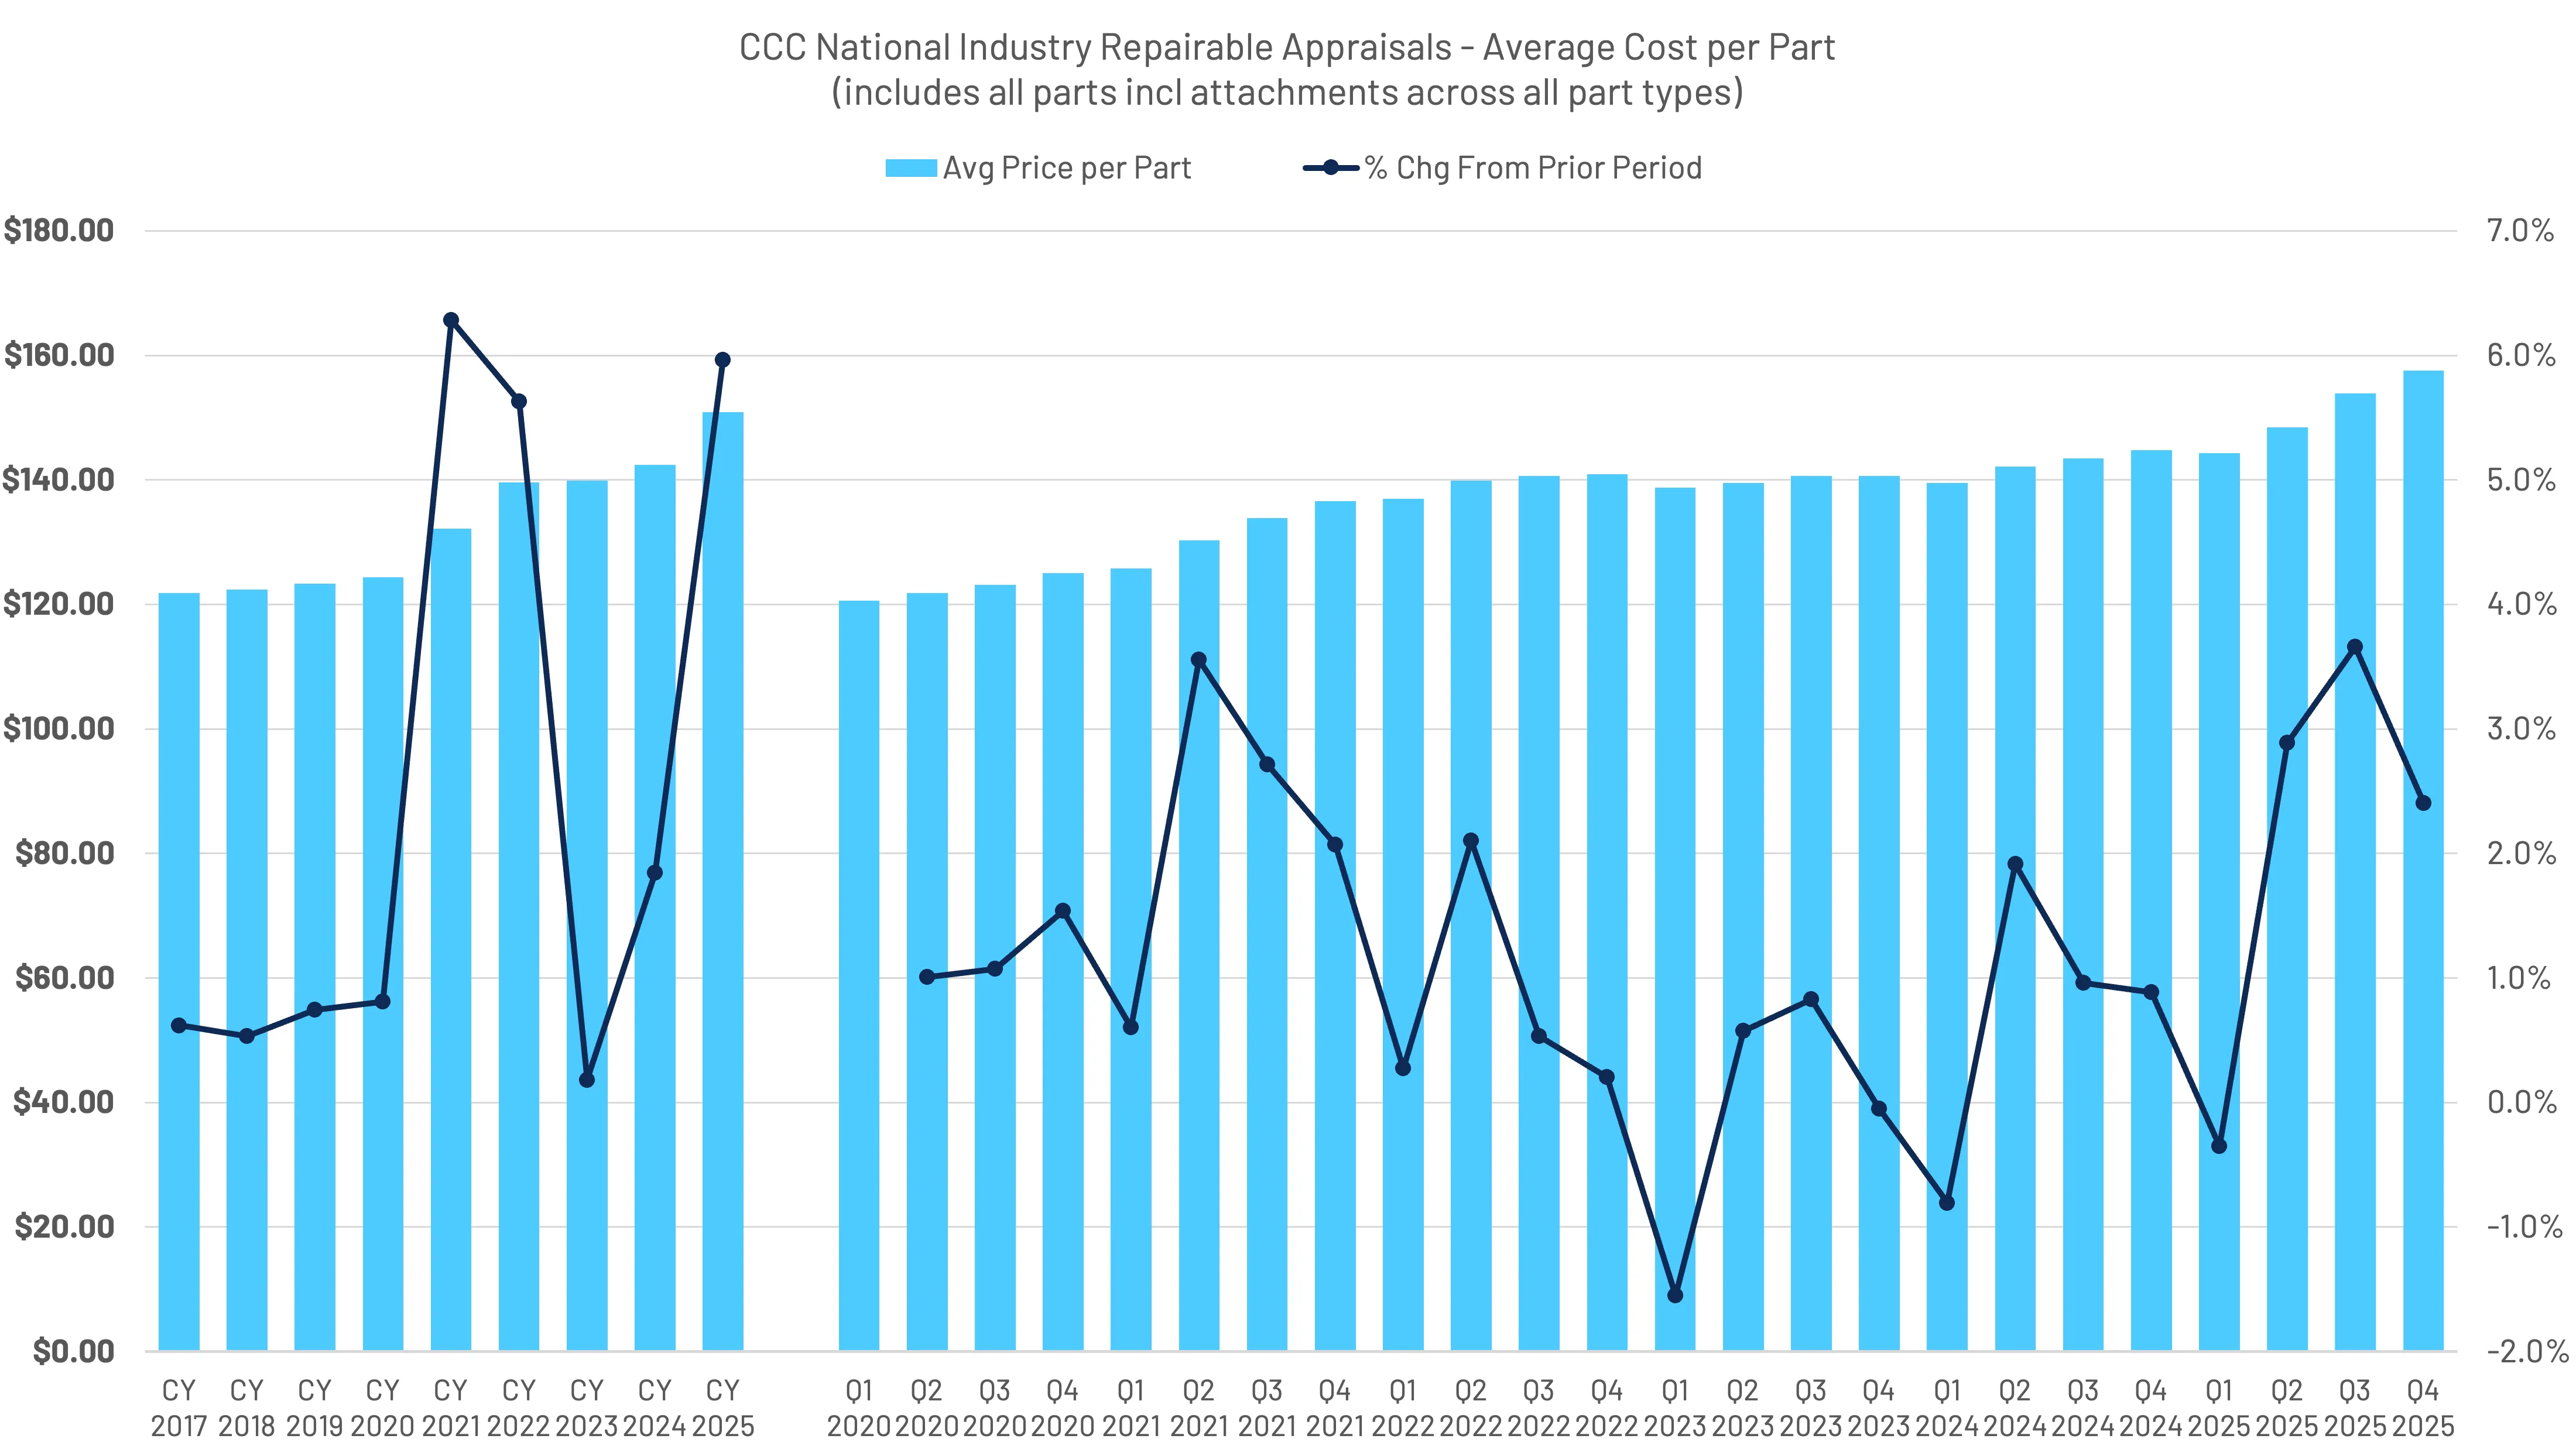
The average price per part was +6.0% in 2025, noticeably higher than increases in part dollars. This highly aggregated metric tells only one piece of the parts story. (Figure 36)
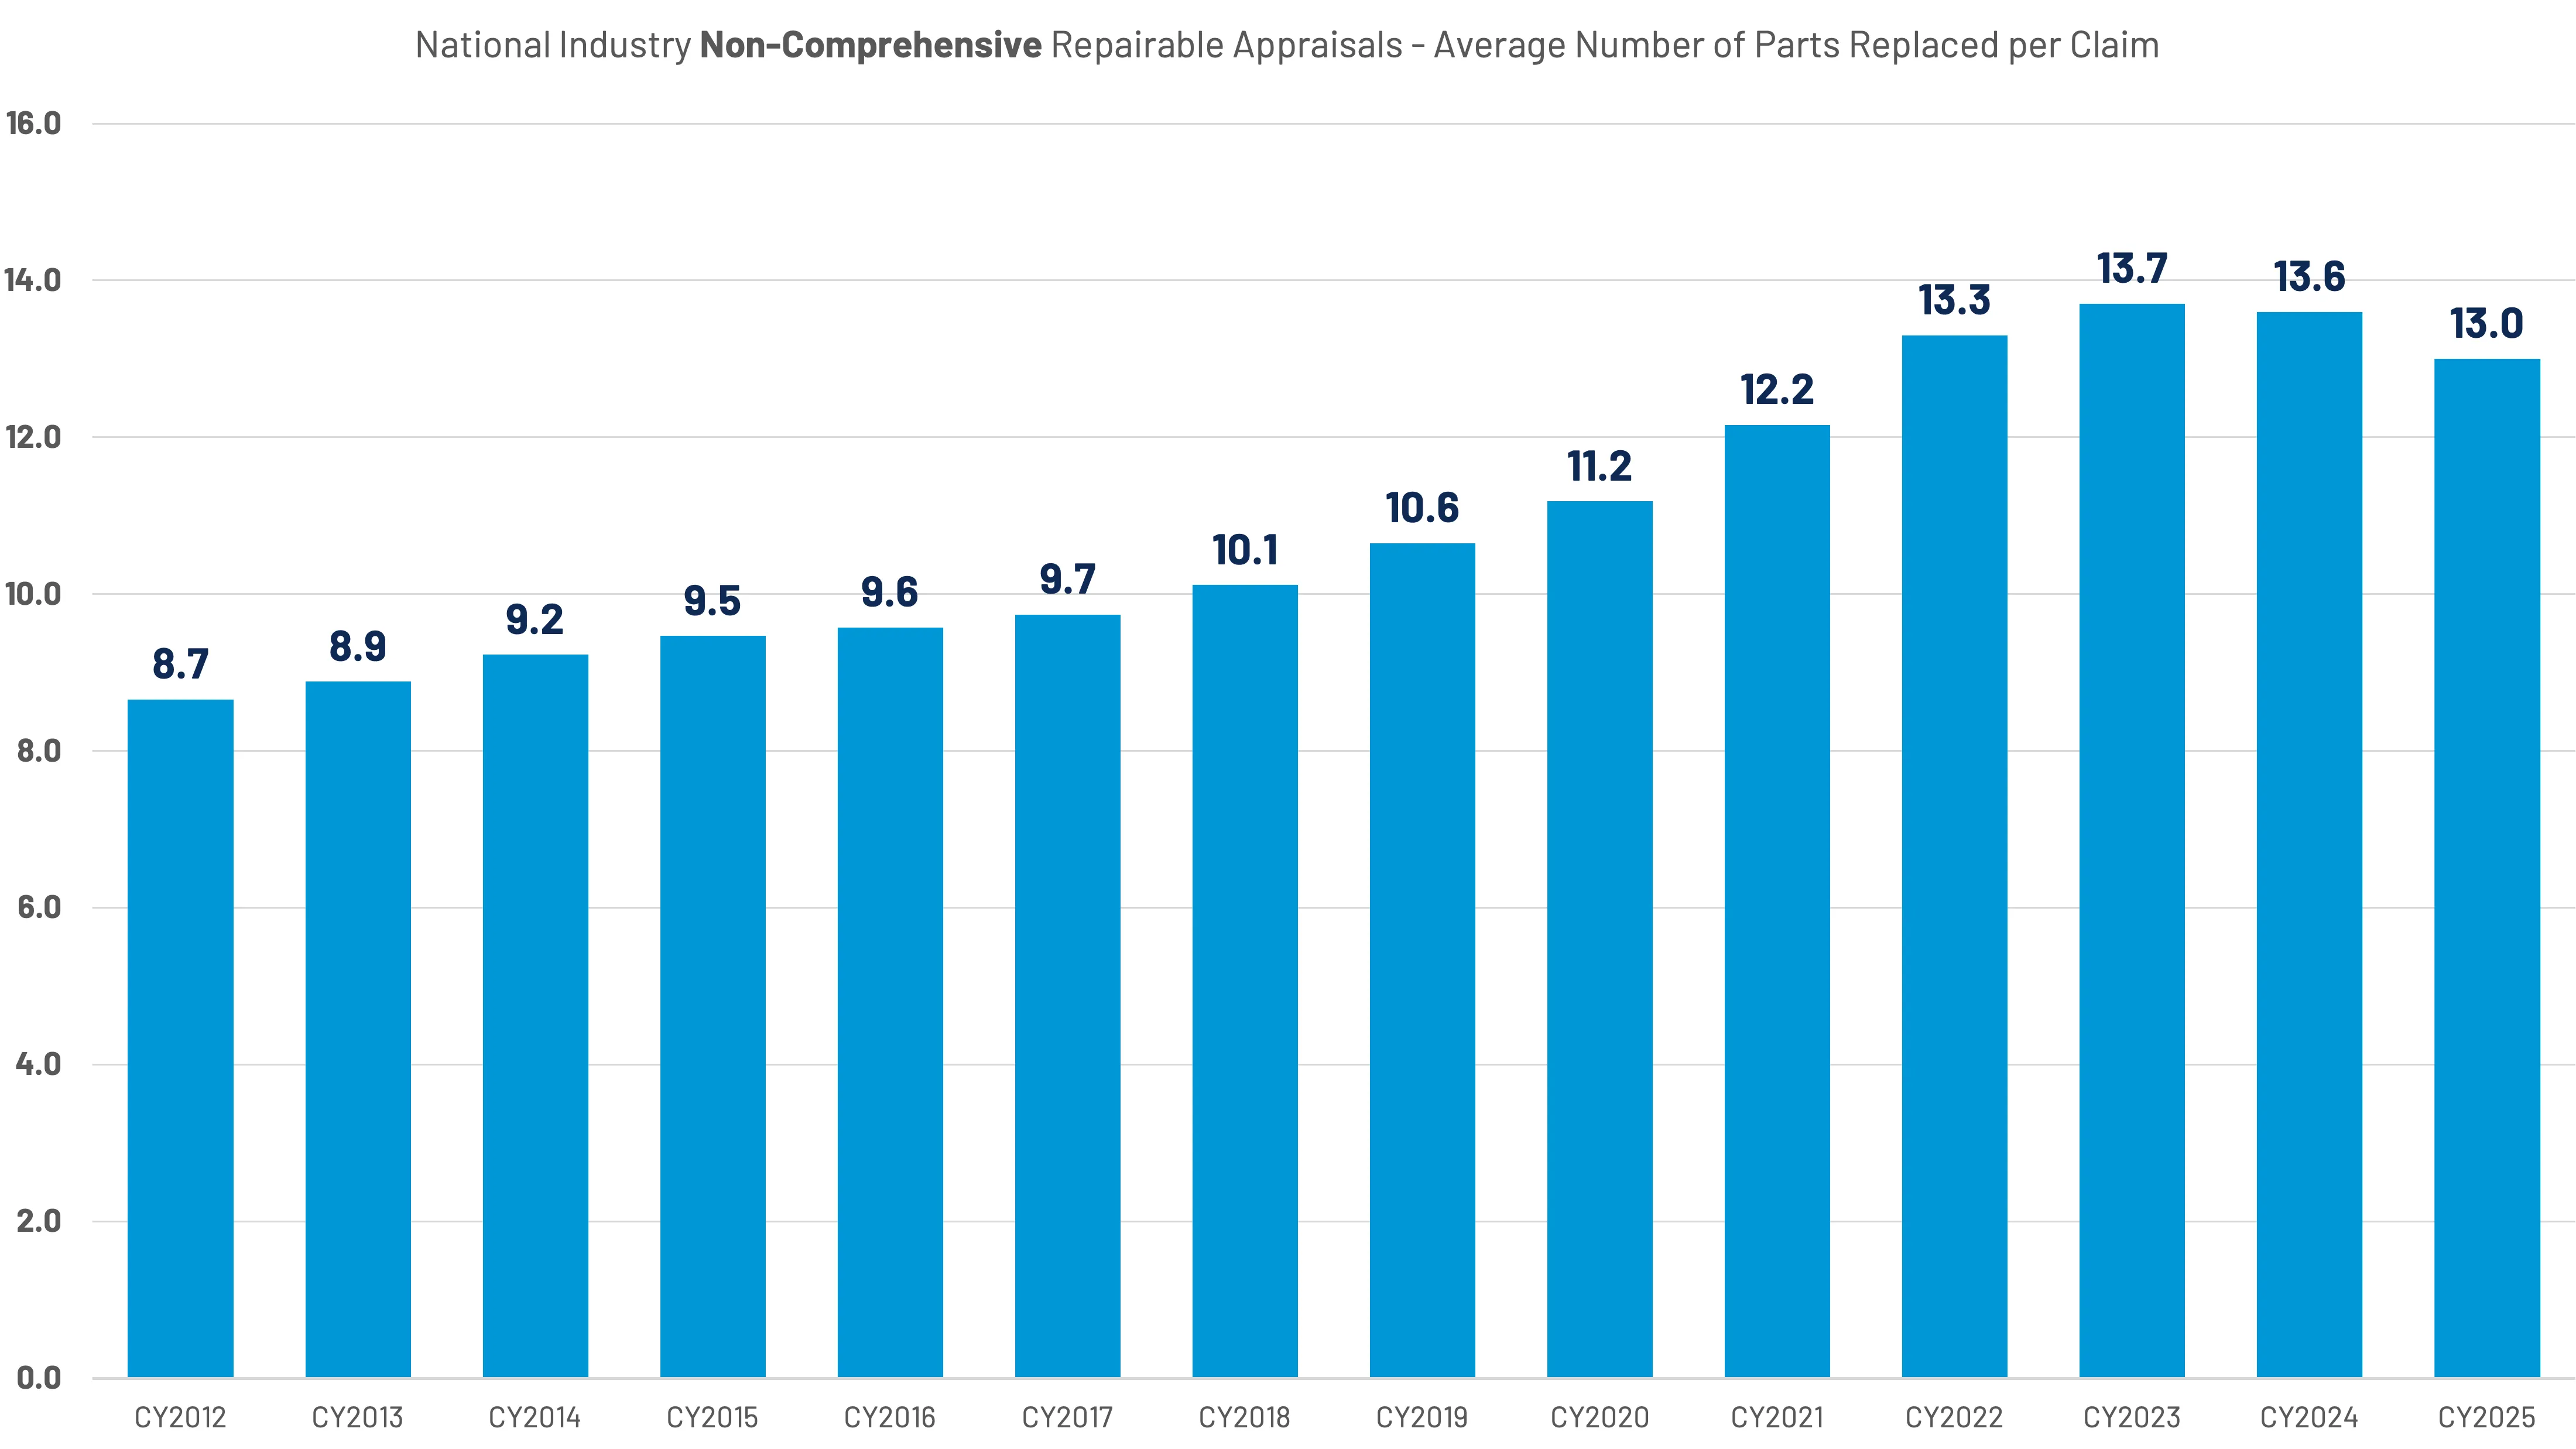
The increase in average price per part has been driven primarily by a noticeable decrease in the average number of parts per repair. For the year, the average number of parts per non-comprehensive repairable appraisal was 13.0, down from 13.6 in 2024 (and a peak of 13.7 in 2023). (Figure 37) The decline in average parts per repair has been consistent across vehicle age groups.
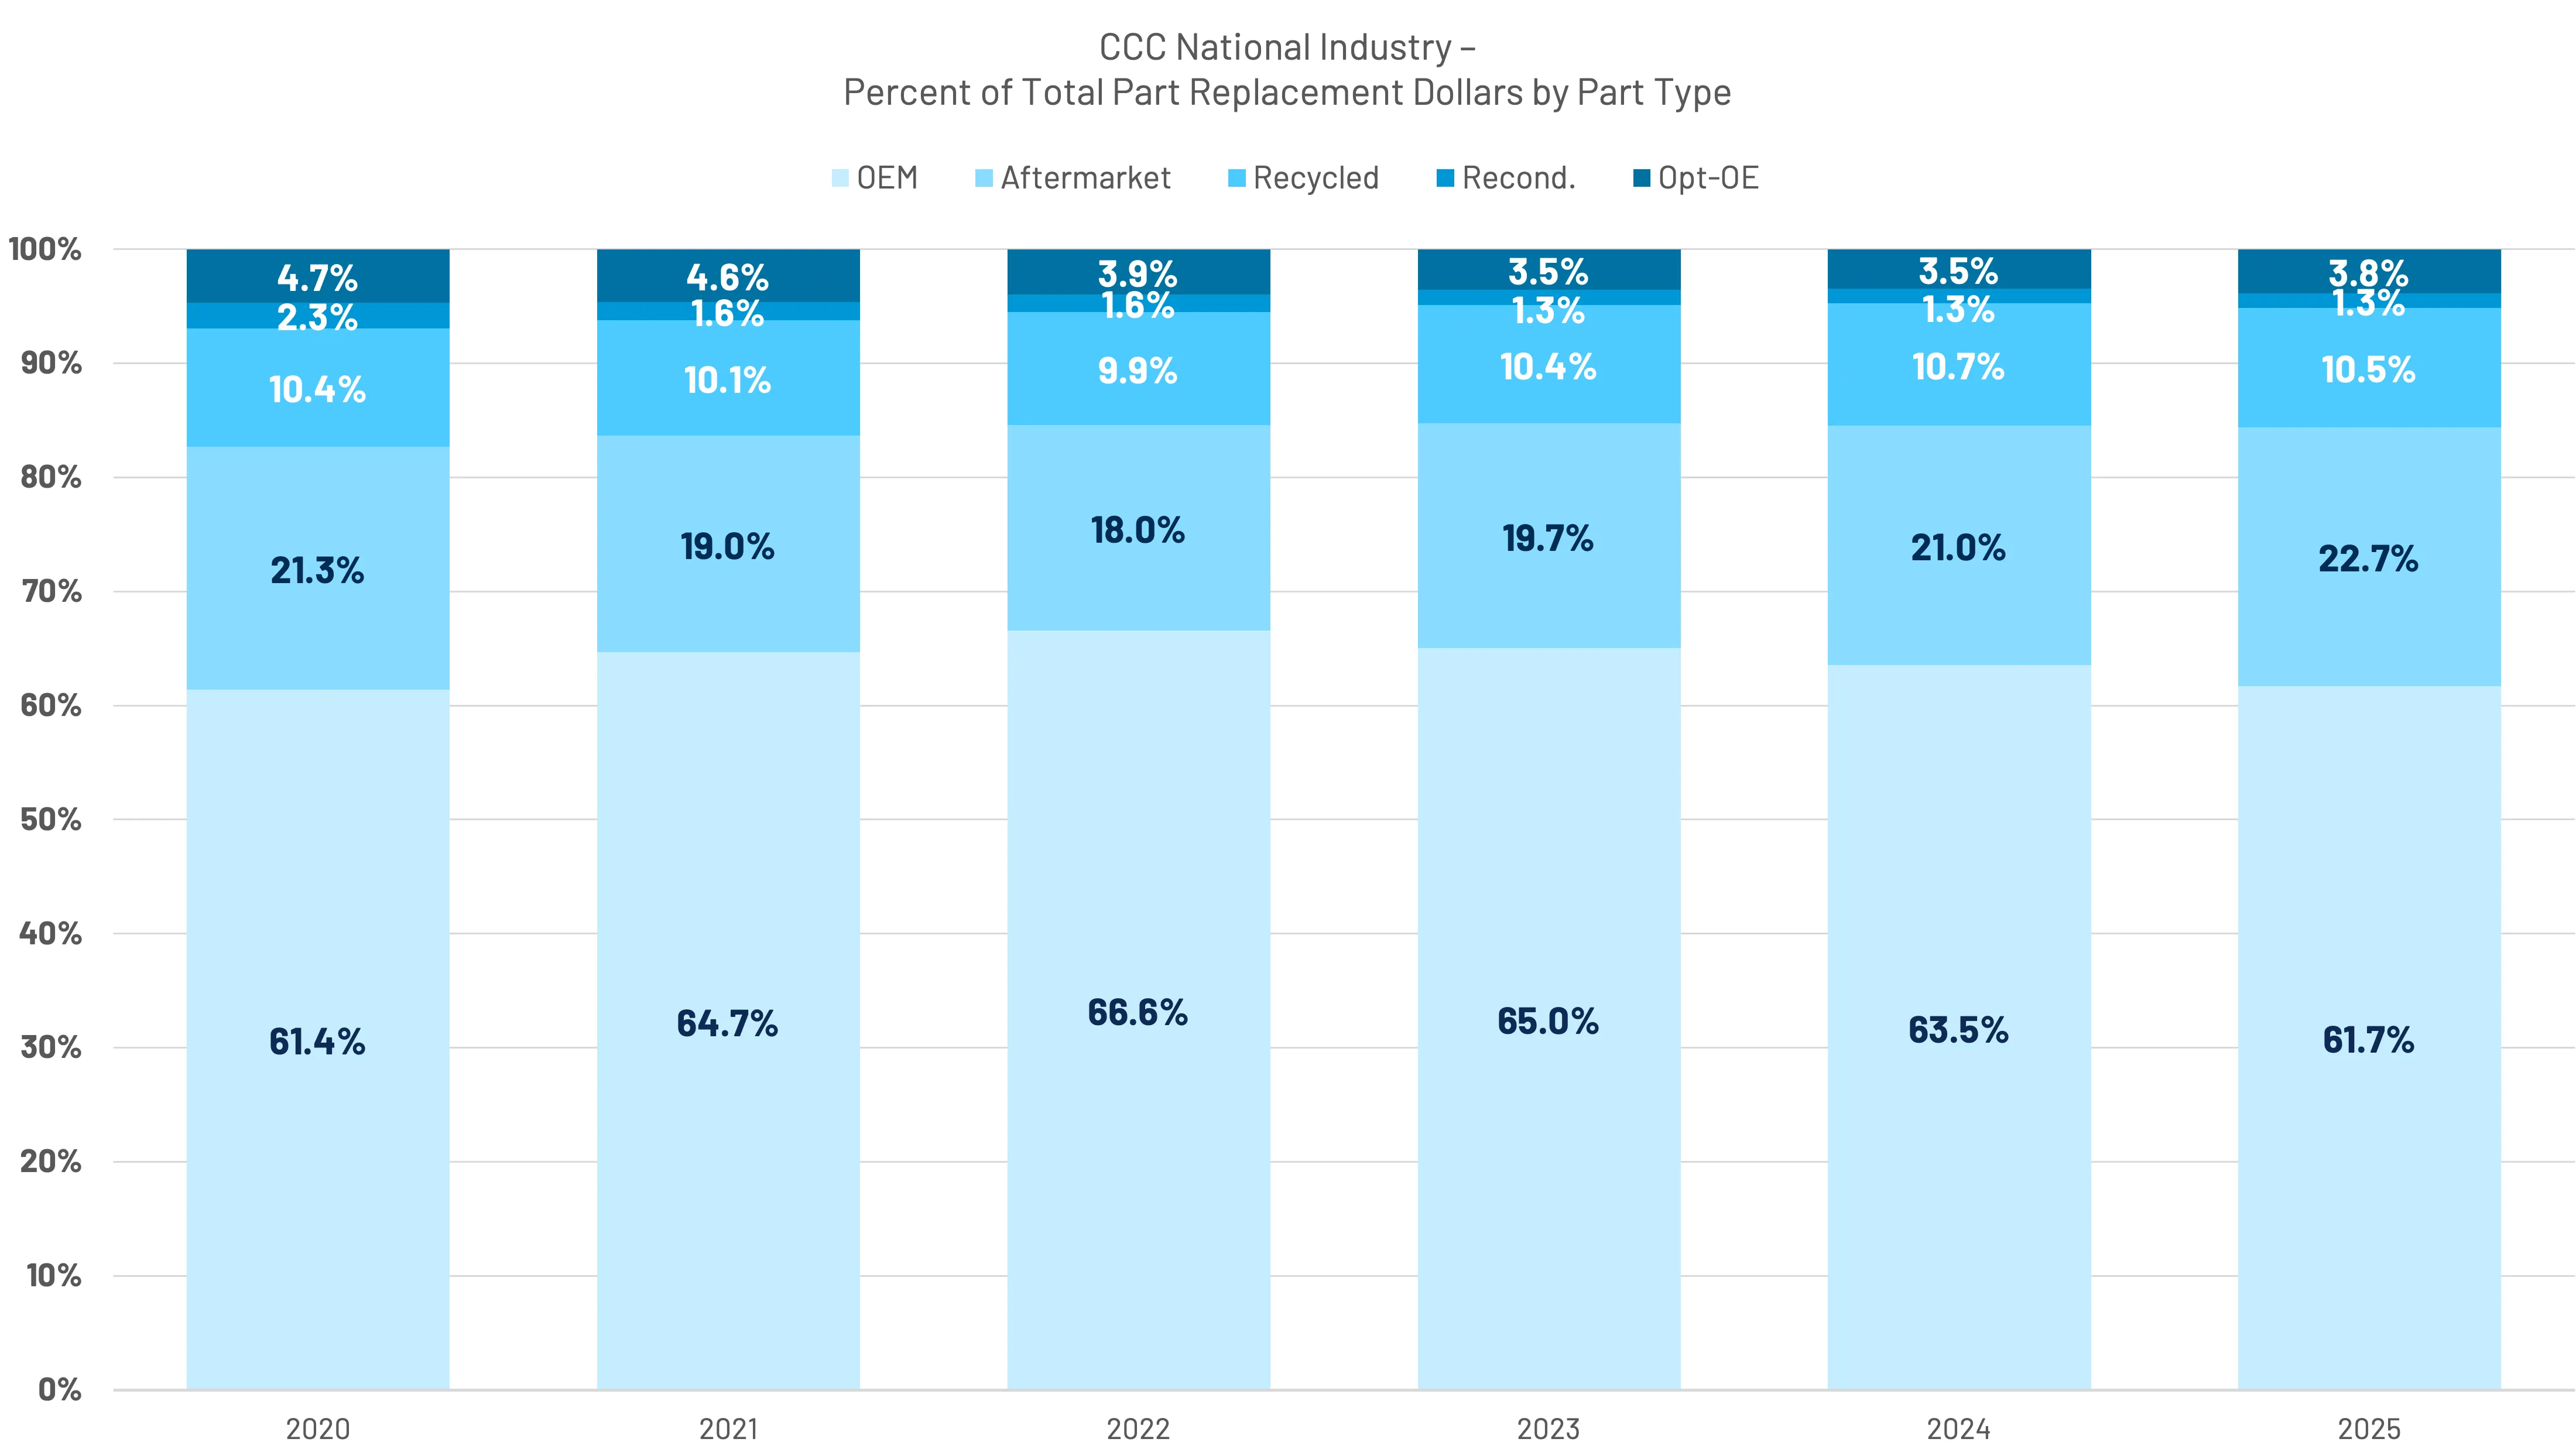
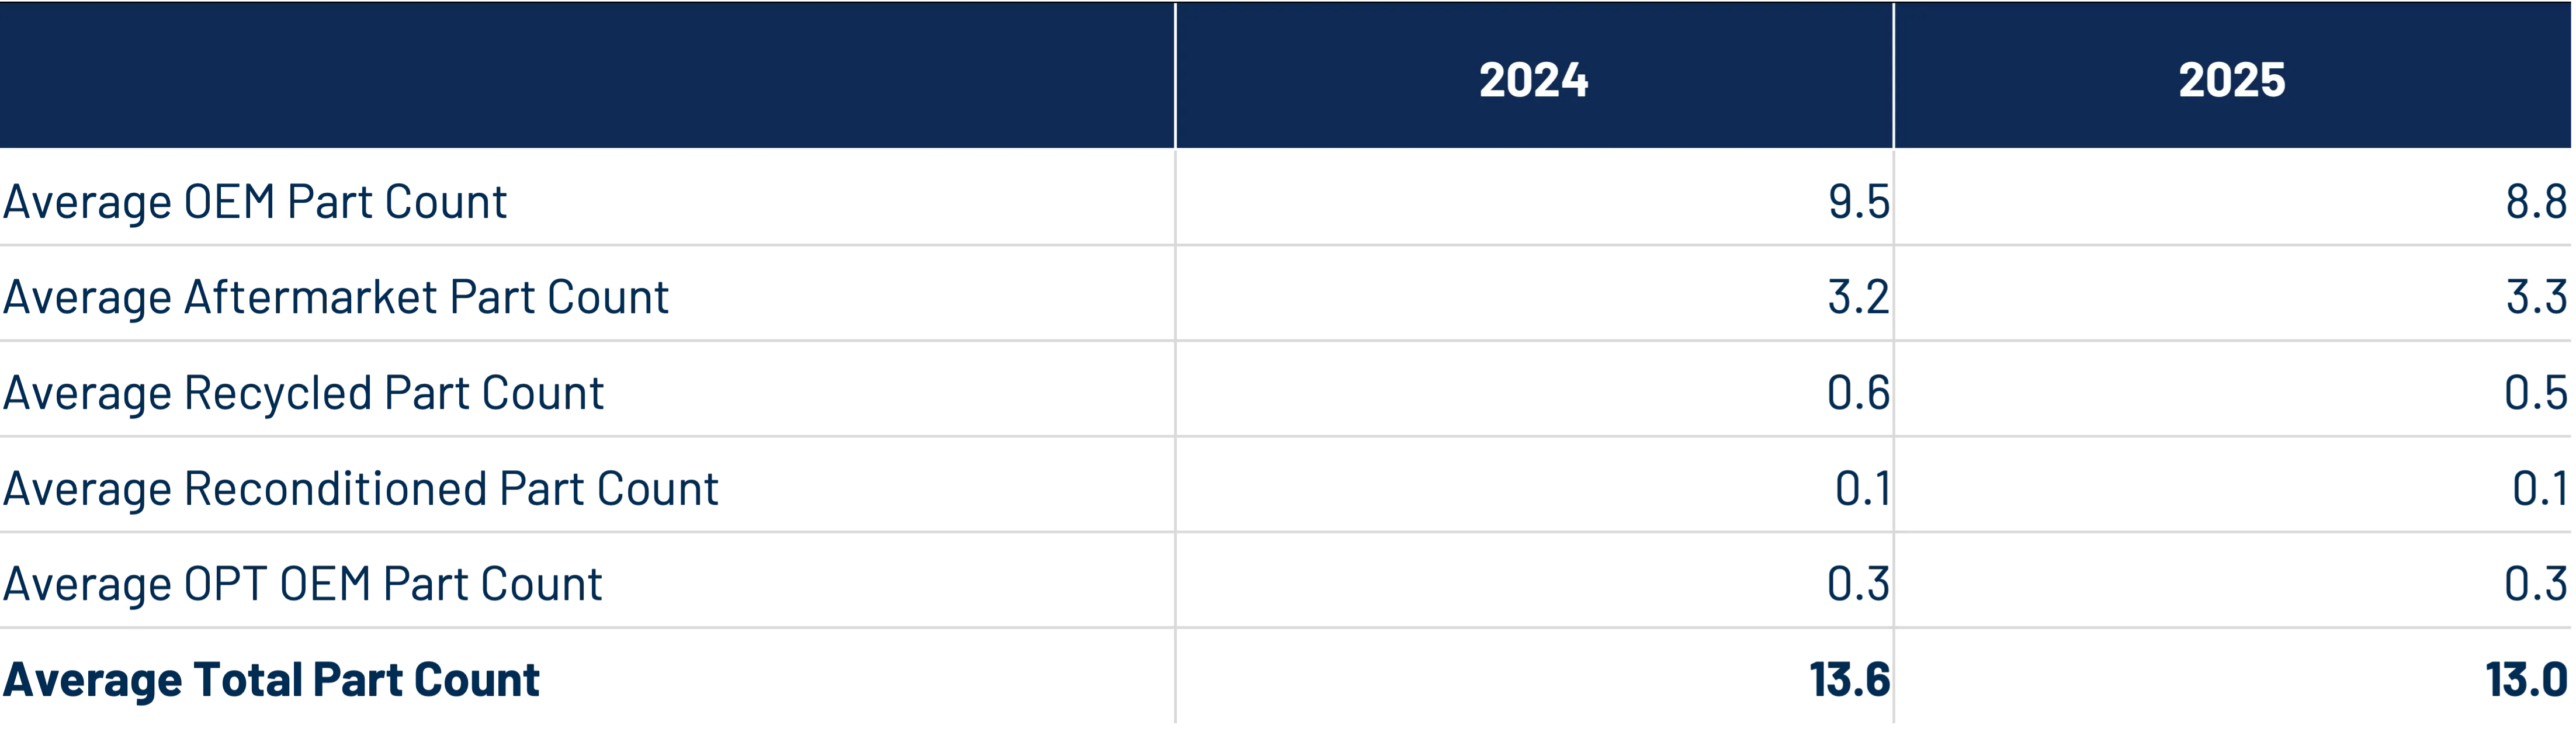
Part dollars in 2025 saw a 1.8 percent decrease in OEM part dollars, while aftermarket parts saw a 1.7 percent part dollar increase. This shift was likely the result of a 0.7 OEM part per repair decrease in 2025. (Figures 38 and 39)
While some of this shift can certainly be attributed to mix (towards older vehicles) and an increased share of total losses, these are likely only some of the contributing factors to a decreased share of parts. The average number of parts per E01 (initial estimate) was flat in Q1, -0.2 parts in Q2 and Q3, and at -0.3 parts in Q4 at the time of Crash Course's publication. The average number of parts per supplement was -0.3 parts in Q1, -0.4 in Q2, -0.2 in Q3, and -0.3 in Q4.
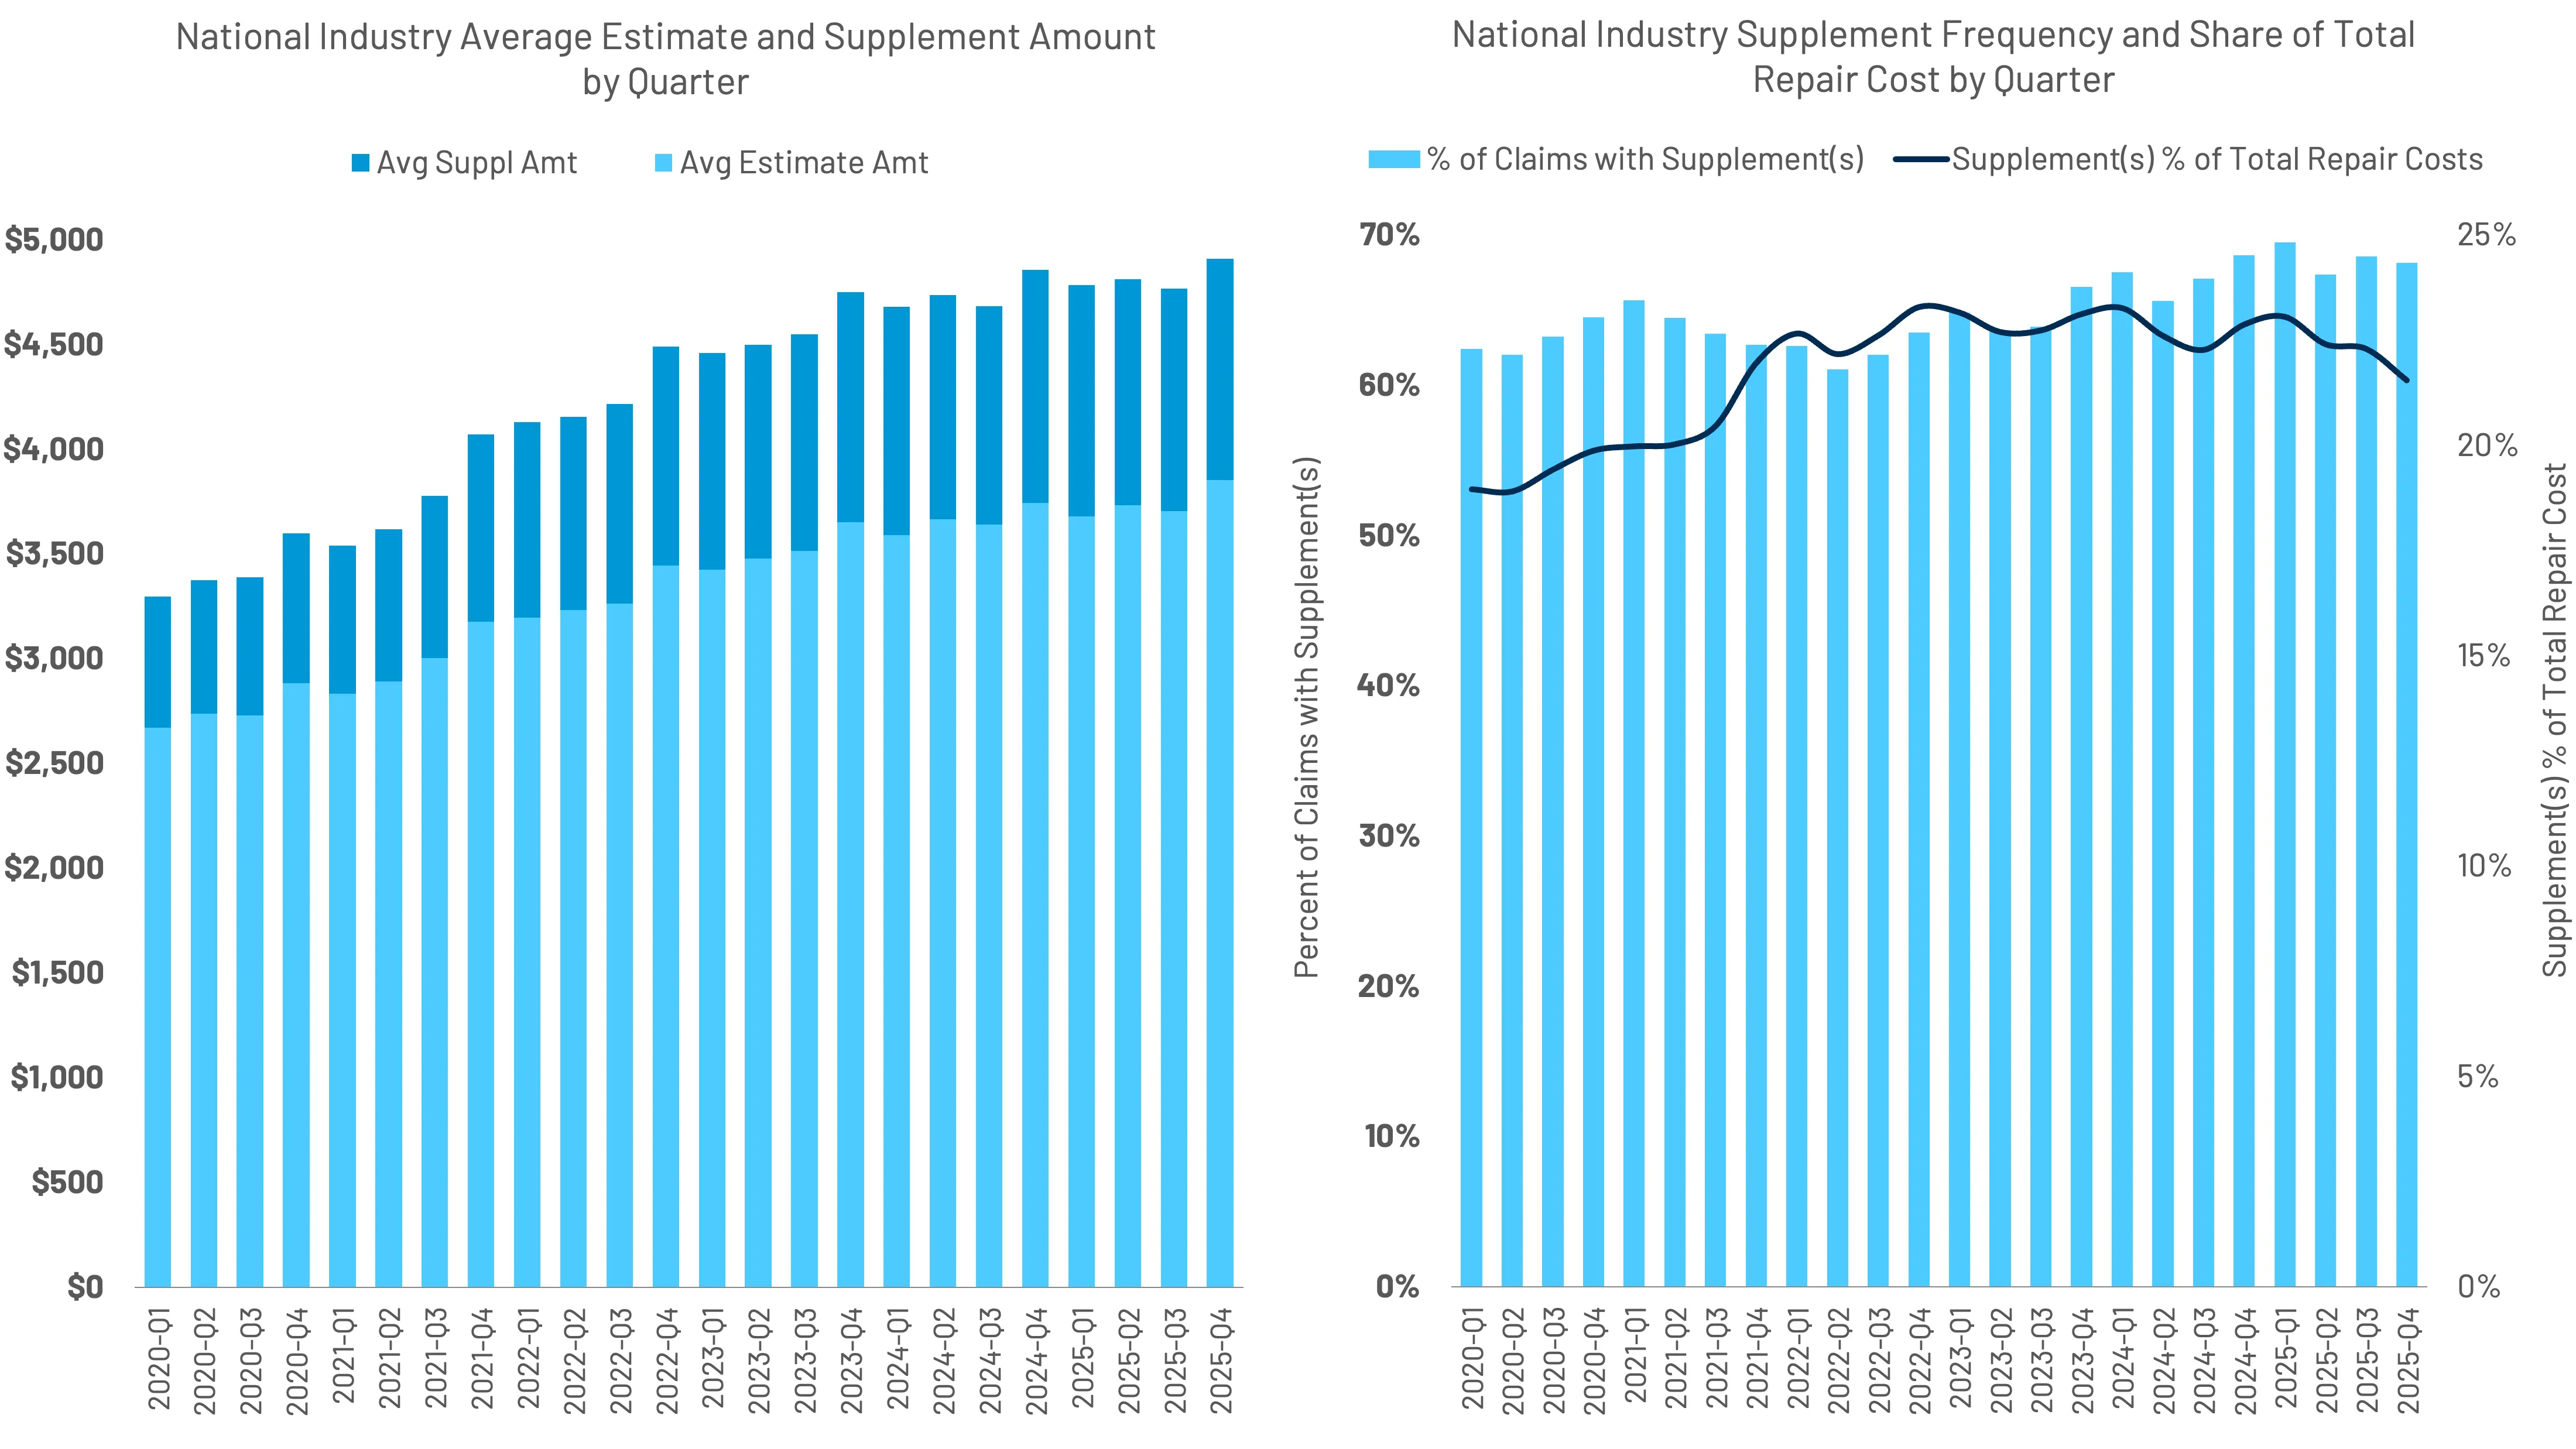
Supplement activity remained steady throughout 2025, as the share of repairable appraisals that included a supplement was up year over year for each of the first three quarters; preliminary Q4 2025 results indicate flat results year-over-year.
Supplement dollars as a percentage of TCOR are also flat through the first three quarters. TCOR dollars could see subtle shifts away from supplements back into the E01 as a higher share of diagnostics show up in the initial estimate. Average TCORs for E01s and supplement changes through the first three quarters of 2025 are generally in line with overall increases in repair costs. (Figure 40)
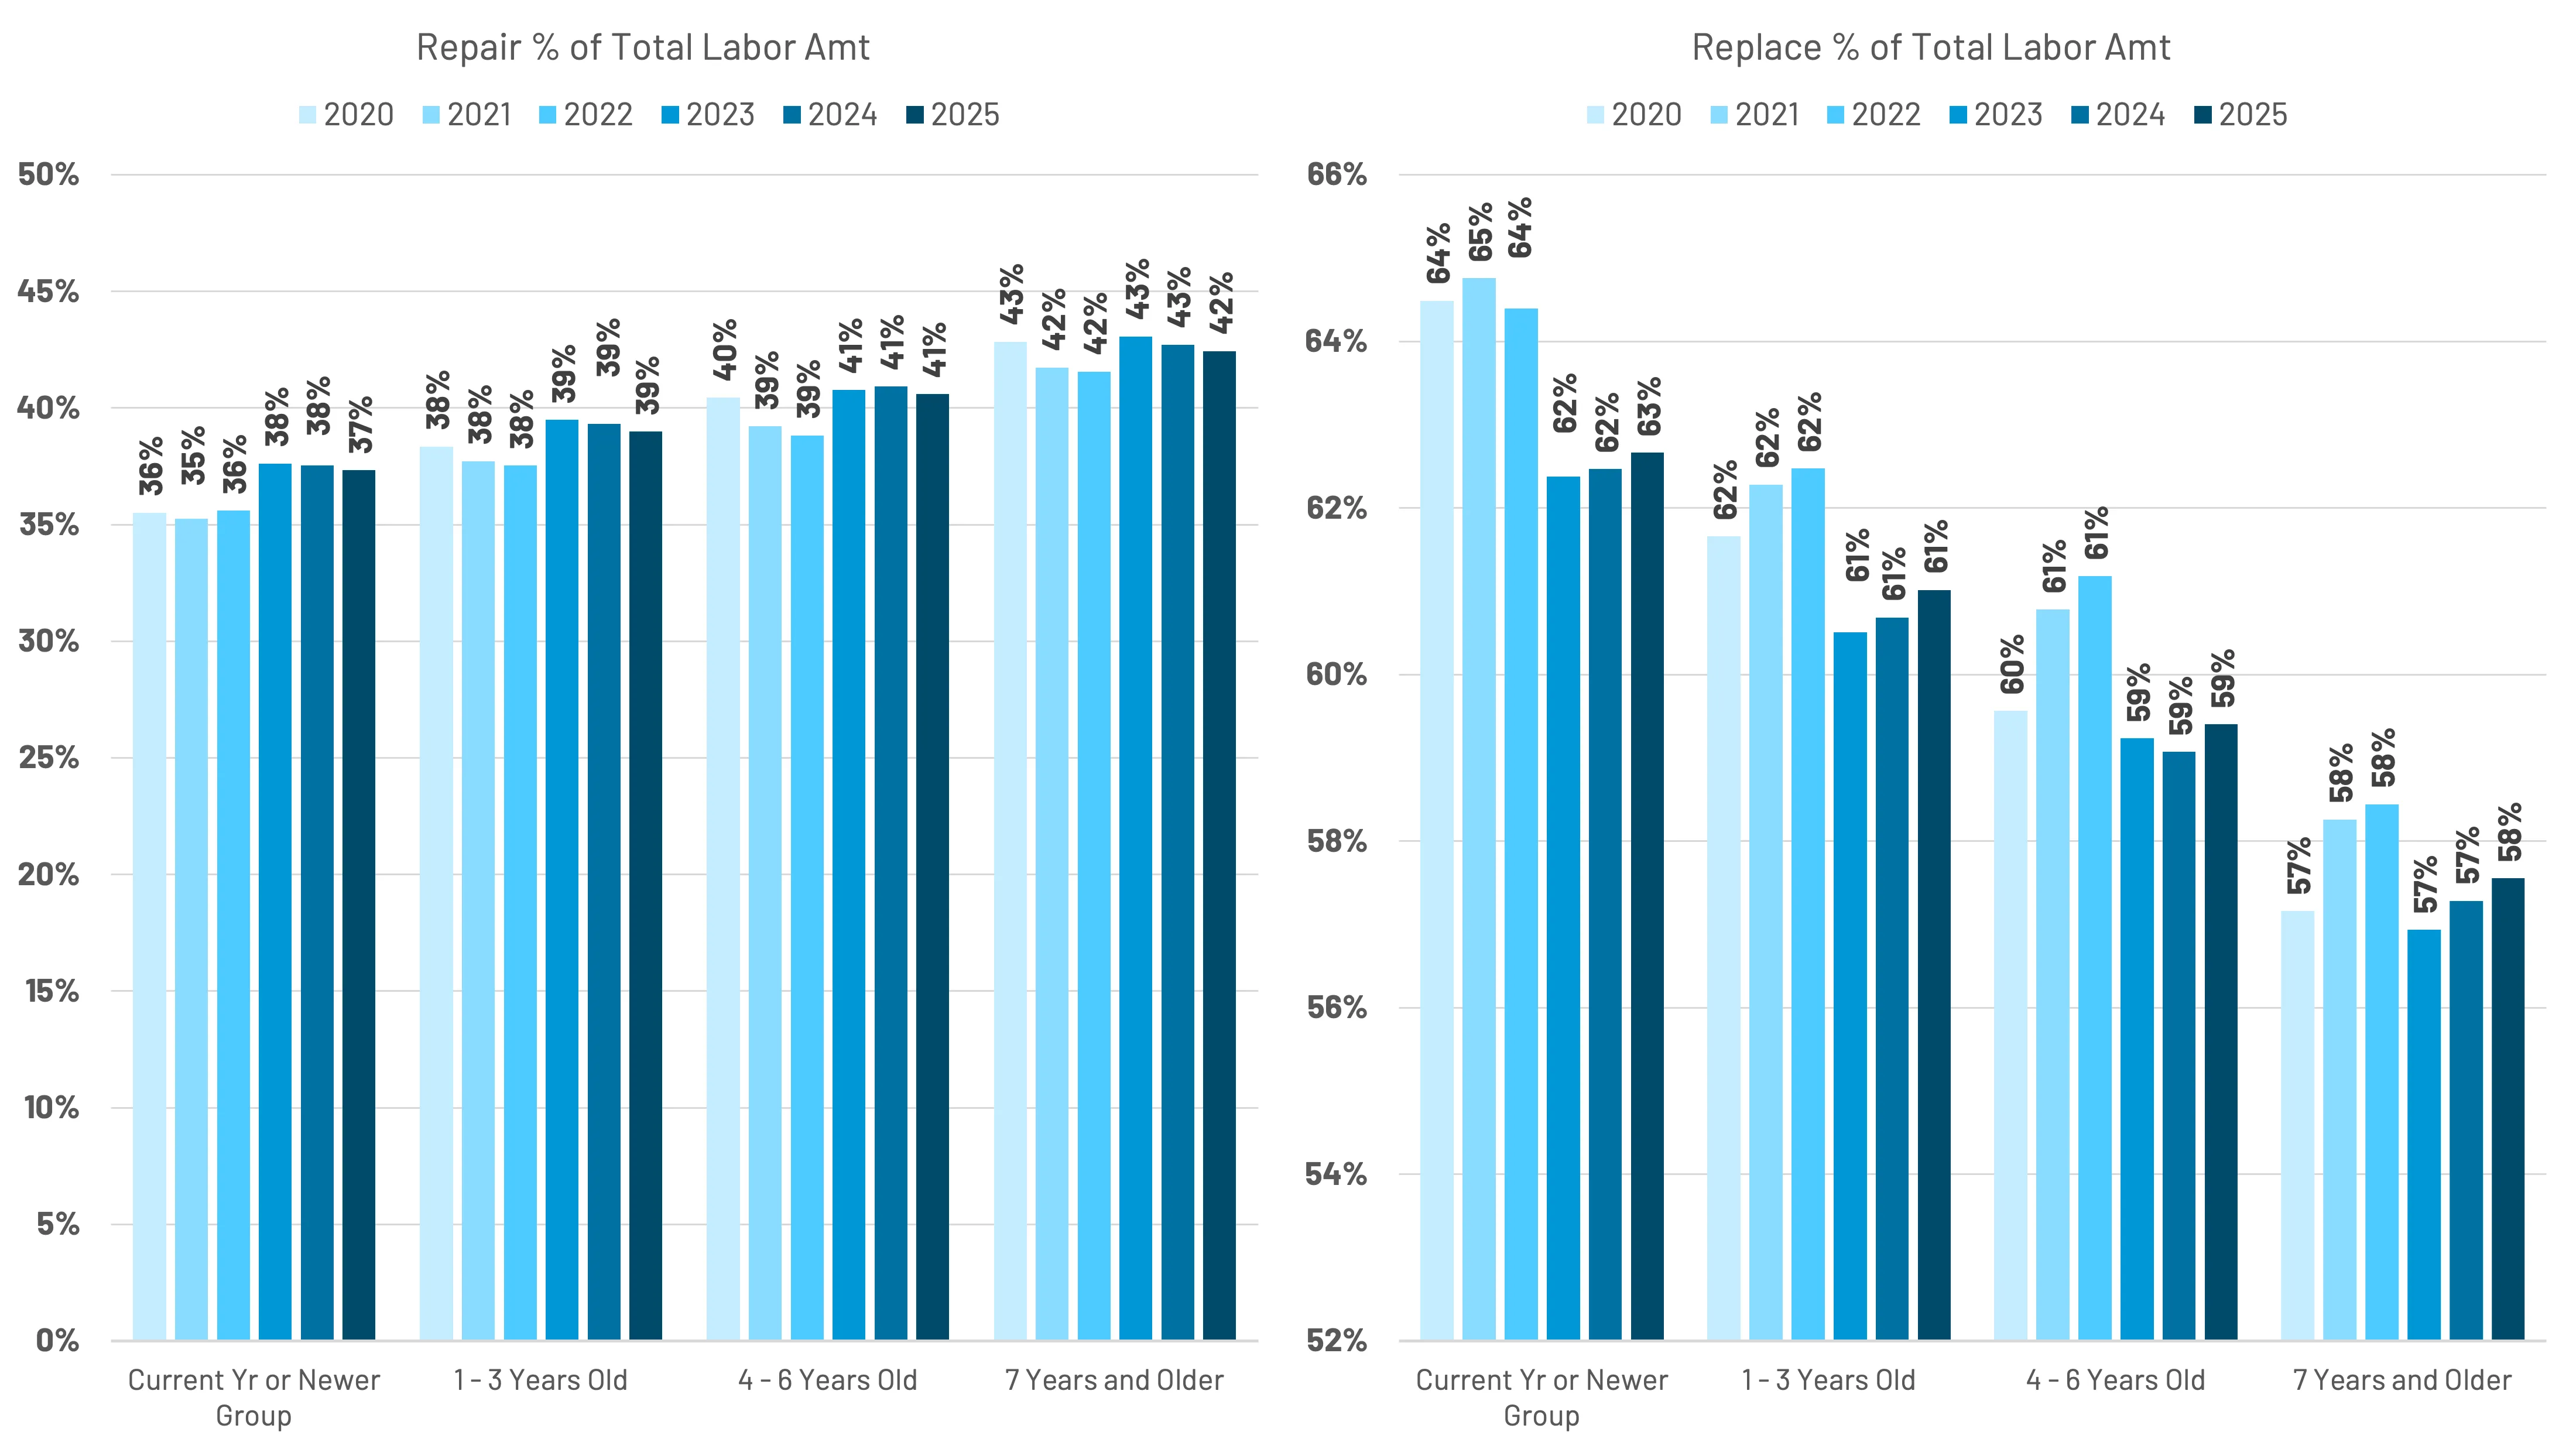
The share of repair vs. replacement labor (as a % of total labor dollars) was down slightly year-over-year (by 0.3 percentage points) (Figure 41), contrary to many beliefs that we would see an emergence of repaired parts amidst increases in part prices. Neither appeared to have come to fruition in 2025.
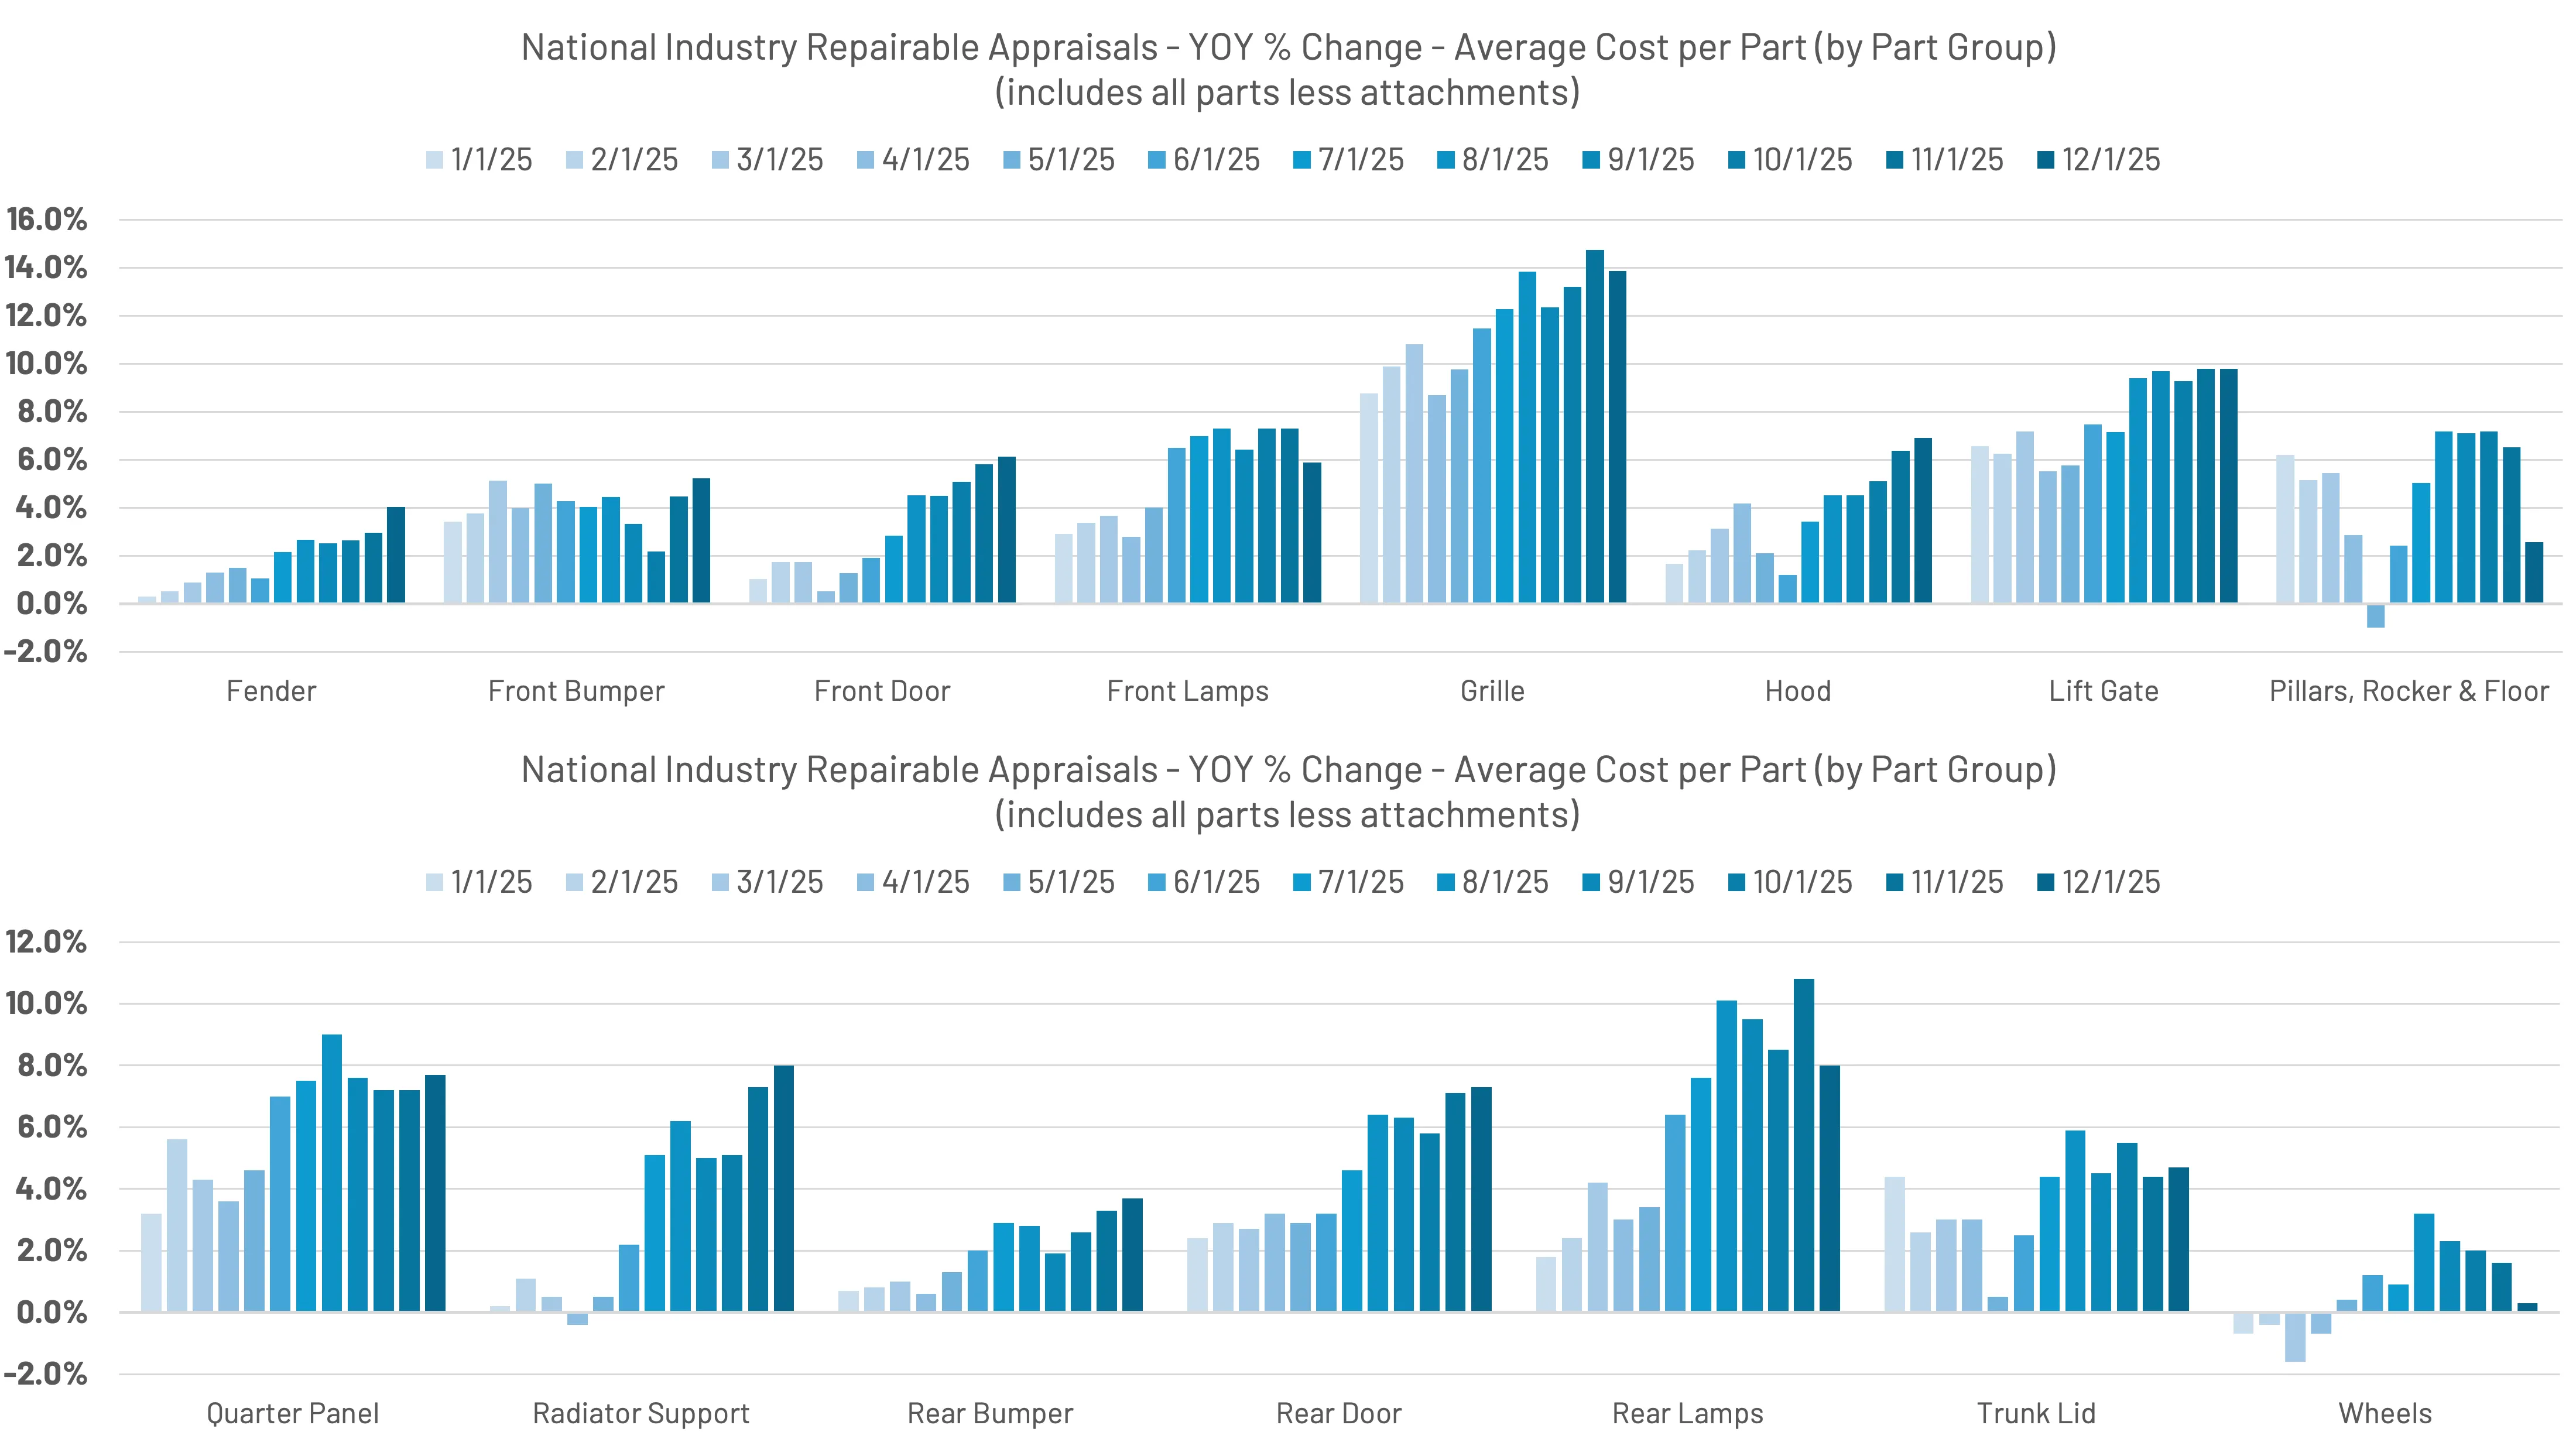
Various analyses throughout 2025 have identified pockets of more prominent increases within parts, such as grilles, lift gates, quarter panels, and rear lamps. Most part trends indicate increases throughout the year above inflation. (Figure 42)
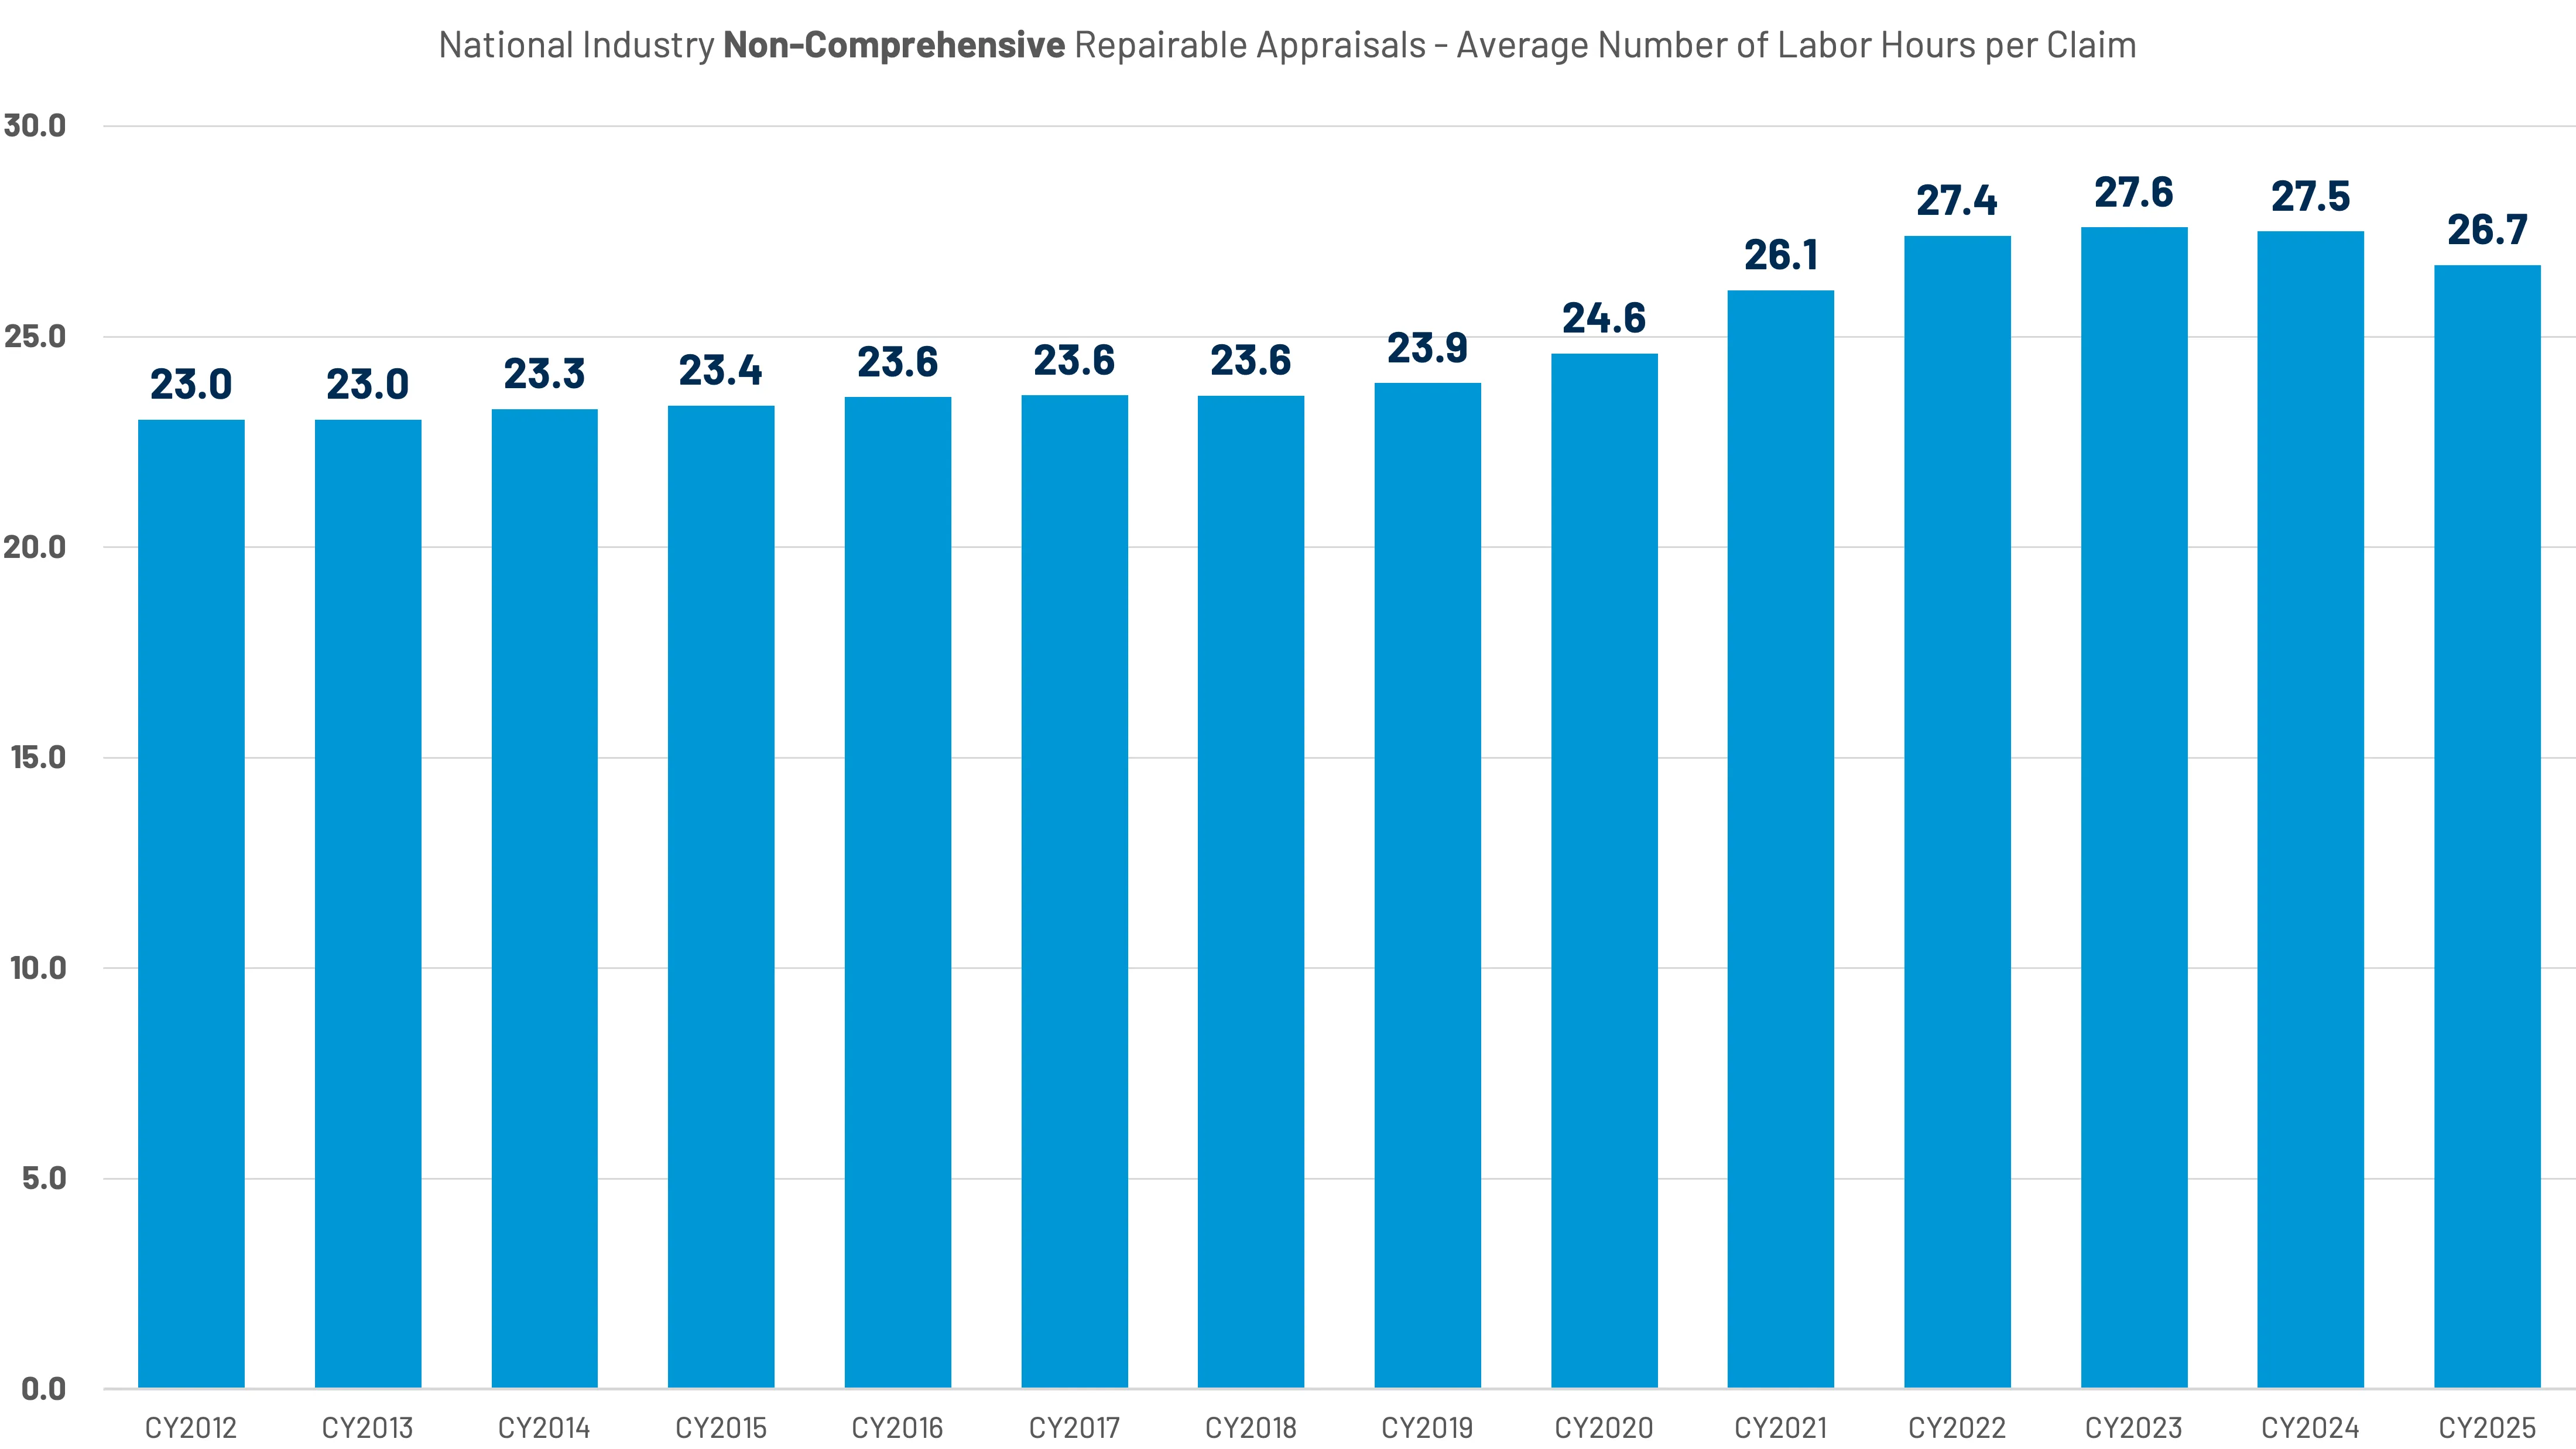
The average number of labor hours per repair continues to follow a trend similar to parts, down 0.8 hours per repair in 2025, following a very slight decrease (-0.1 hours) in 2024. (Figure 43)
Increased Total Loss Rates Could be Muting the Impact of Growing Vehicle Complexity
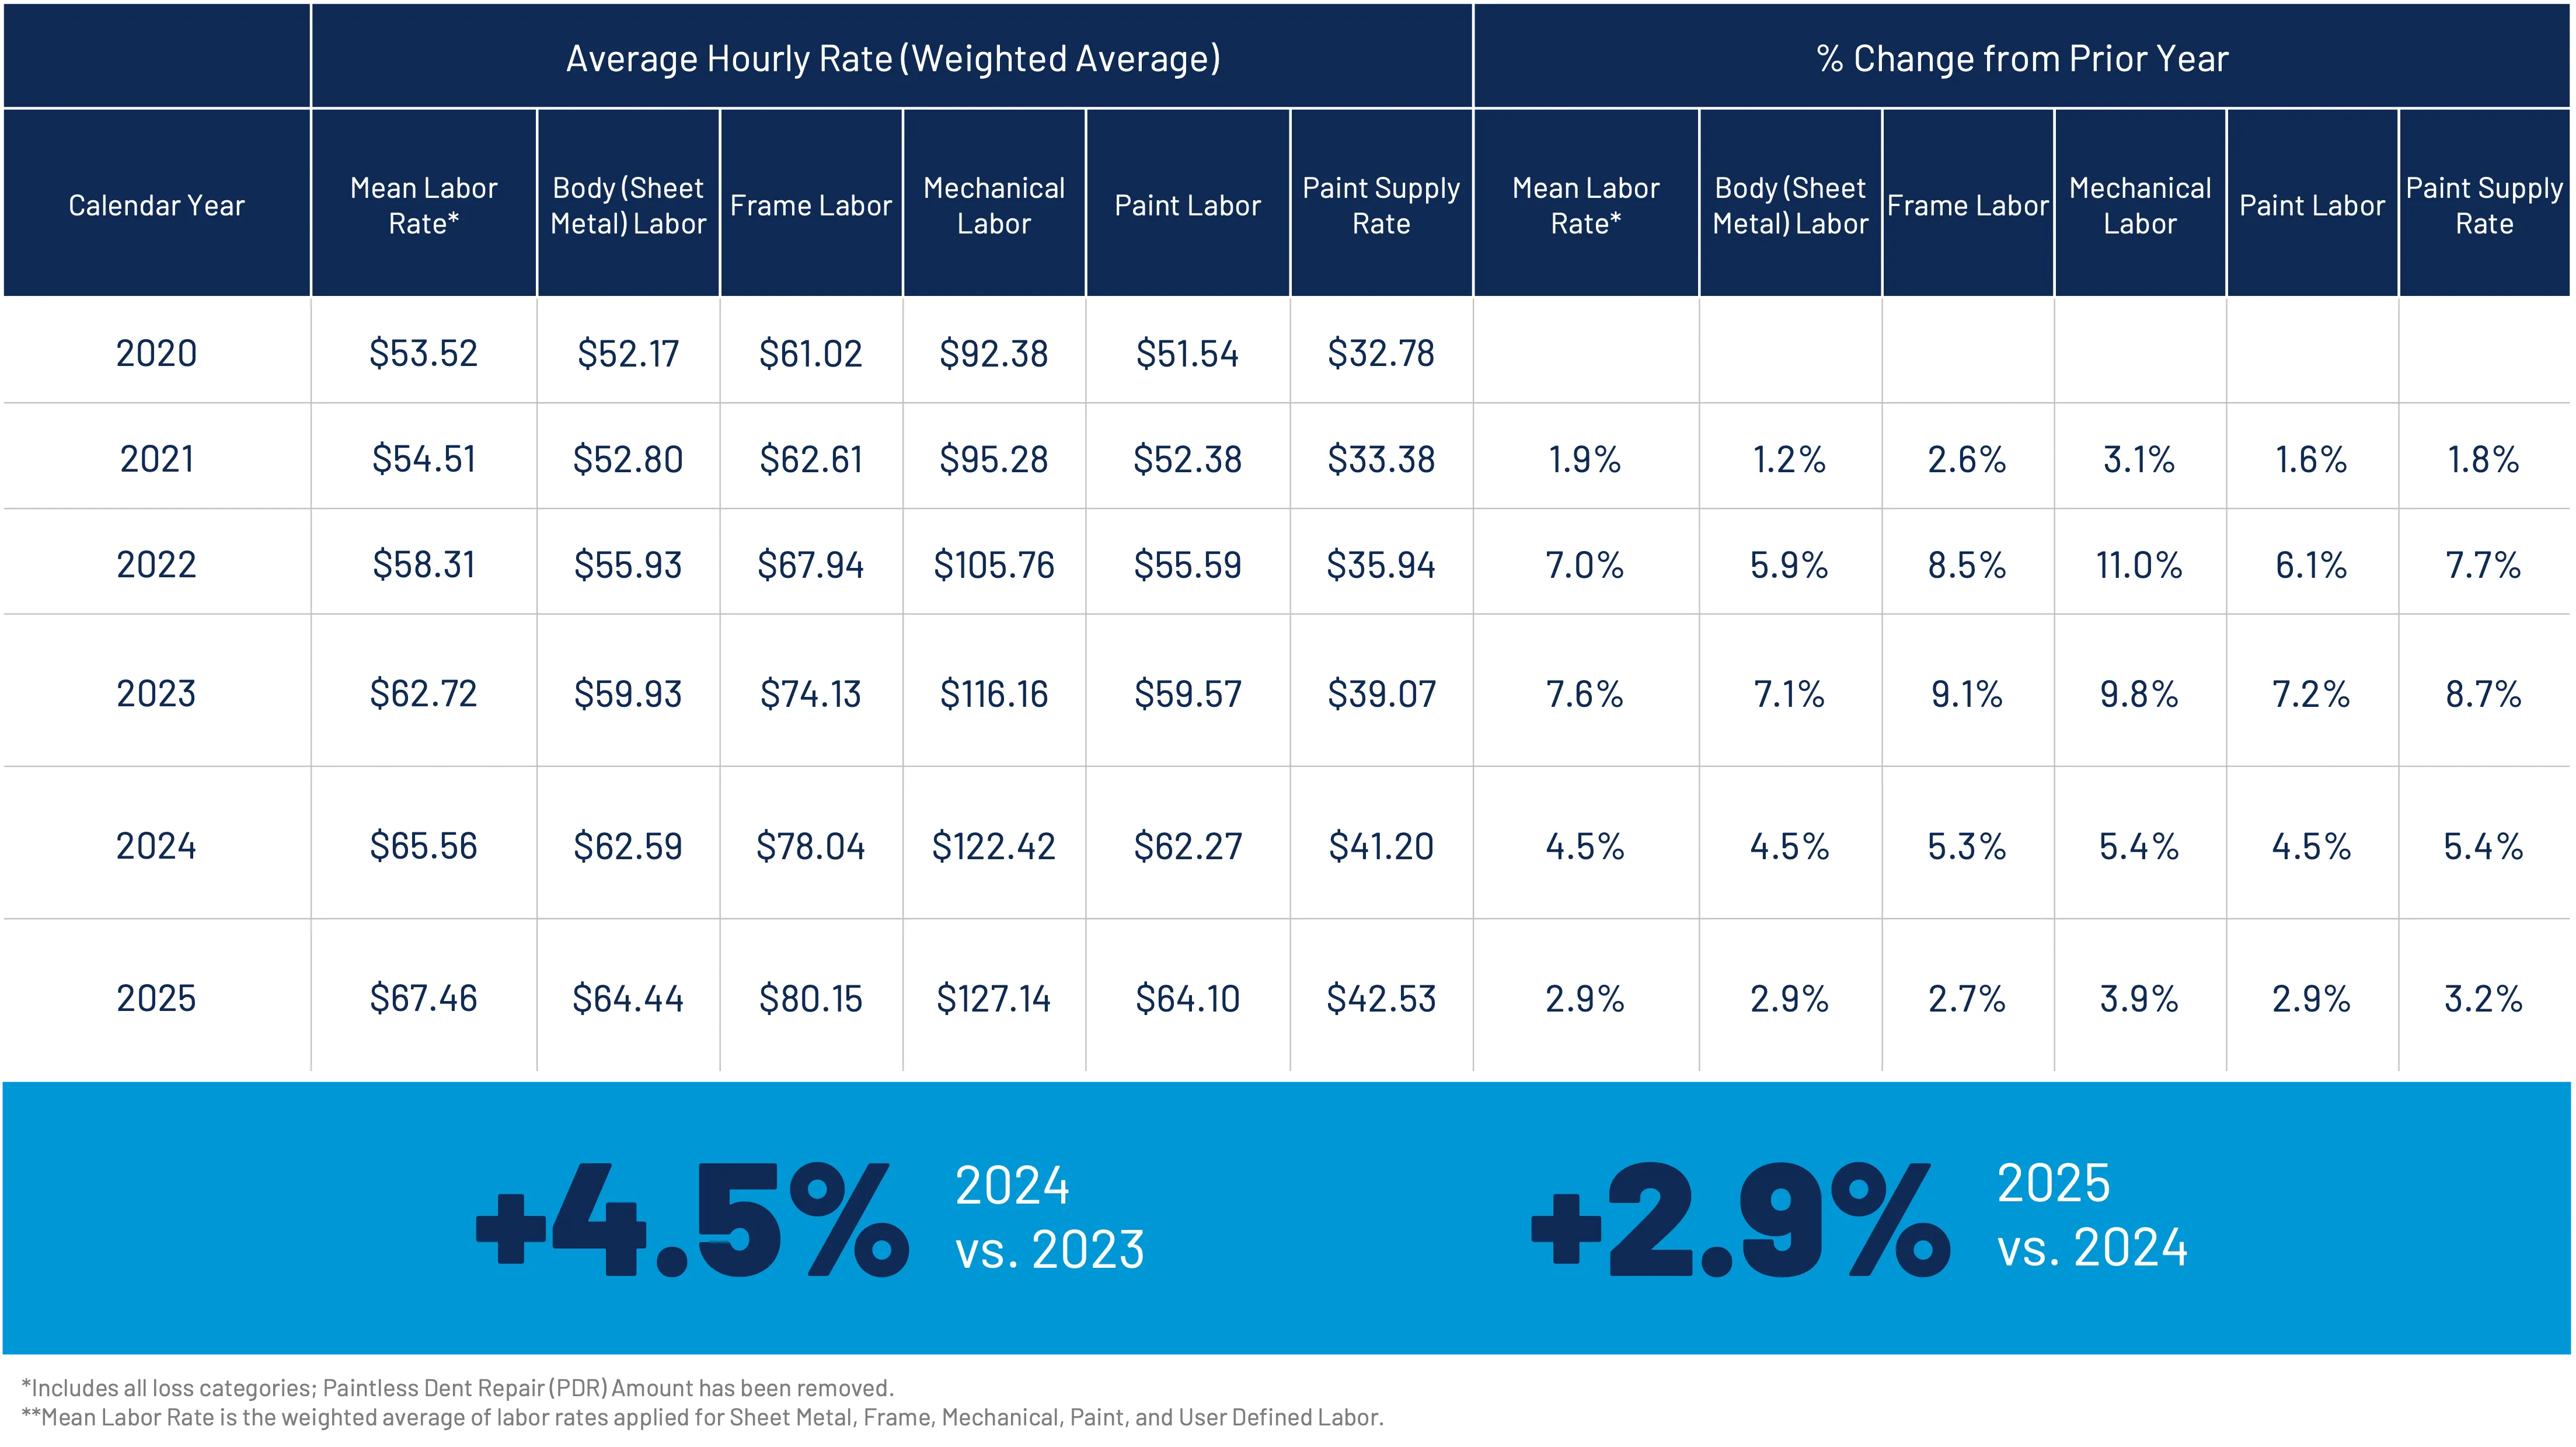
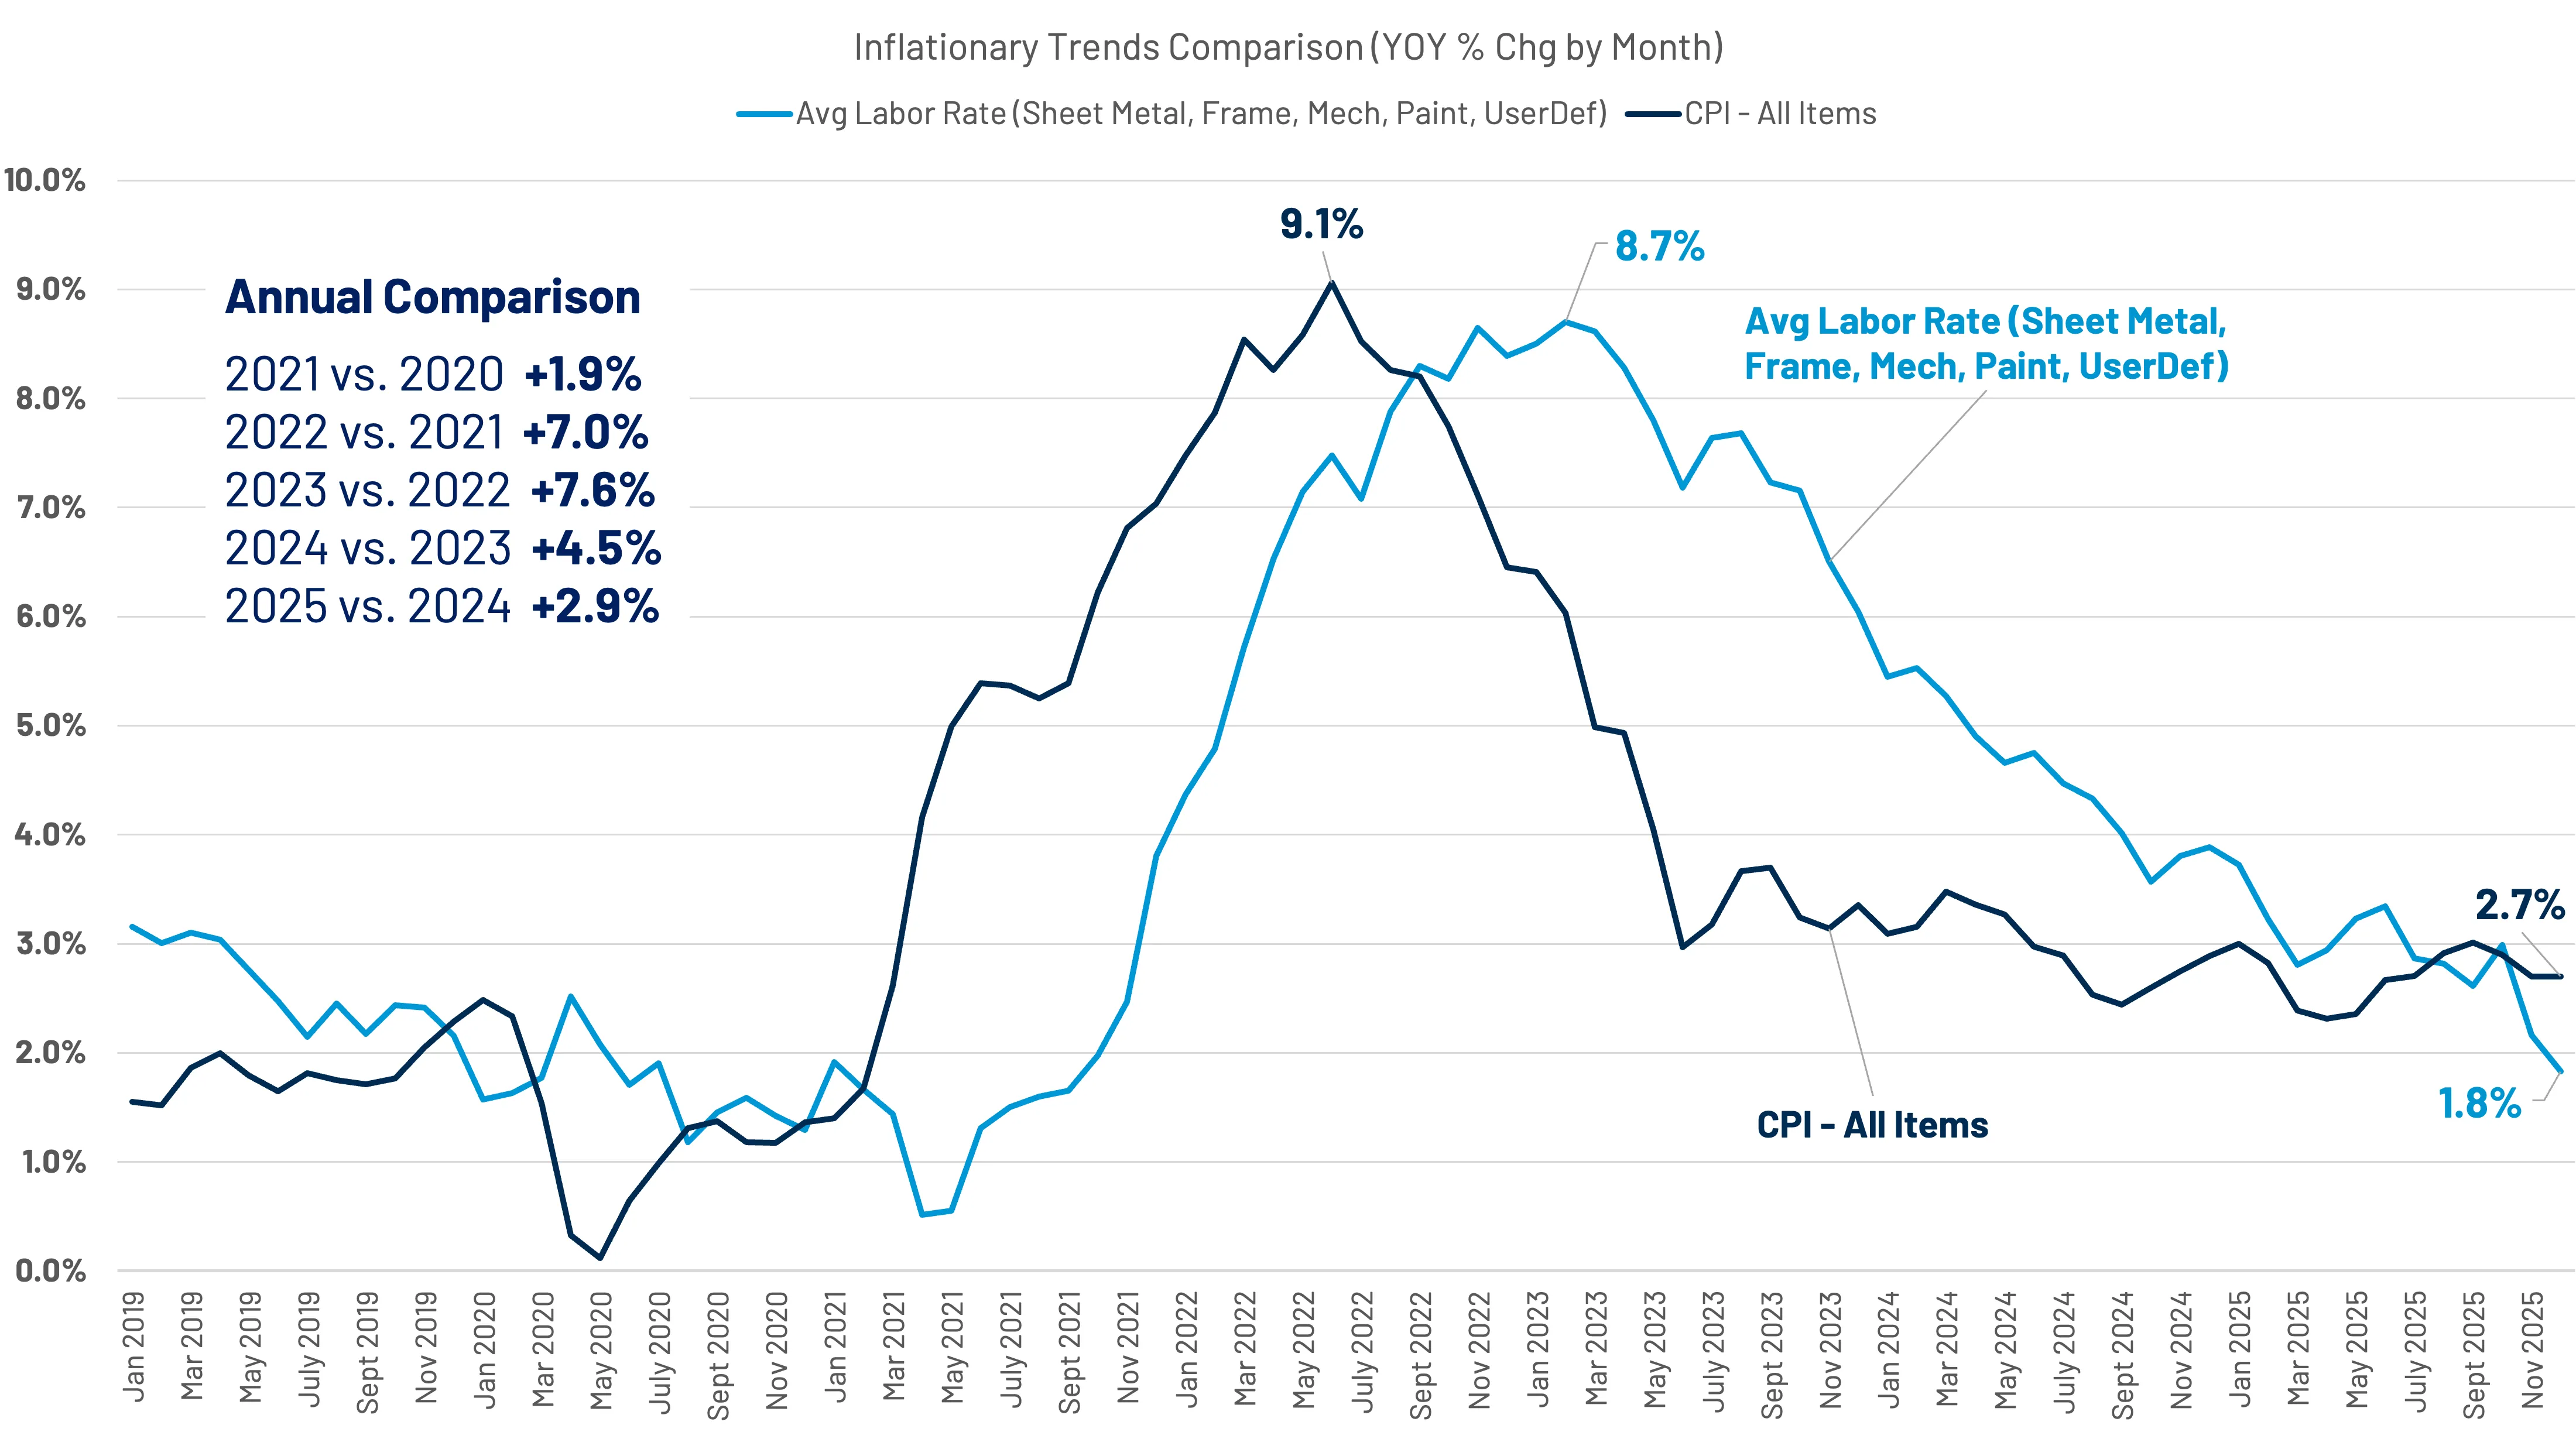
The mean Labor rate (the weighted average across all labor types) saw a 2.9% increase in 2025, the lowest rate of increase since 2021. Labor rate increases, on average, peaked in 2023, lagging behind overall inflation by almost 9 months. (Figures 44 and 45)
CCC National Industry Average Labor Rates per Labor Category 2020-2025
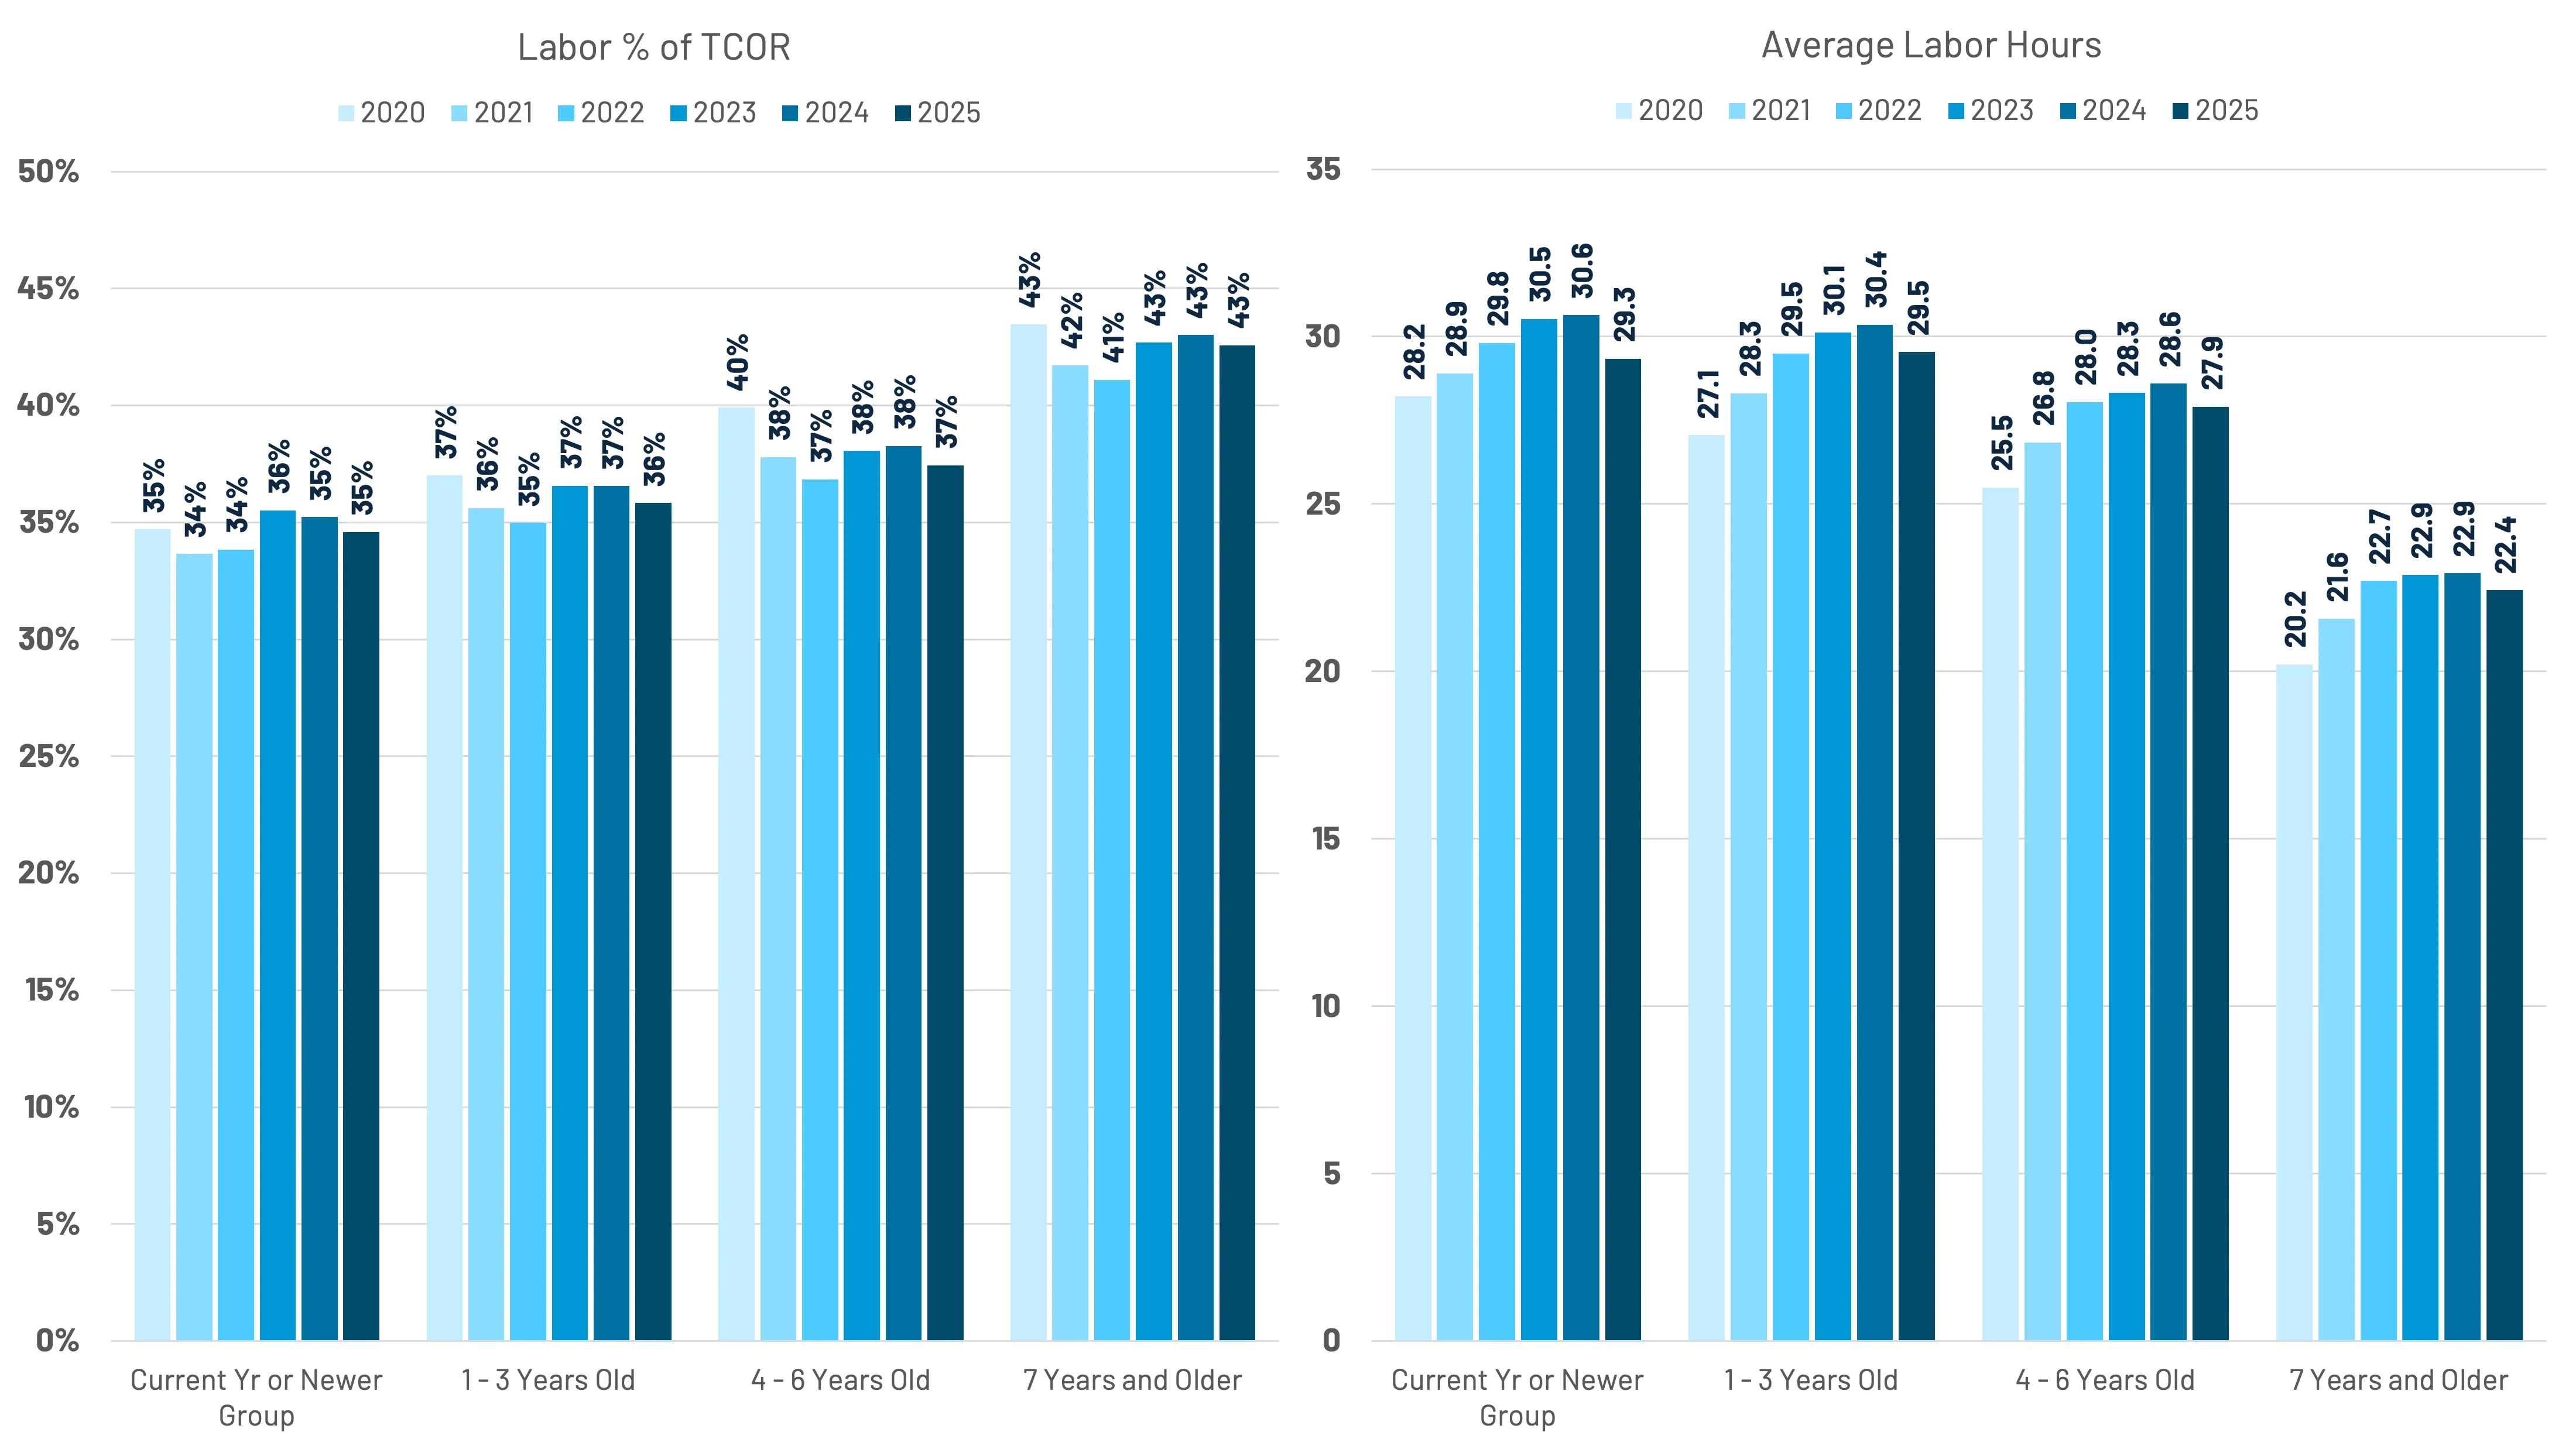
Labor, as a percentage of TCOR, is down marginally year-over-year, seeing almost a neutral offset between increasing labor rates coinciding with decreasing labor hours. (Figure 46)
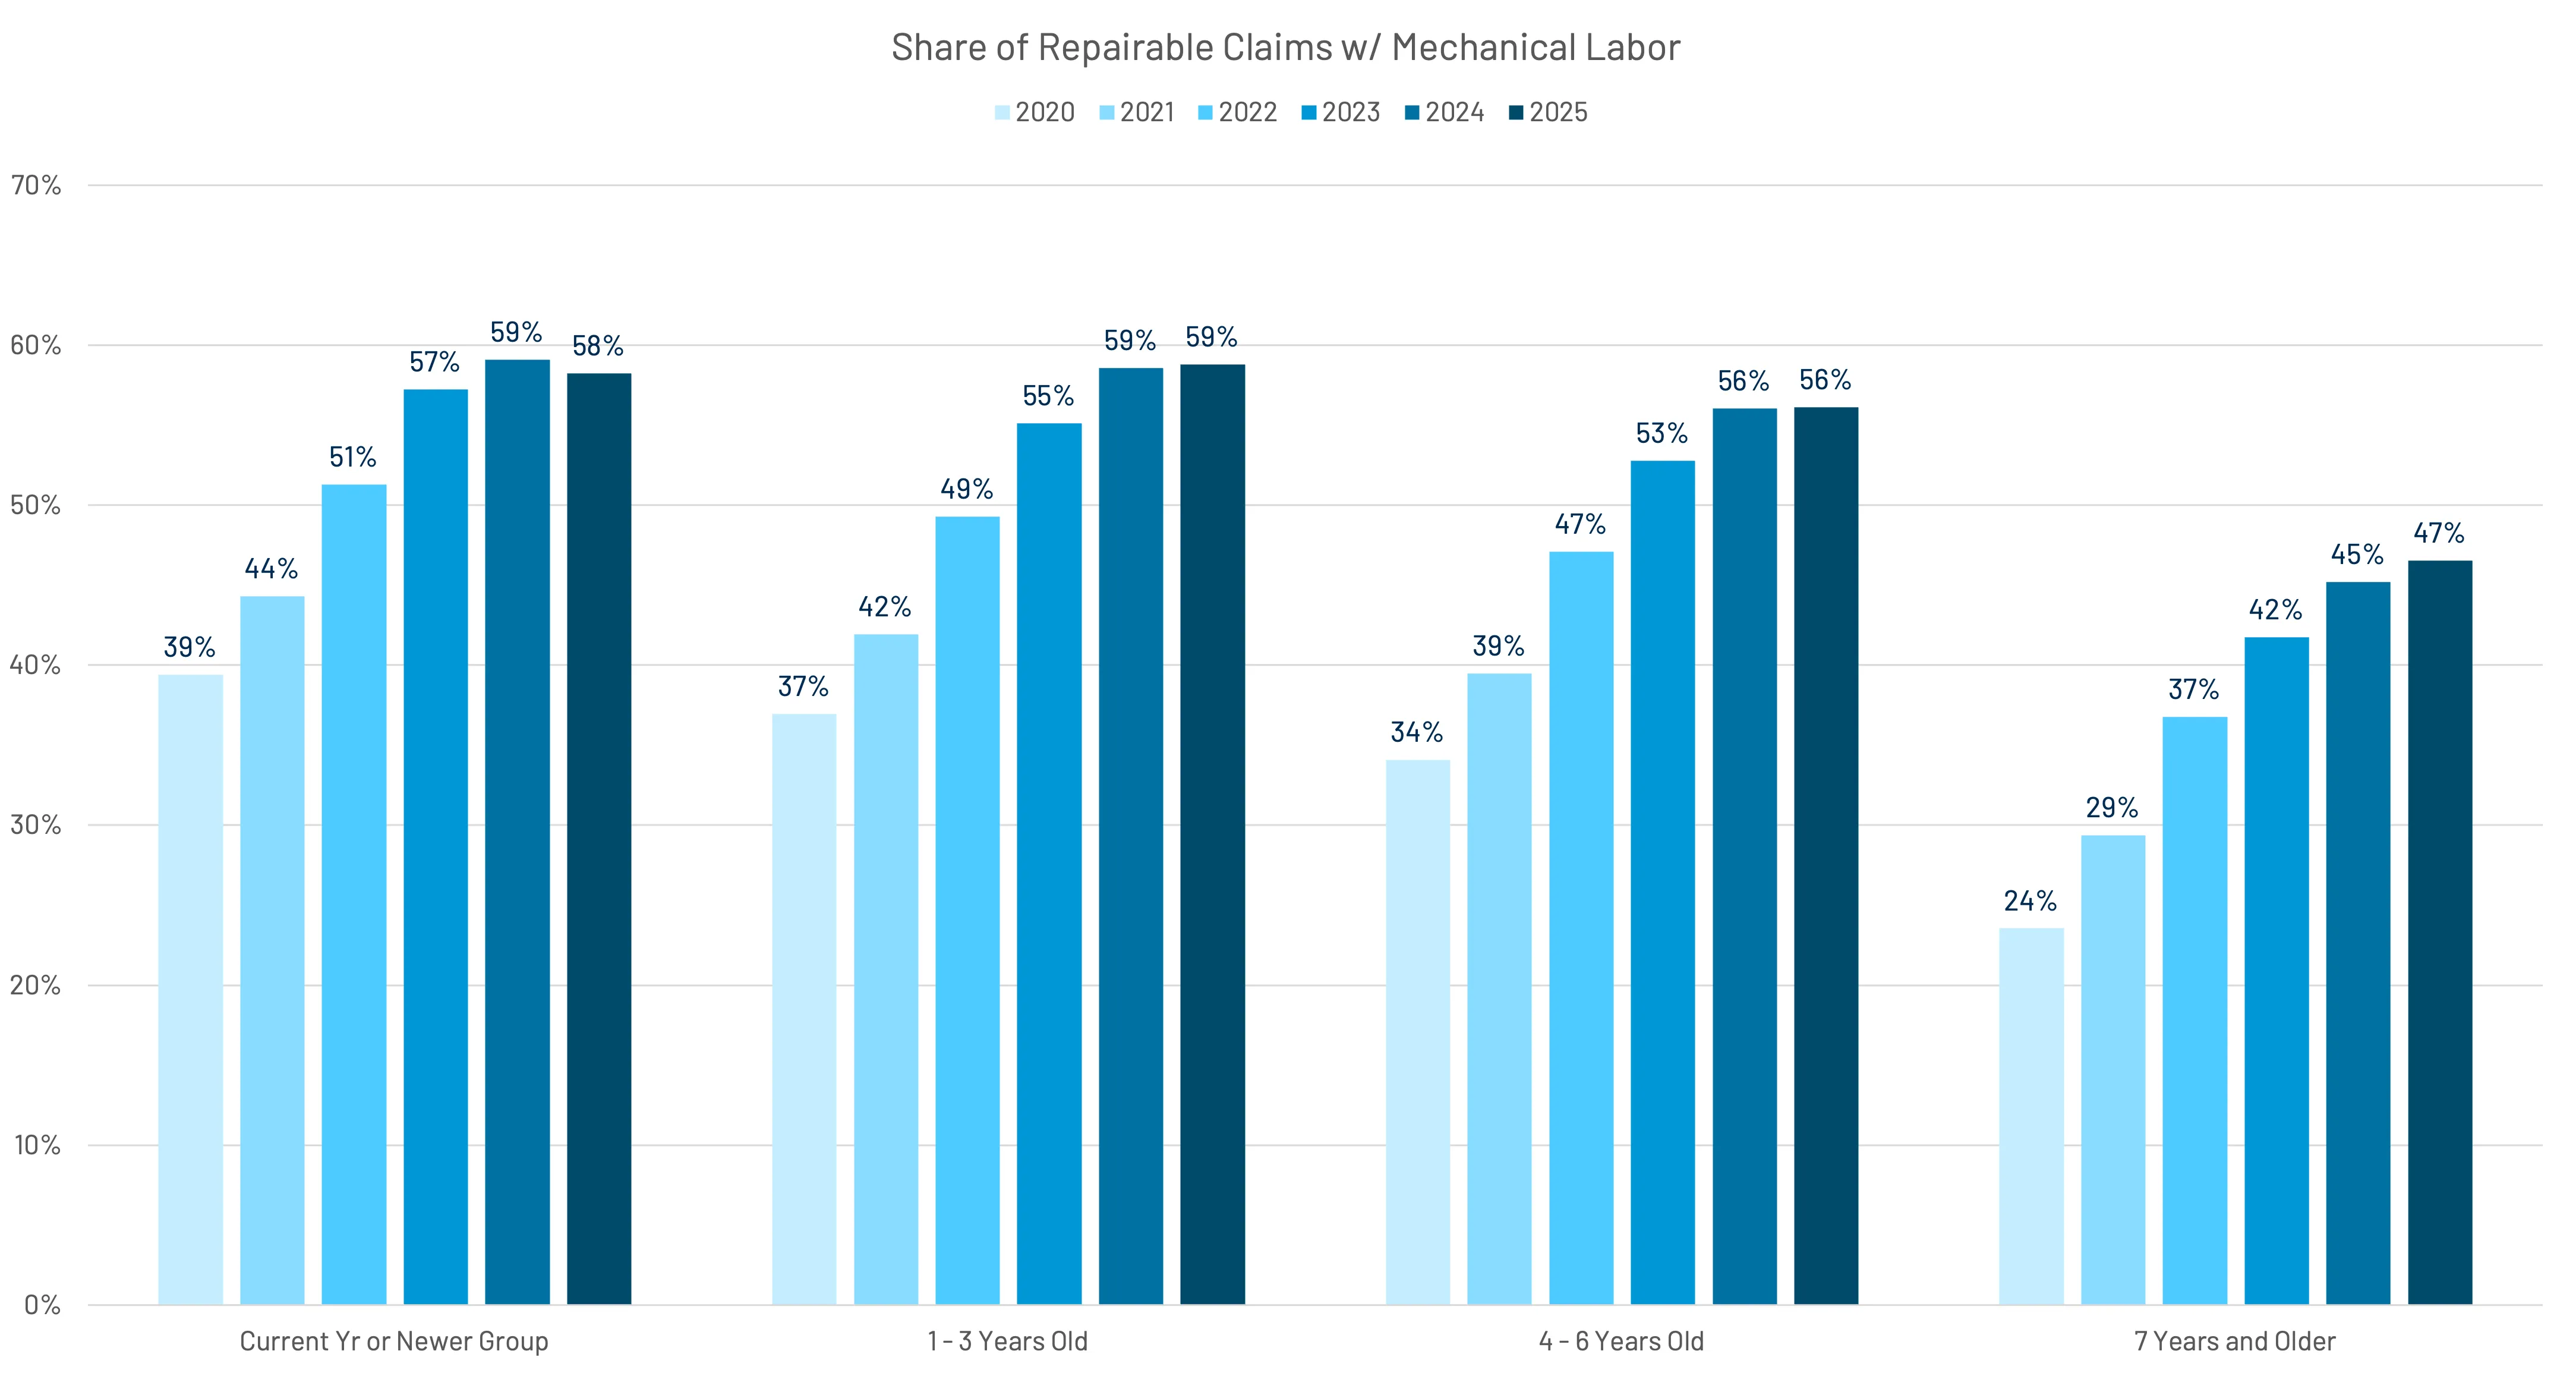
The share of repairable claims with mechanical labor was flat year-over-year, along with the average number of mechanical hours per claim, though the mechanical labor rate does continue to outpace other labor types. (Figure 47)
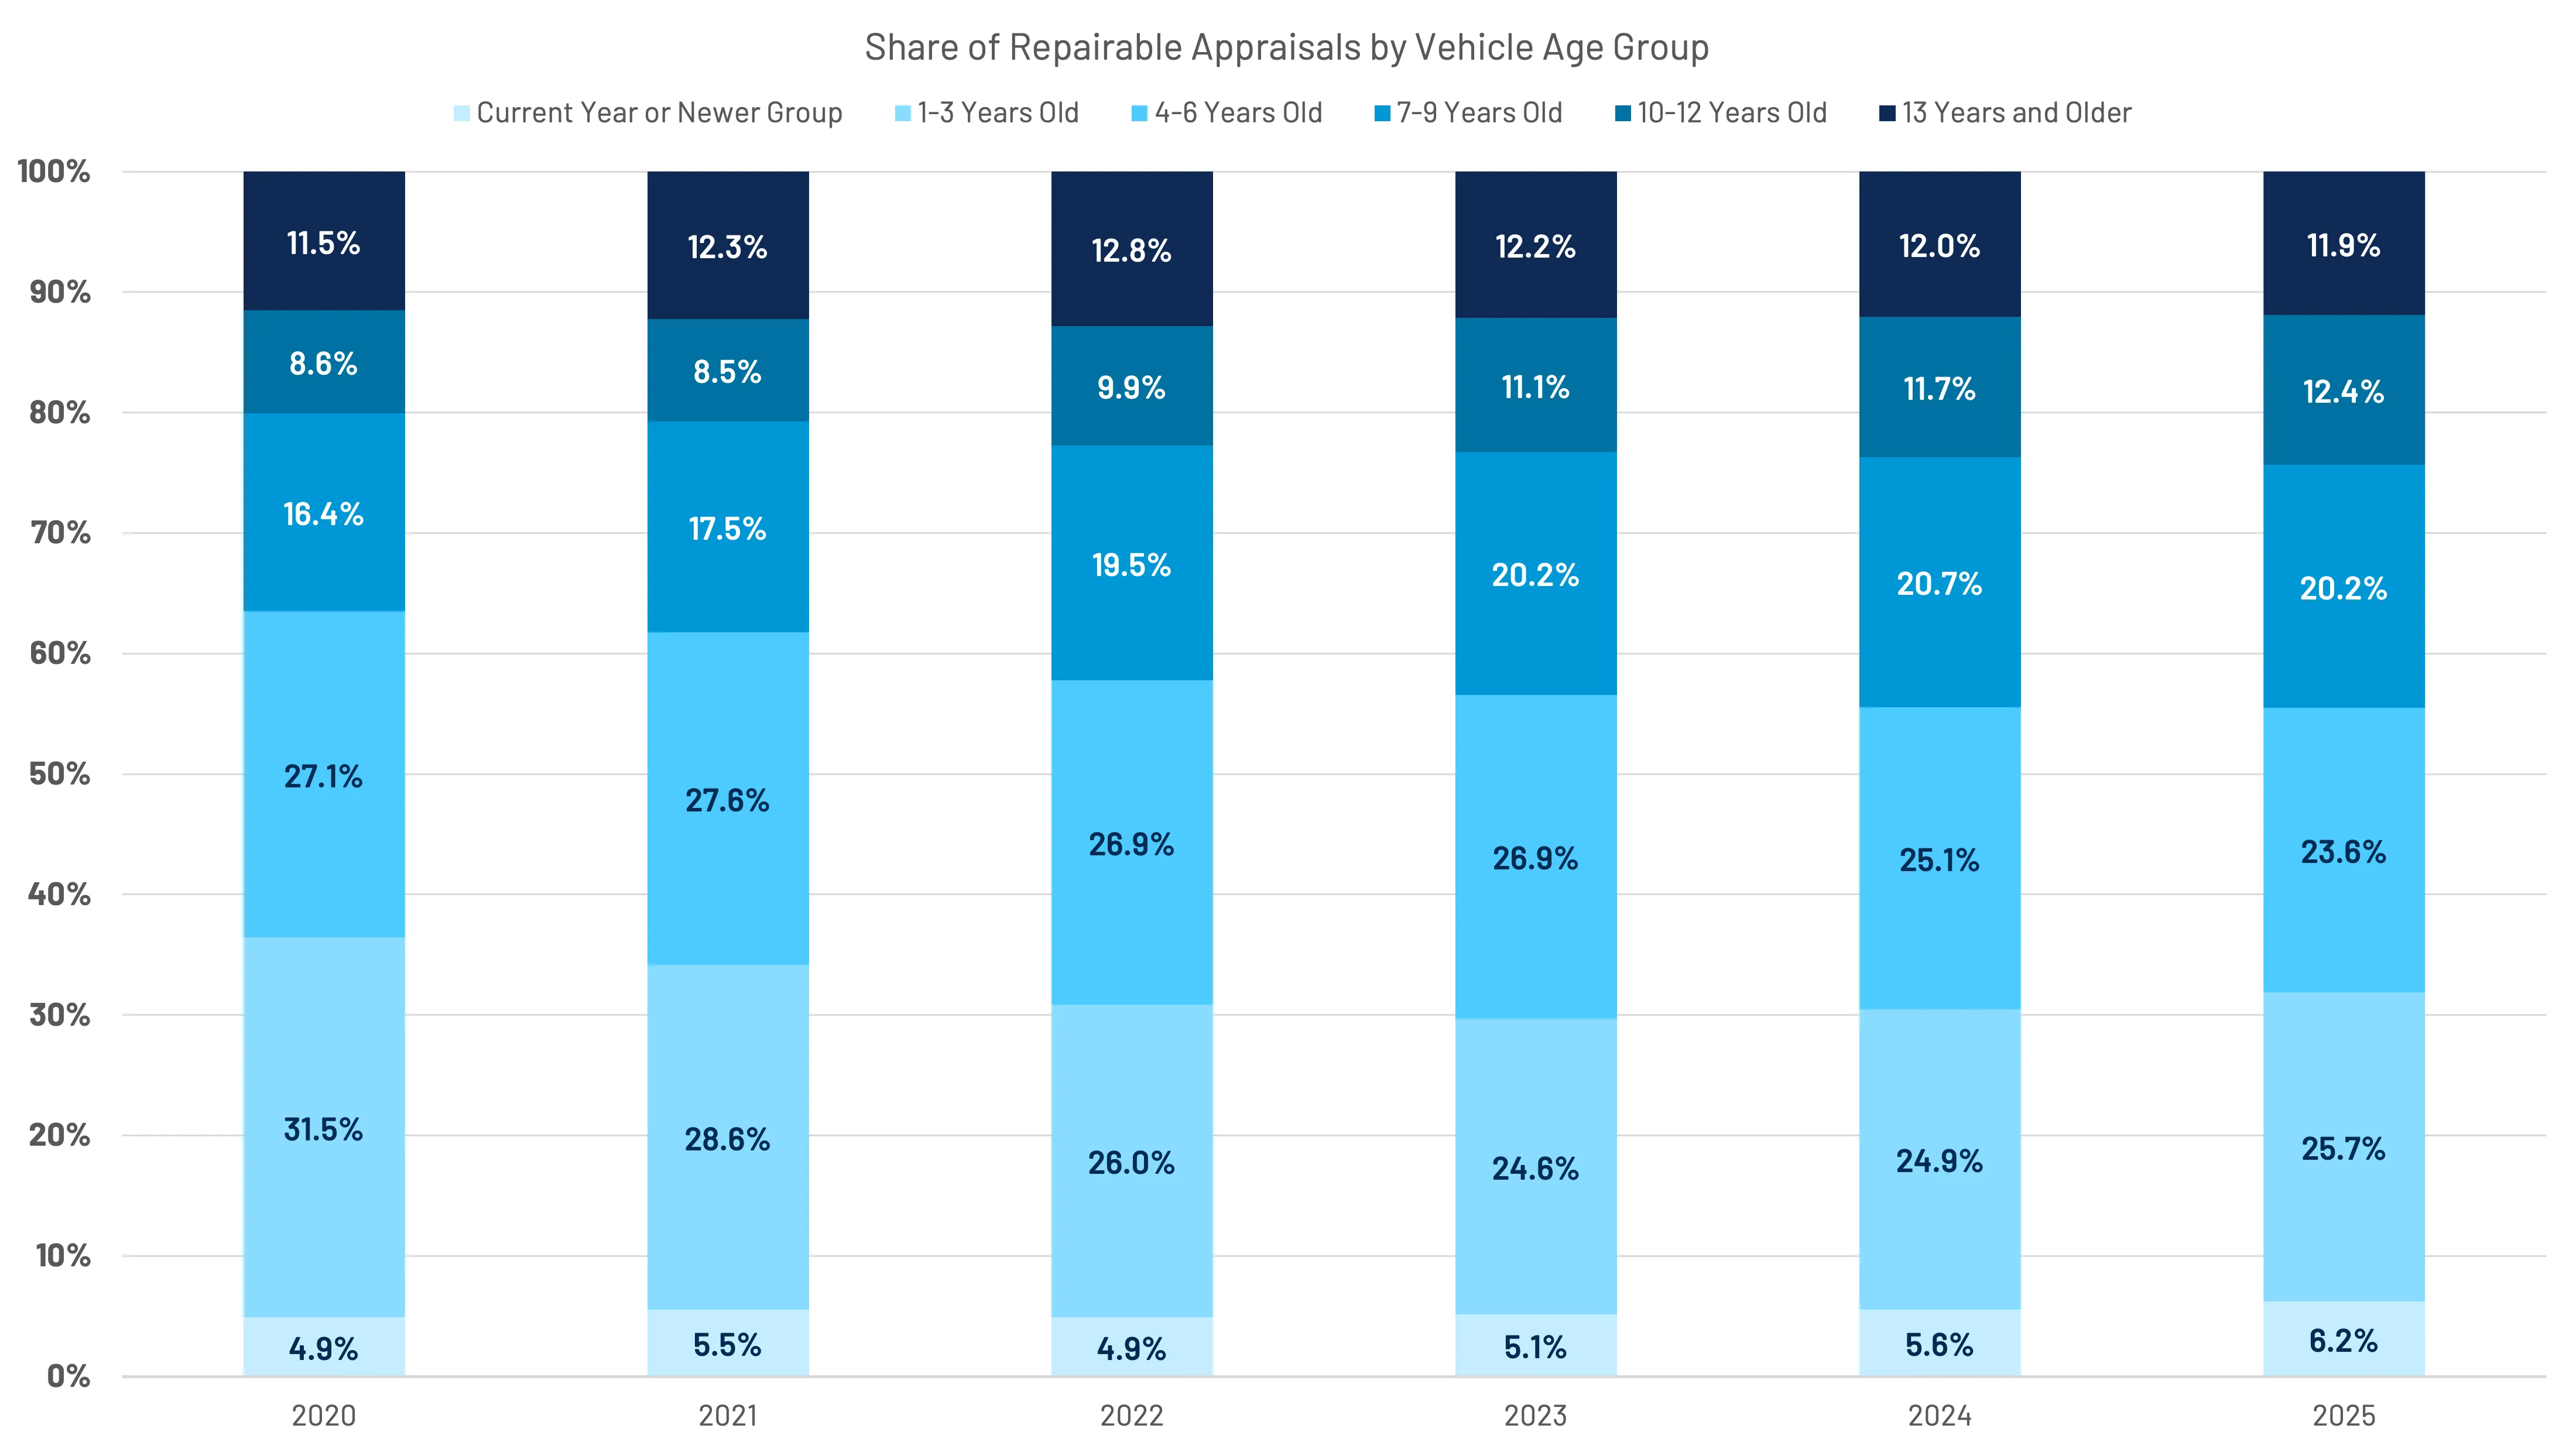
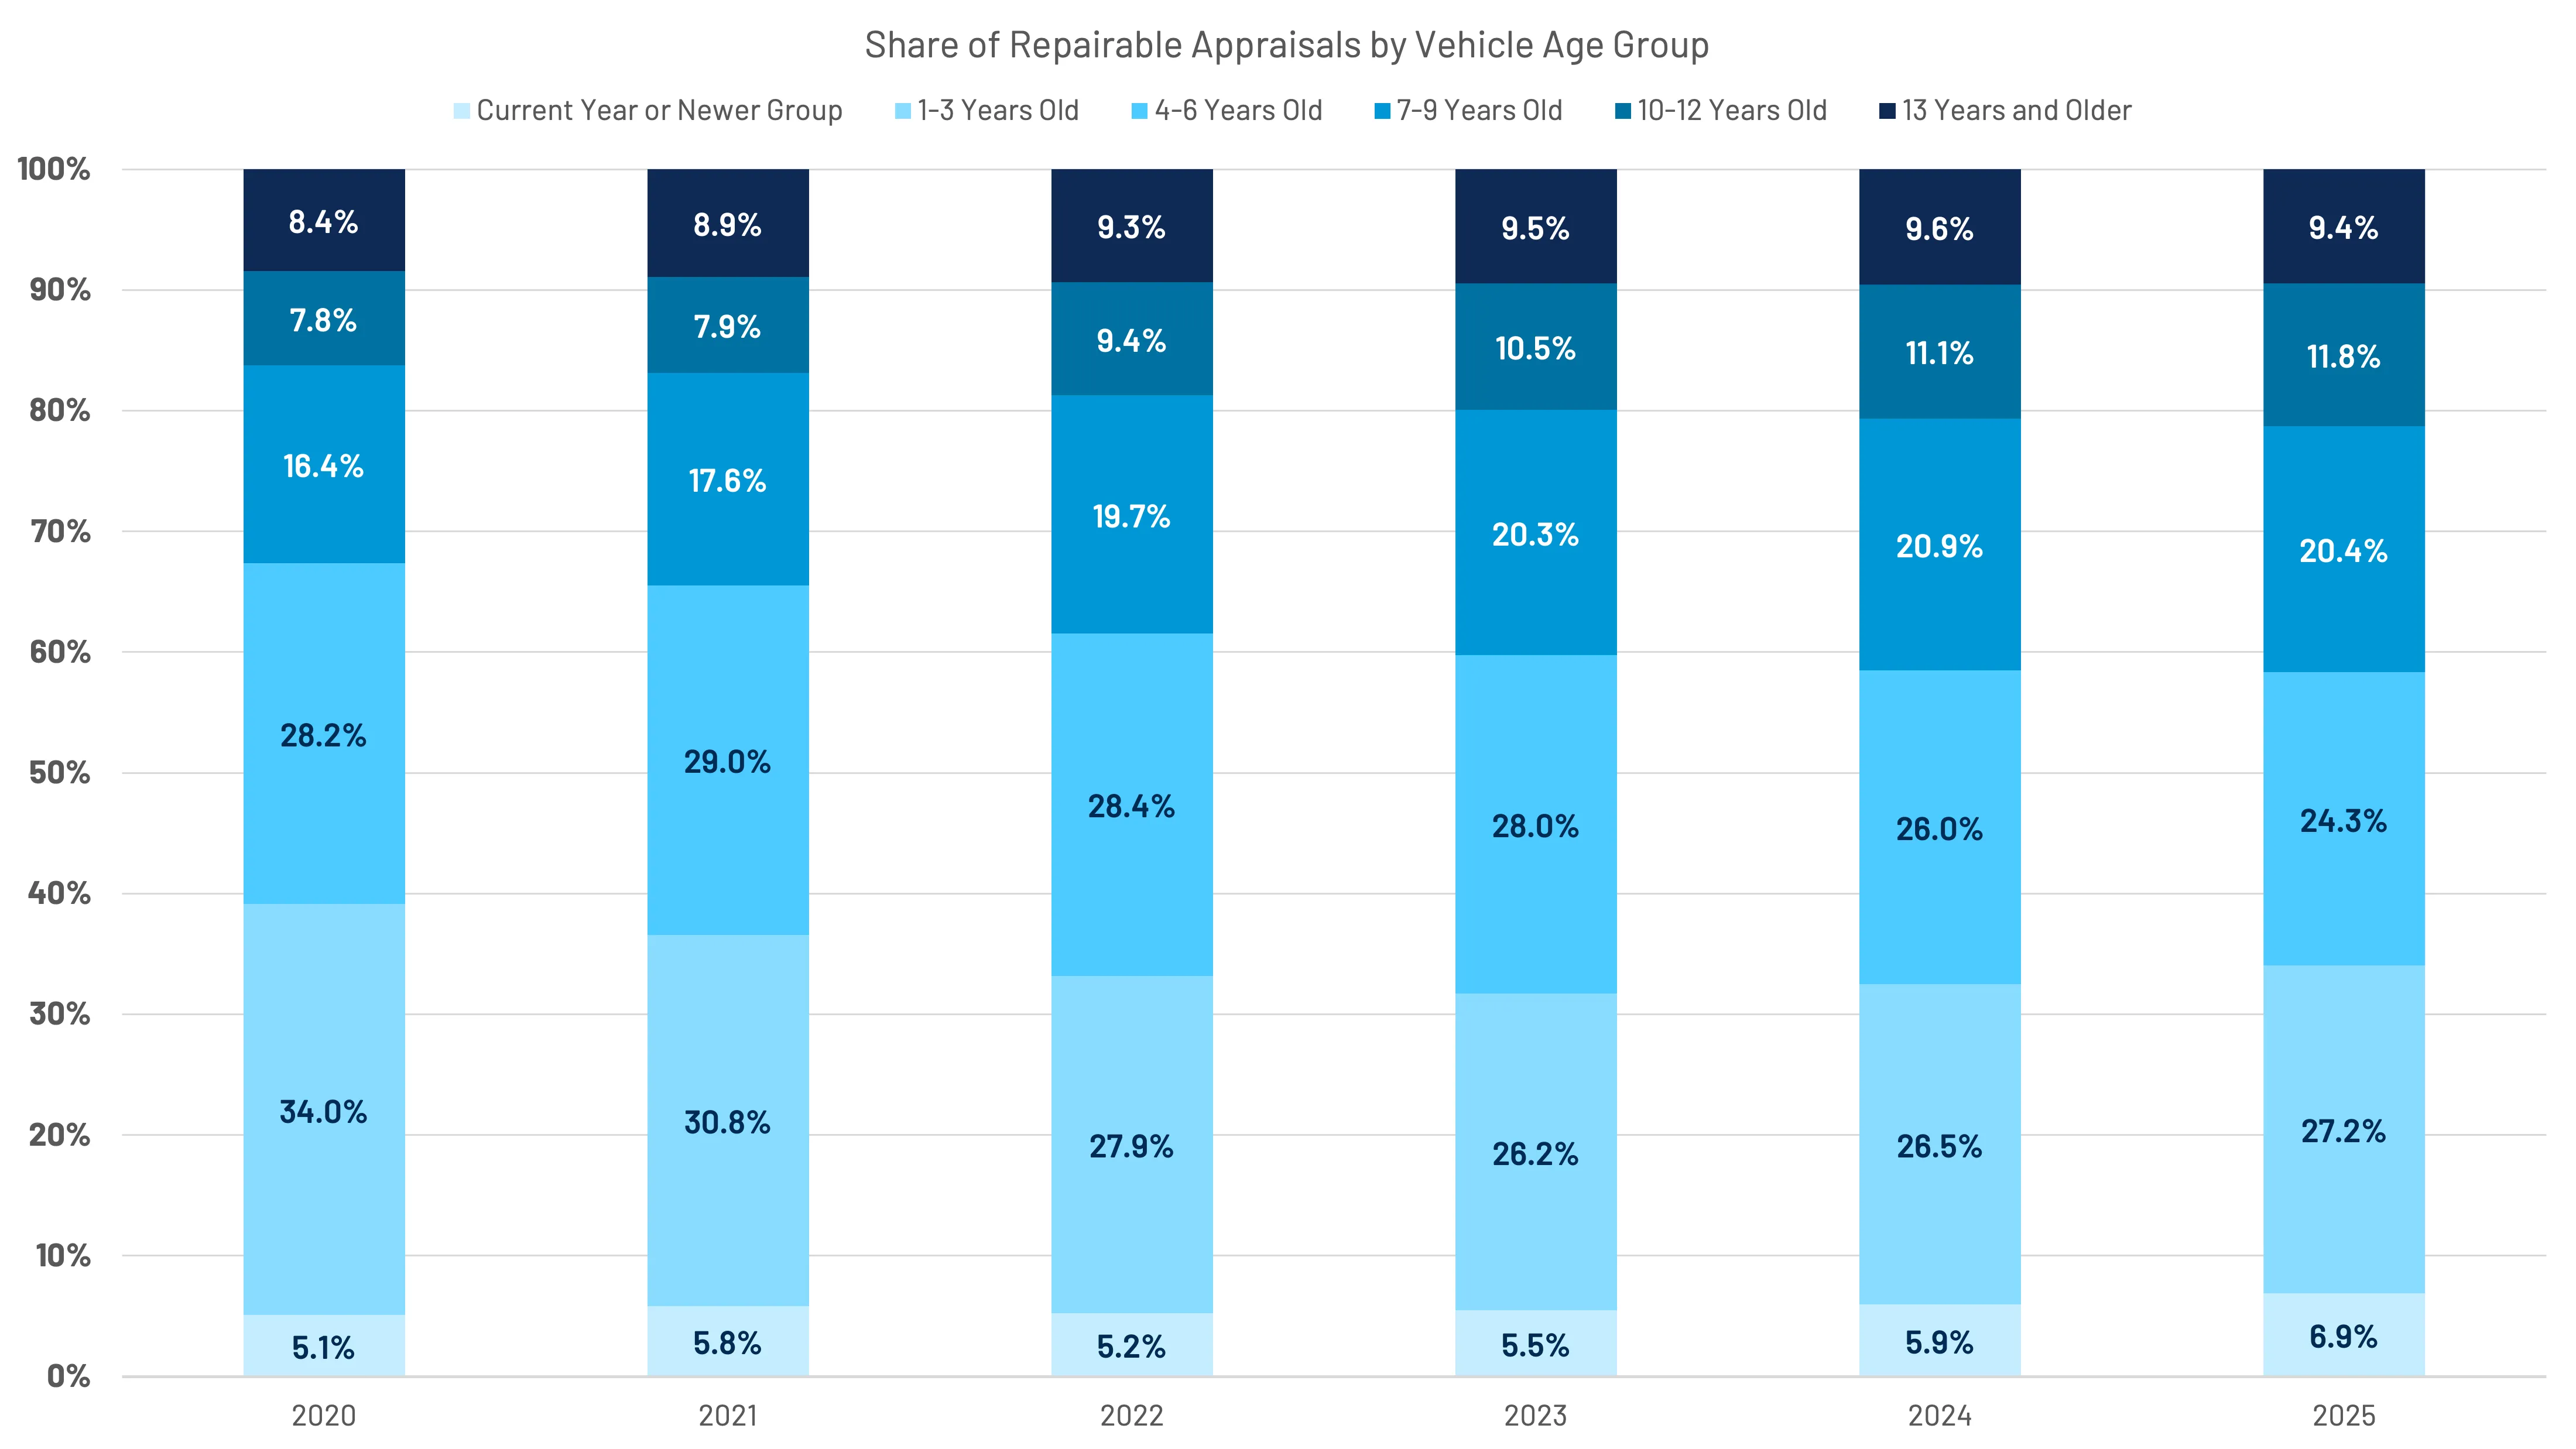
As we observed with total loss, repairable claims have experienced an increase in share amongst the 7- to 9-year-old and 10- to 12-year-old vehicle groups. Since 2020, those groups have increased in share by 7.6 percentage points. Vehicles 1-3 and 4-6 years old have seen a 9.3 percentage point decrease since 2020, driven primarily by diminished new vehicle sales since 2020. (Figure 48) Modest increases in new vehicle sales since 2023 are reflected in the mix, though, once again, very modest indeed.
Collision claims generally are more biased towards newer vehicles. Repairable collision claims mix has seen the share of 7- to 9-year-old and 10- to 12-year-old vehicles each increase by 4 percentage points since 2020, while vehicles in the 1- to 3-year-old and 4- to 6-year-old segments have seen share decline by 6.9 and 4.0 points, respectively.
To put this into perspective, the share of repairable collision claims six years old or newer represented over 67% of collision repairables in 2020 and almost 66% in 2021. In 2025, these vehicles represented 58.3%, a 9-percentage point swing since 2020. (Figure 49)
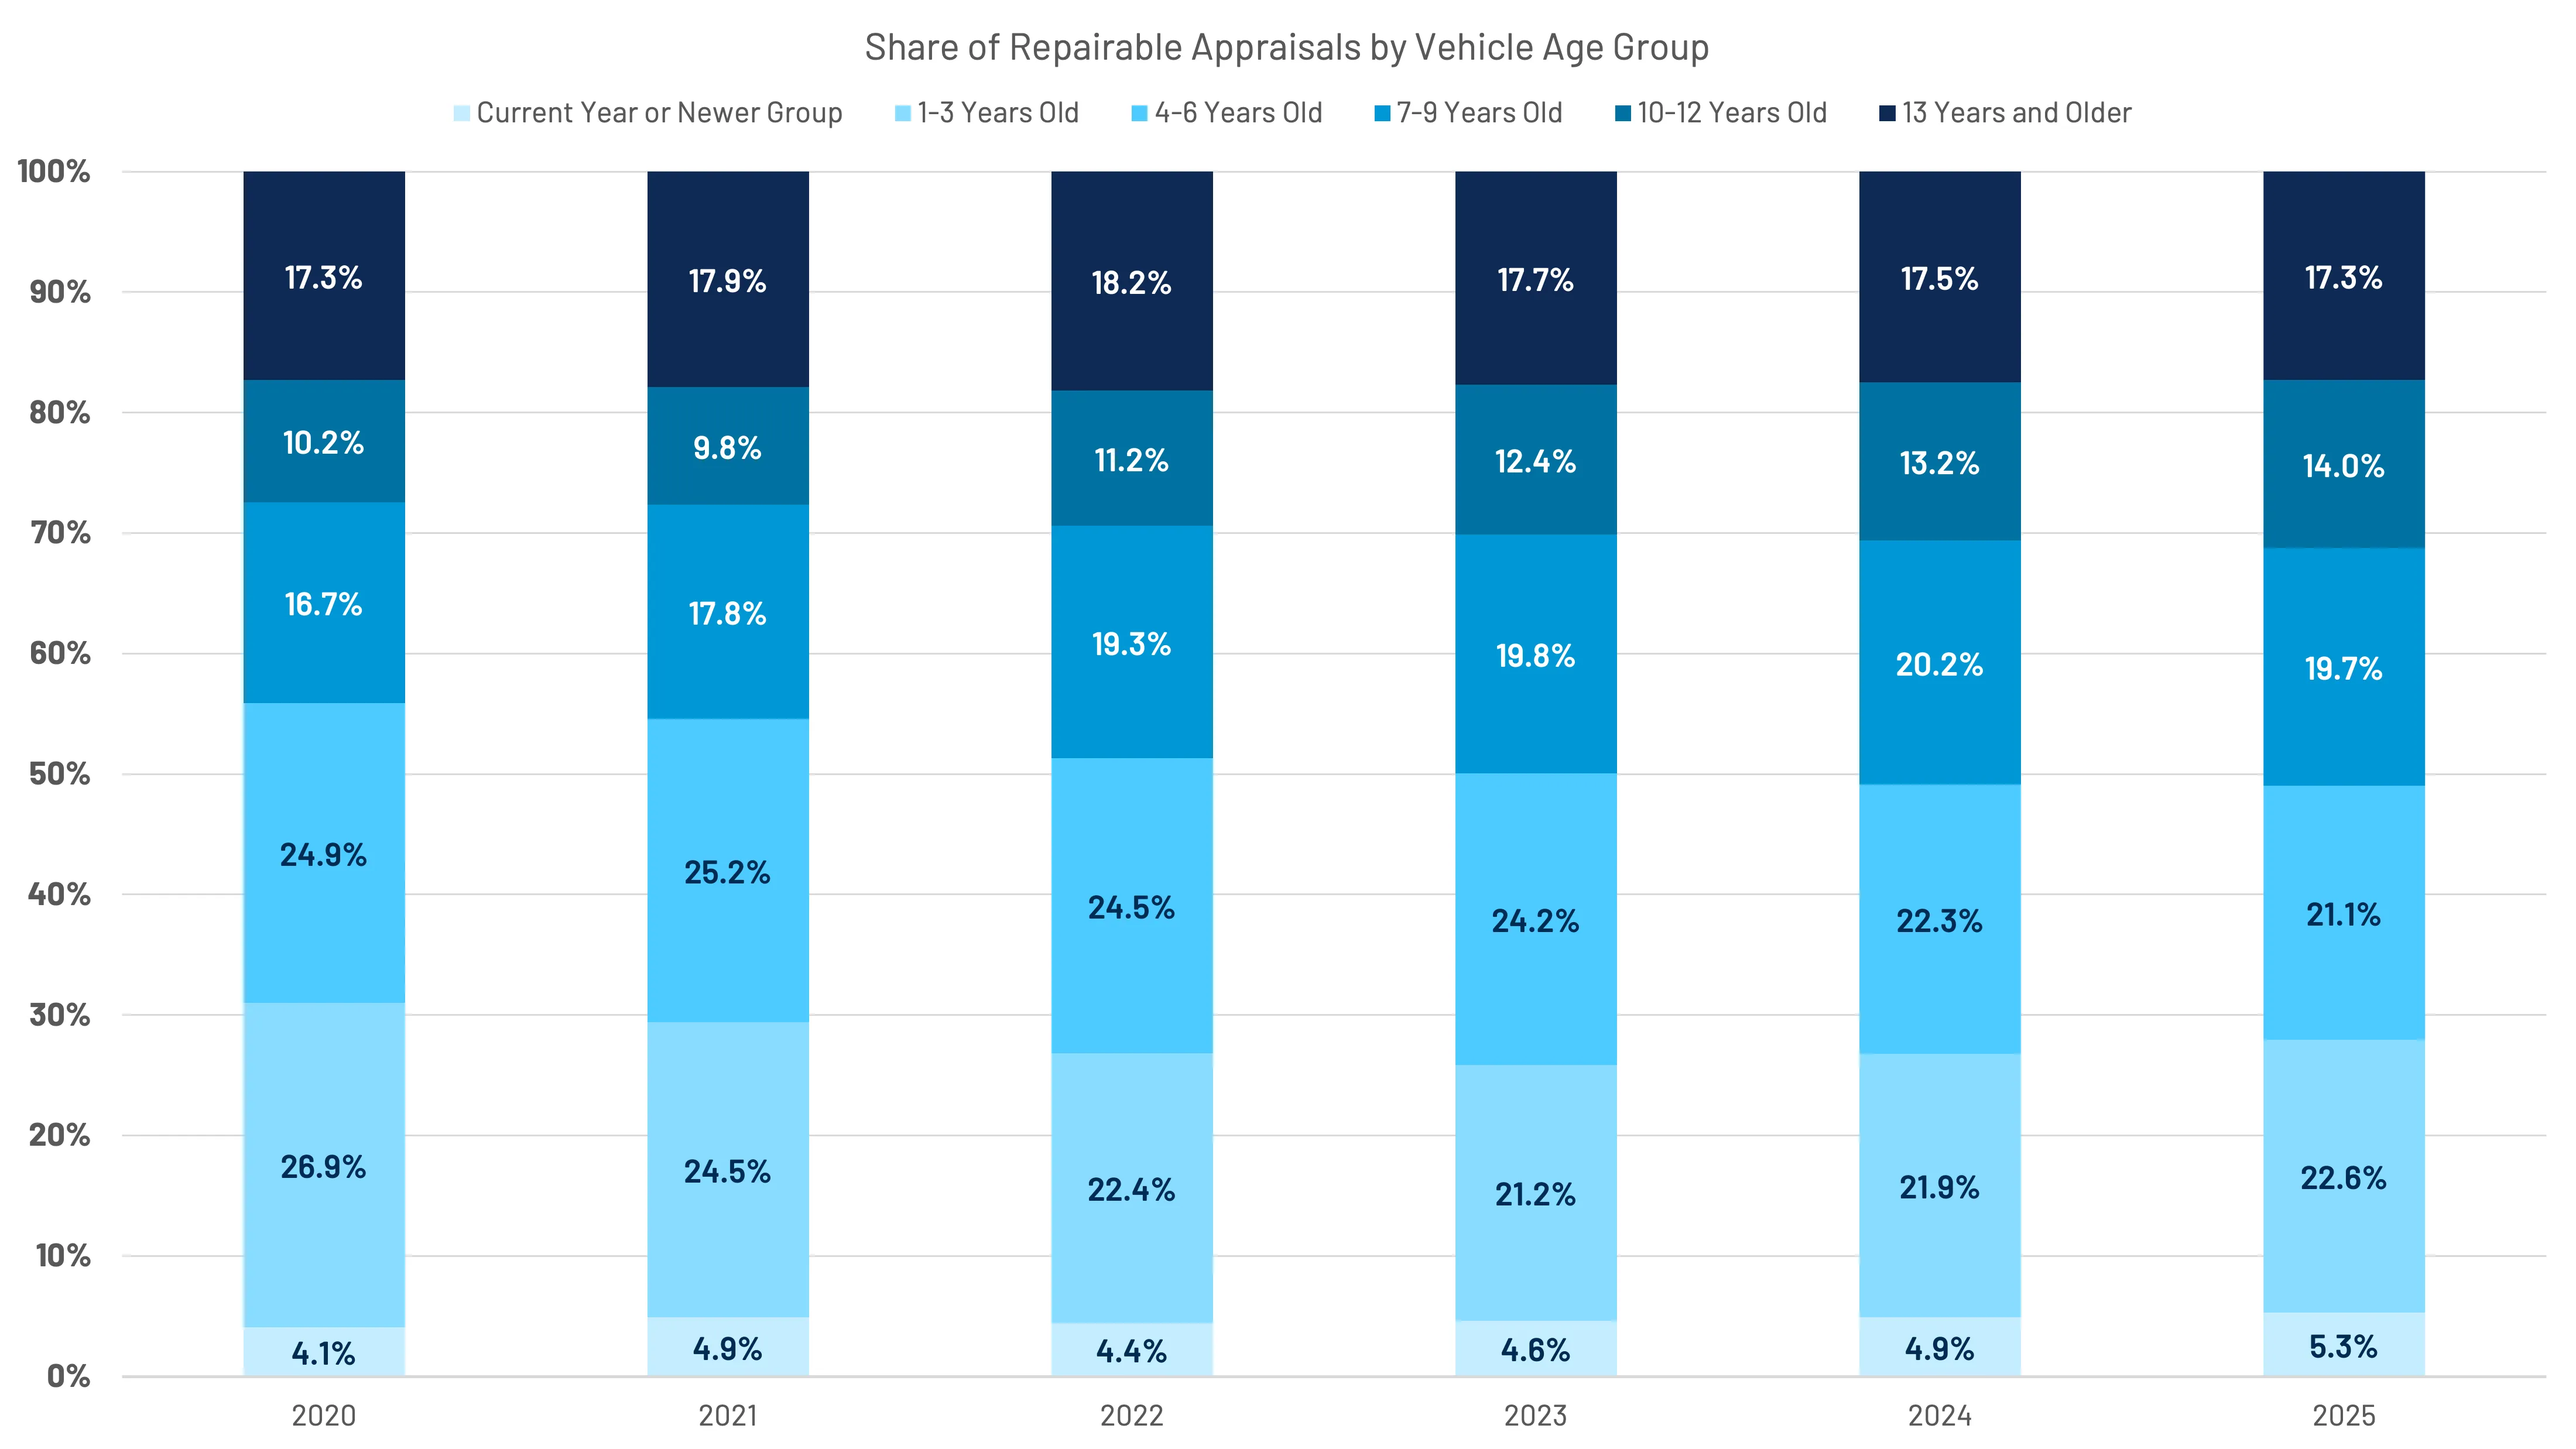
Liability remains a better litmus test for auto physical damage claims, as these tend to be claims least affected by consumer behavior, except for consumers going uninsured. More often than not, liability claims get filed. Liability claims for vehicles 6 years or newer are down 6.9% relative to 2020, representing 55.9% of the mix in 2020, down to 49% in 2025.
Mix shifts for vehicles across age segments have been less significant than with collision claims and are generally more balanced between age segments than collision claims, as discretion typically does not play into claim filing rationale. (Figure 50)
Cycle times have continued to improve, year-over-year, through the fourth quarter. Fourth quarter cycle times are generally longer than Q2 and Q3, which appears to be following suit based on 2025 preliminary results. (Figure 51)
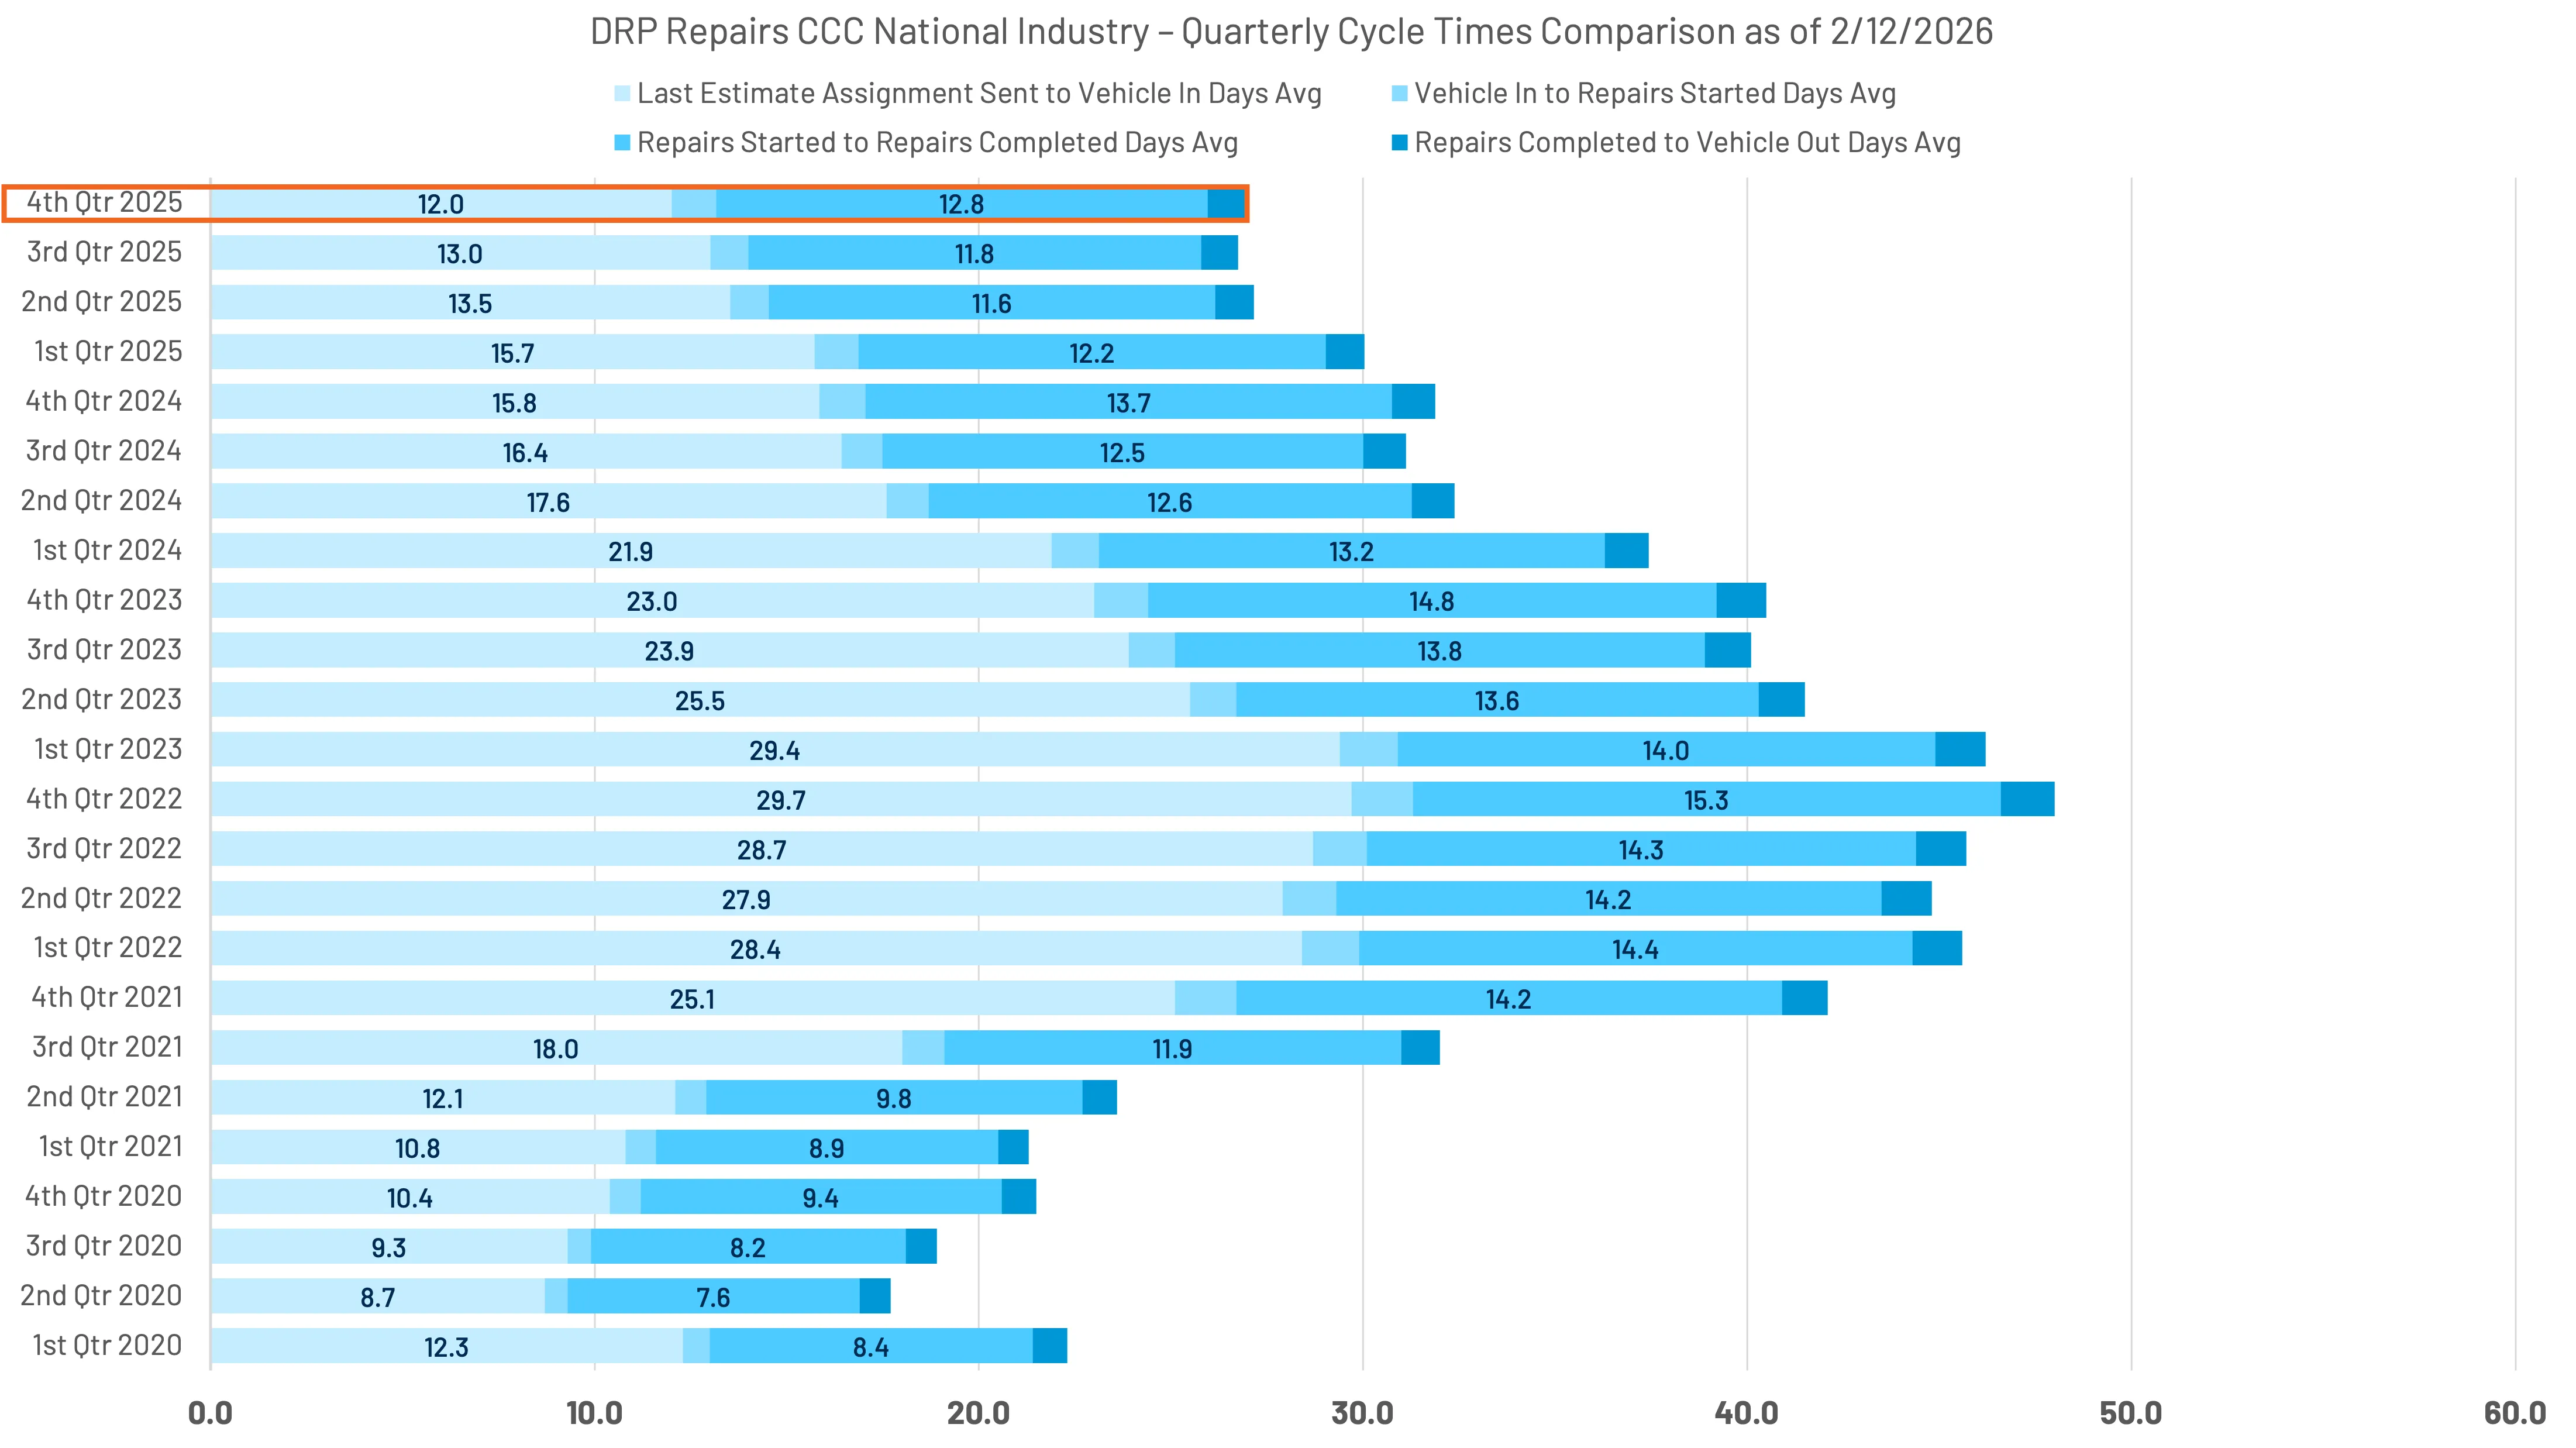
As indicated in overall cycle time results, last estimate sent to vehicle in days average continues to trend down - a common occurrence since peaking in Q4 2022, at almost 30 days.
Crash Network's most recent survey indicates a backlog of 1.7-1.8 weeks over the past four quarters. The average backlog for Q1 2026 is -0.8 weeks year-over year, almost half of the 1.4 week year-over-year backlog decline, the survey revealed in Q1 2025. On a weekly basis, CCC's last estimate sent to vehicle in days average is ~2.2 weeks. (Figure 52)

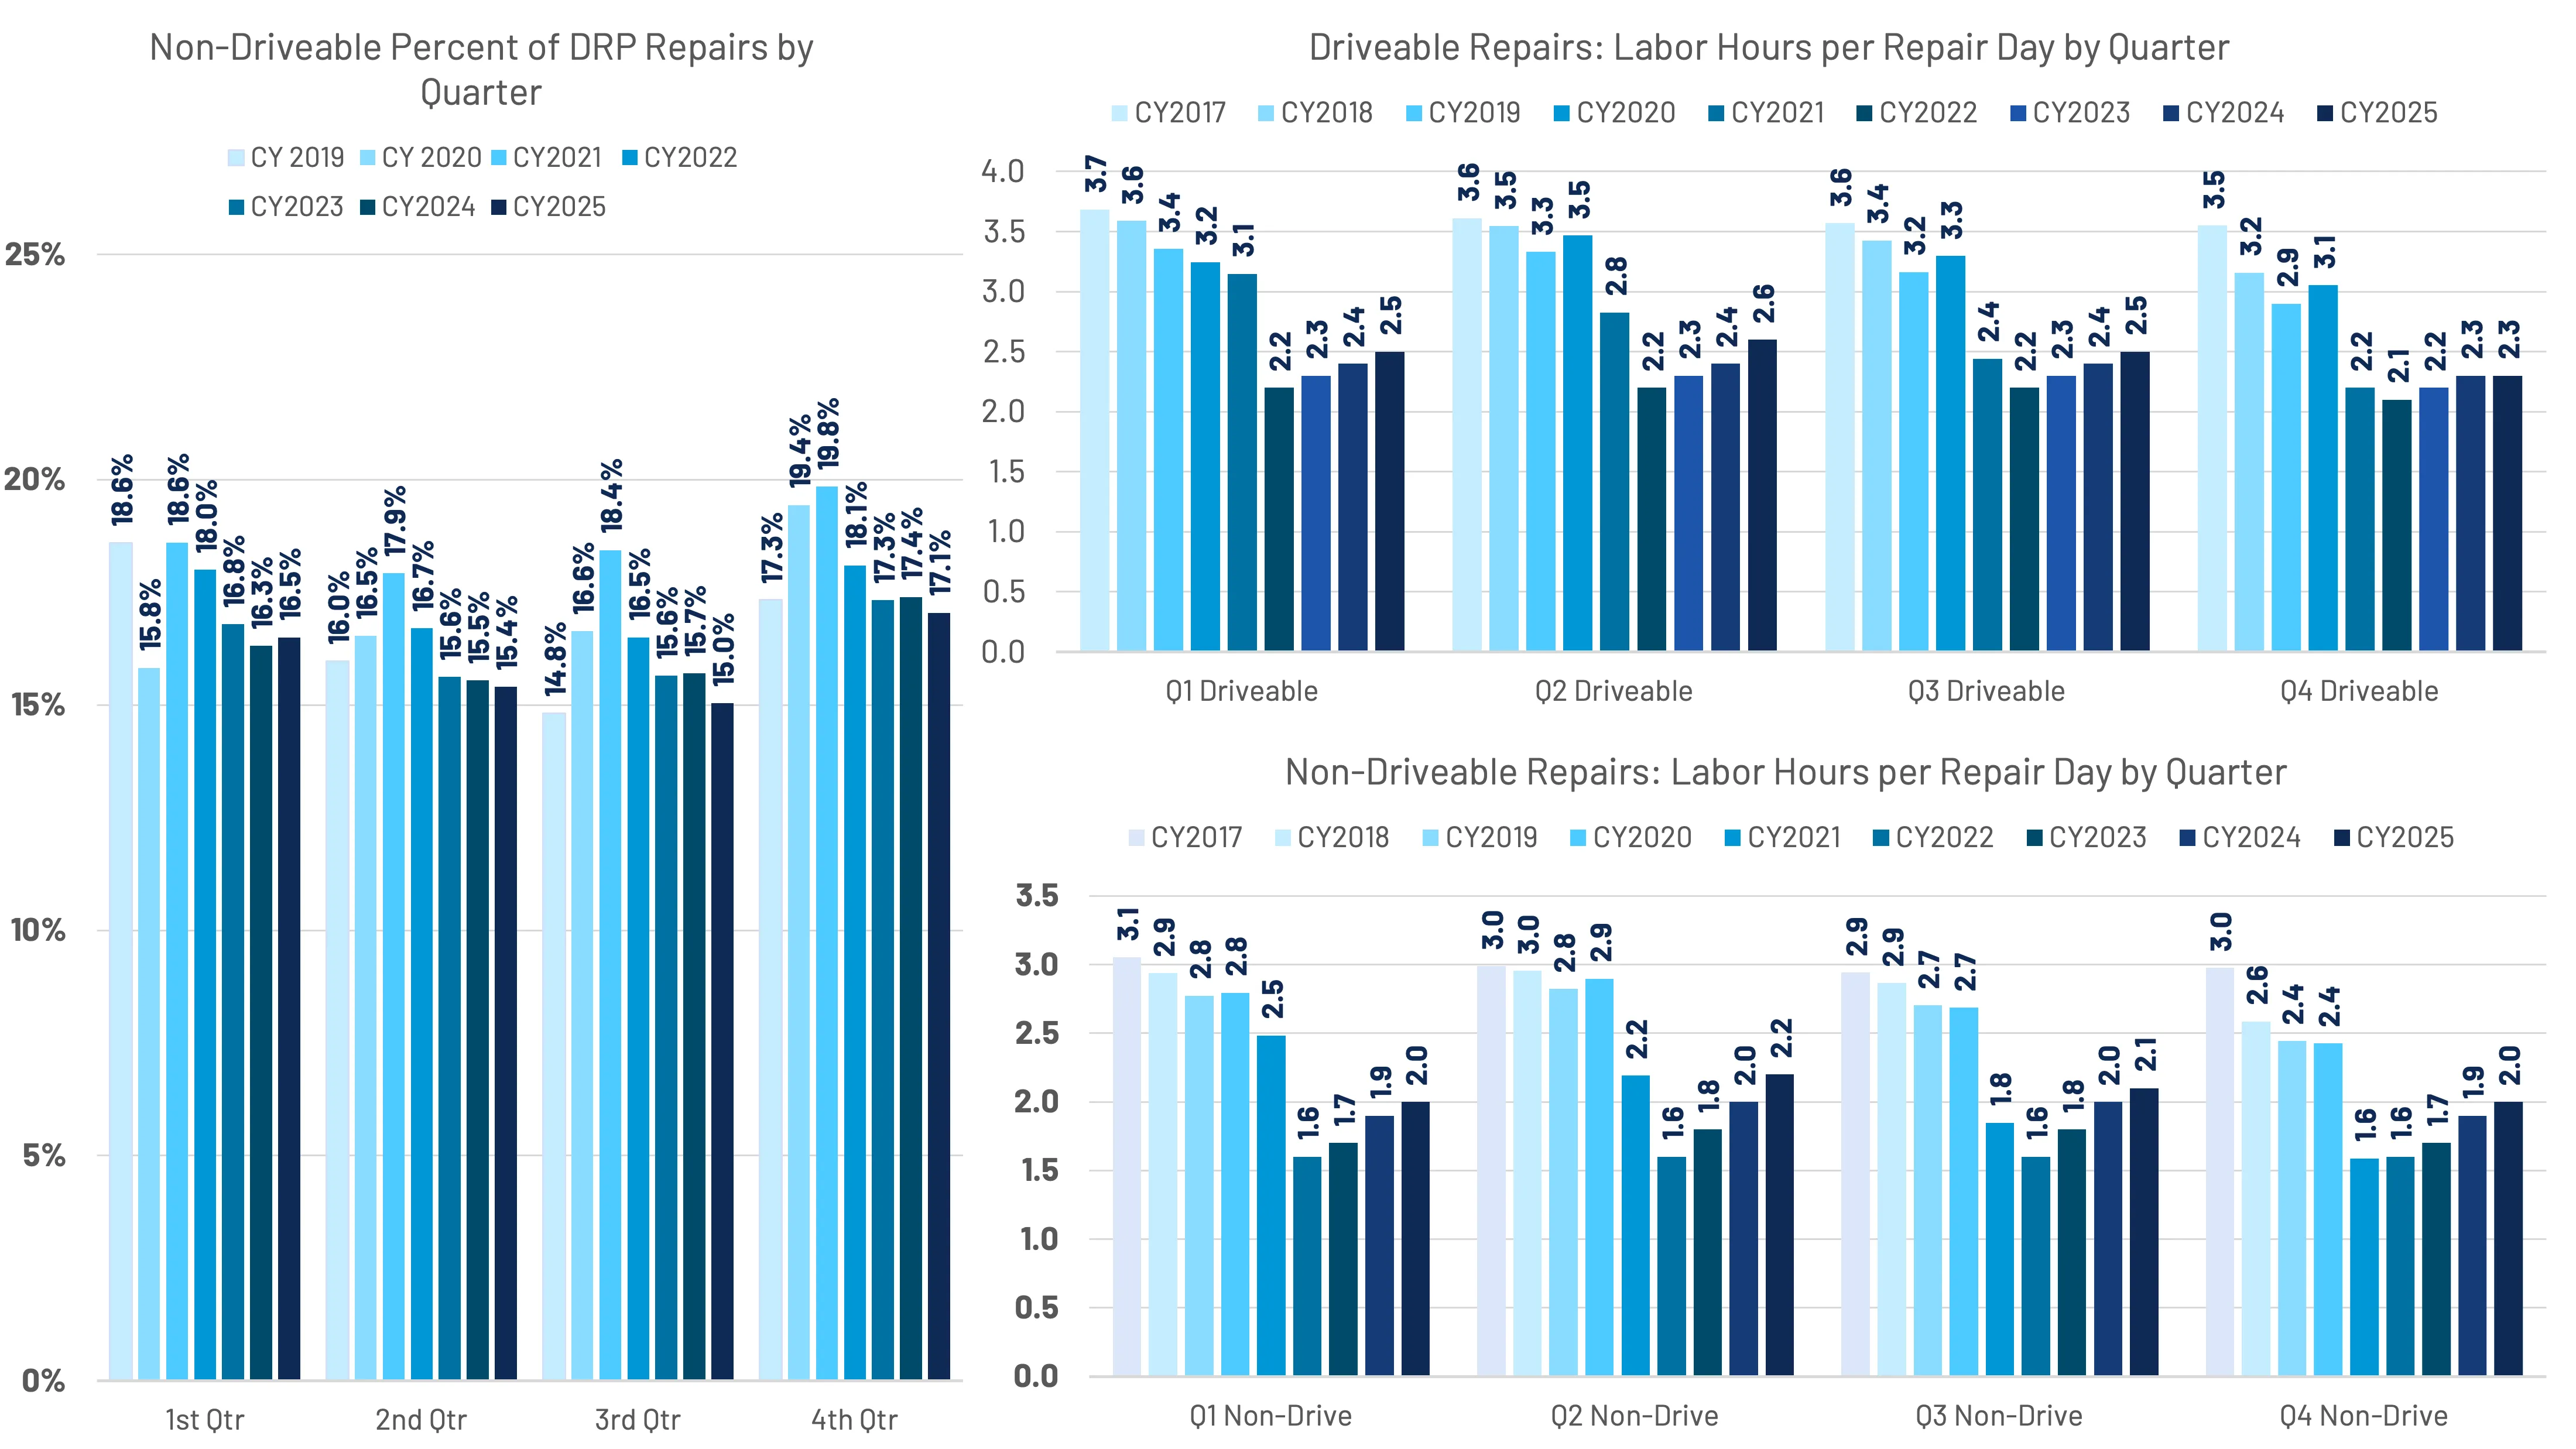
Shop productivity for both driveable and non-driveable vehicles continues to slowly improve year-over-year. (Figure 53)
Importantly, while many 2025 repair metrics reflect technology and fleet mix dynamics, the broader cost environment cannot be evaluated in isolation. Parts pricing, labor trends, and consumer repair decisions sit within a wider economic context – one increasingly influenced by inflationary pressure, trade policy, and tariff uncertainty. To fully understand the trajectory of repair costs, we now turn to the macroeconomic layer shaping the industry.

Layered on top of repair complexity is the broader macroeconomic environment marked by inflationary aftershocks, shifting trade policy, and elevated political uncertainty. These external forces have a far-reaching impact on consumer confidence and behaviors, and pricing and availability of vehicles and parts, which can ultimately impact insurer and repairer profitability.
The new administration’s fluid and evolving policies elevated uncertainty, affecting foreign policy and the global economy, domestic policy and household economics. This was especially evident in the frequency of adjustments to tariffs, which dominated discussions throughout much of 2025.
With the recent Supreme Court decision overturning tariffs under the International Emergency Economic Powers Act (IEEPA), the legal basis of the Administration's 2025 executive orders concerning fentanyl trafficking and the reciprocal tariffs were stifled. The judgement was followed by the administration’s announcement of a new 10% tariff on all goods imported into the U.S. from all countries under Section 122 of the 1974 Trade Act.
These tariffs will be in effect for 150 days under the law. And, within 24 hours of this announcement, the administration increased the 10% blanket tariff to its legal maximum of 15%. It seems that the fluid uncertain trade environment will continue.
The implication isn’t just volatility – it's cost transmission into the household and business economy.
According to the Yale Budget Lab, the overall pre-substitution effective tariff rate was 16% prior to the Supreme Court ruling, which dropped the effective rate to 9.1%. If the 15% tariffs are extended after their 150-day limit (by congressional approval), the effective rate would increase to 13.7%. The 15% tariffs are expected to cost American households $600-800 if they last the full 150 days; if they are made permanent, households would see costs increase to $1,000 - $1,300.
The Federal Reserve Bank of New York found that the average tariff rate on U.S. imports increased from 2.6% to 13% in 2025.
The NY Fed found in their study on the effects of the first Trump Administration's 2018-2019 tariffs were fully borne by the U.S. (importers, consumers), meaning that (foreign) exporters had not decreased prices to offset some of the costs. A similar analysis on the 2025 tariffs indicate that exporters are bearing some of the costs (6% January - August; 8% September - October; and 14% in November). This means that over 90% of the tariff burden through October fell on U.S. firms and consumers.
The Wall Street Journal analyzed two major studies - one from the Federal Reserve Bank of San Francisco and another from Northwestern University – finding that past tariff increases did not lead to large spikes in inflation. In some cases, tariffs even slowed price growth. Both studies agreed that tariffs reduce consumer and business demand, which helps explain why inflation hasn't surged as some expected. Economic uncertainty and slower growth lead to less demand for goods and services, which can offset price increases from higher import costs.
Another notable finding was that actual tariff rates are lower than headline numbers. Loopholes and exemptions meant that companies often paid less than the official tariff rates. A recent working paper by economists Gita Gopinath (Harvard) and Brent Neiman (University of Chicago) found the real average tariff rate was 14.1% in late September, compared to the headline rate of 27.4%.
Some economists warned that tariffs could have a bigger effect on inflation over time as companies gradually raise prices. Others note that today’s economic environment is very different from past eras of high tariffs.
Much of the analysis of tariffs at this junction seems more political than economic, as the landscape is likely to continue shifting in the wake of the Supreme Court's decision and the reaction from an executive branch. With 2026 mid-term elections just around the corner, the political calculus will undoubtedly hinge on the actual and perceived effects of tariffs and other policies on the economy and household affordability, economic strength (jobs, GDP), and inflation.
Any analysis of tariffs at this junction is likely to remain fluid, influenced by both legal rulings and electoral dynamics. What matters most for the insurance ecosystem is not the specific tariff percentage at any given moment, but the broader effect of sustained uncertainty.
Inflationary pressure, affordability strain, volatile trade policy, and uneven economic growth all influence consumer behavior, repair costs, claim severity, and underwriting results. When combined with an aging vehicle fleet, rising vehicle technology complexity, shifting filing behavior, and escalating casualty exposure, macroeconomic volatility becomes yet another layer in an already intricate landscape.

The story of 2025 isn’t a single metric; it's a structural transformation reshaping how the industry operates.
Across the industry, lower-severity claims reporting is becoming increasingly discretionary. Higher deductibles, coverage downgrades, and affordability pressures have thinned the bottom of the severity spectrum, leaving behind a more concentrated mix of higher-cost outcomes. At the same time, participation in the insurance system itself is shifting. Total loss frequency has reached new high-water marks; driveable total losses continue to rise, and bodily injury claims are increasing in both frequency and severity. Compounding these trends is the growing prevalence of uninsured and underinsured motorists, which is increasing the share of claims ultimately falling back onto insured drivers and their carriers.
Meanwhile, the structural composition of the vehicle fleet continues to shift. An aging car parc, fewer newer vehicles sold over the past five years, and increasing embedded technology are compounding repair complexity. Calibrations, diagnostics, part composition, and labor dynamics reflect a repair environment that is more technical – and more variable – than at any other point in the last decade.
Compounding these structural changes is a macroeconomic backdrop defined by inflationary aftershocks, trade volatility, tariff uncertainty, and continued pressure on household budgets. These forces influence everything from claims filing behavior and insurer rate strategy to parts pricing and repair complexity. The result is not just higher costs – it’s greater unpredictability.
The industry trends of 2025 reveal one common theme: complexity is compounding. Fewer claims do not mean less risk – it means the risk that remains carries higher stakes, greater variability, and more financial consequence.
The auto claims and repair ecosystem isn’t navigating and working to adapt to structural shifts in consumer behavior, vehicle composition, casualty dynamics, and macroeconomic conditions that are becoming increasingly interconnected.
As we continue through 2026 and beyond, understanding this convergence is critical, because the question isn’t whether industry complexity will continue to increase – it's how effectively we respond to it.


Disclaimer
© 2026 CCC Intelligent Solutions Inc. All Rights Reserved. The information and opinions in this publication are for general information only, are subject to change and are not intended to provide specific recommendations for any individual or entity. Although information contained herein has been obtained from sources believed to be reliable, CCC does not guarantee its accuracy and it may be incomplete or condensed. CCC is not liable for any typographical errors, incorrect data and/or any actions taken in reliance on the information and opinions contained in this publication.
Note: Where CCC Intelligent Solutions Inc. is cited as source, the data provided is an aggregation of industry data related to electronic appraisals communicated via CCC's electronic network or from total loss valuations processed by CCC. Where CCC Casualty is cited as a source, the data provided is an aggregation of industry data collected from claims data communicated via CCC Casualty’s electronic network.
Intelligent Solutions
Collision Repairers
Our solutions help repairers run more efficient body shop businesses, while making repair decisions simpler and faster.
Insurance Carriers
Our solutions help insurers make more confident decisions earlier, creating intelligent claims experiences that are more connected for their employees and more compassionate for their policyholders.
Auto Manufacturers
Our solutions help auto manufacturers enhance their consumers’ repair experiences, while connecting them to the industry’s largest repair network.