

By Erik Bahnsen – Director of Industry Analytics
Over the last two years, something unusual has been happening inside Personal Auto. While most major lines of business have seen claim frequency drift downward, Bodily Injury (BI) is the outlier – increasing steadily at 11% over the same period. (Figure 1)
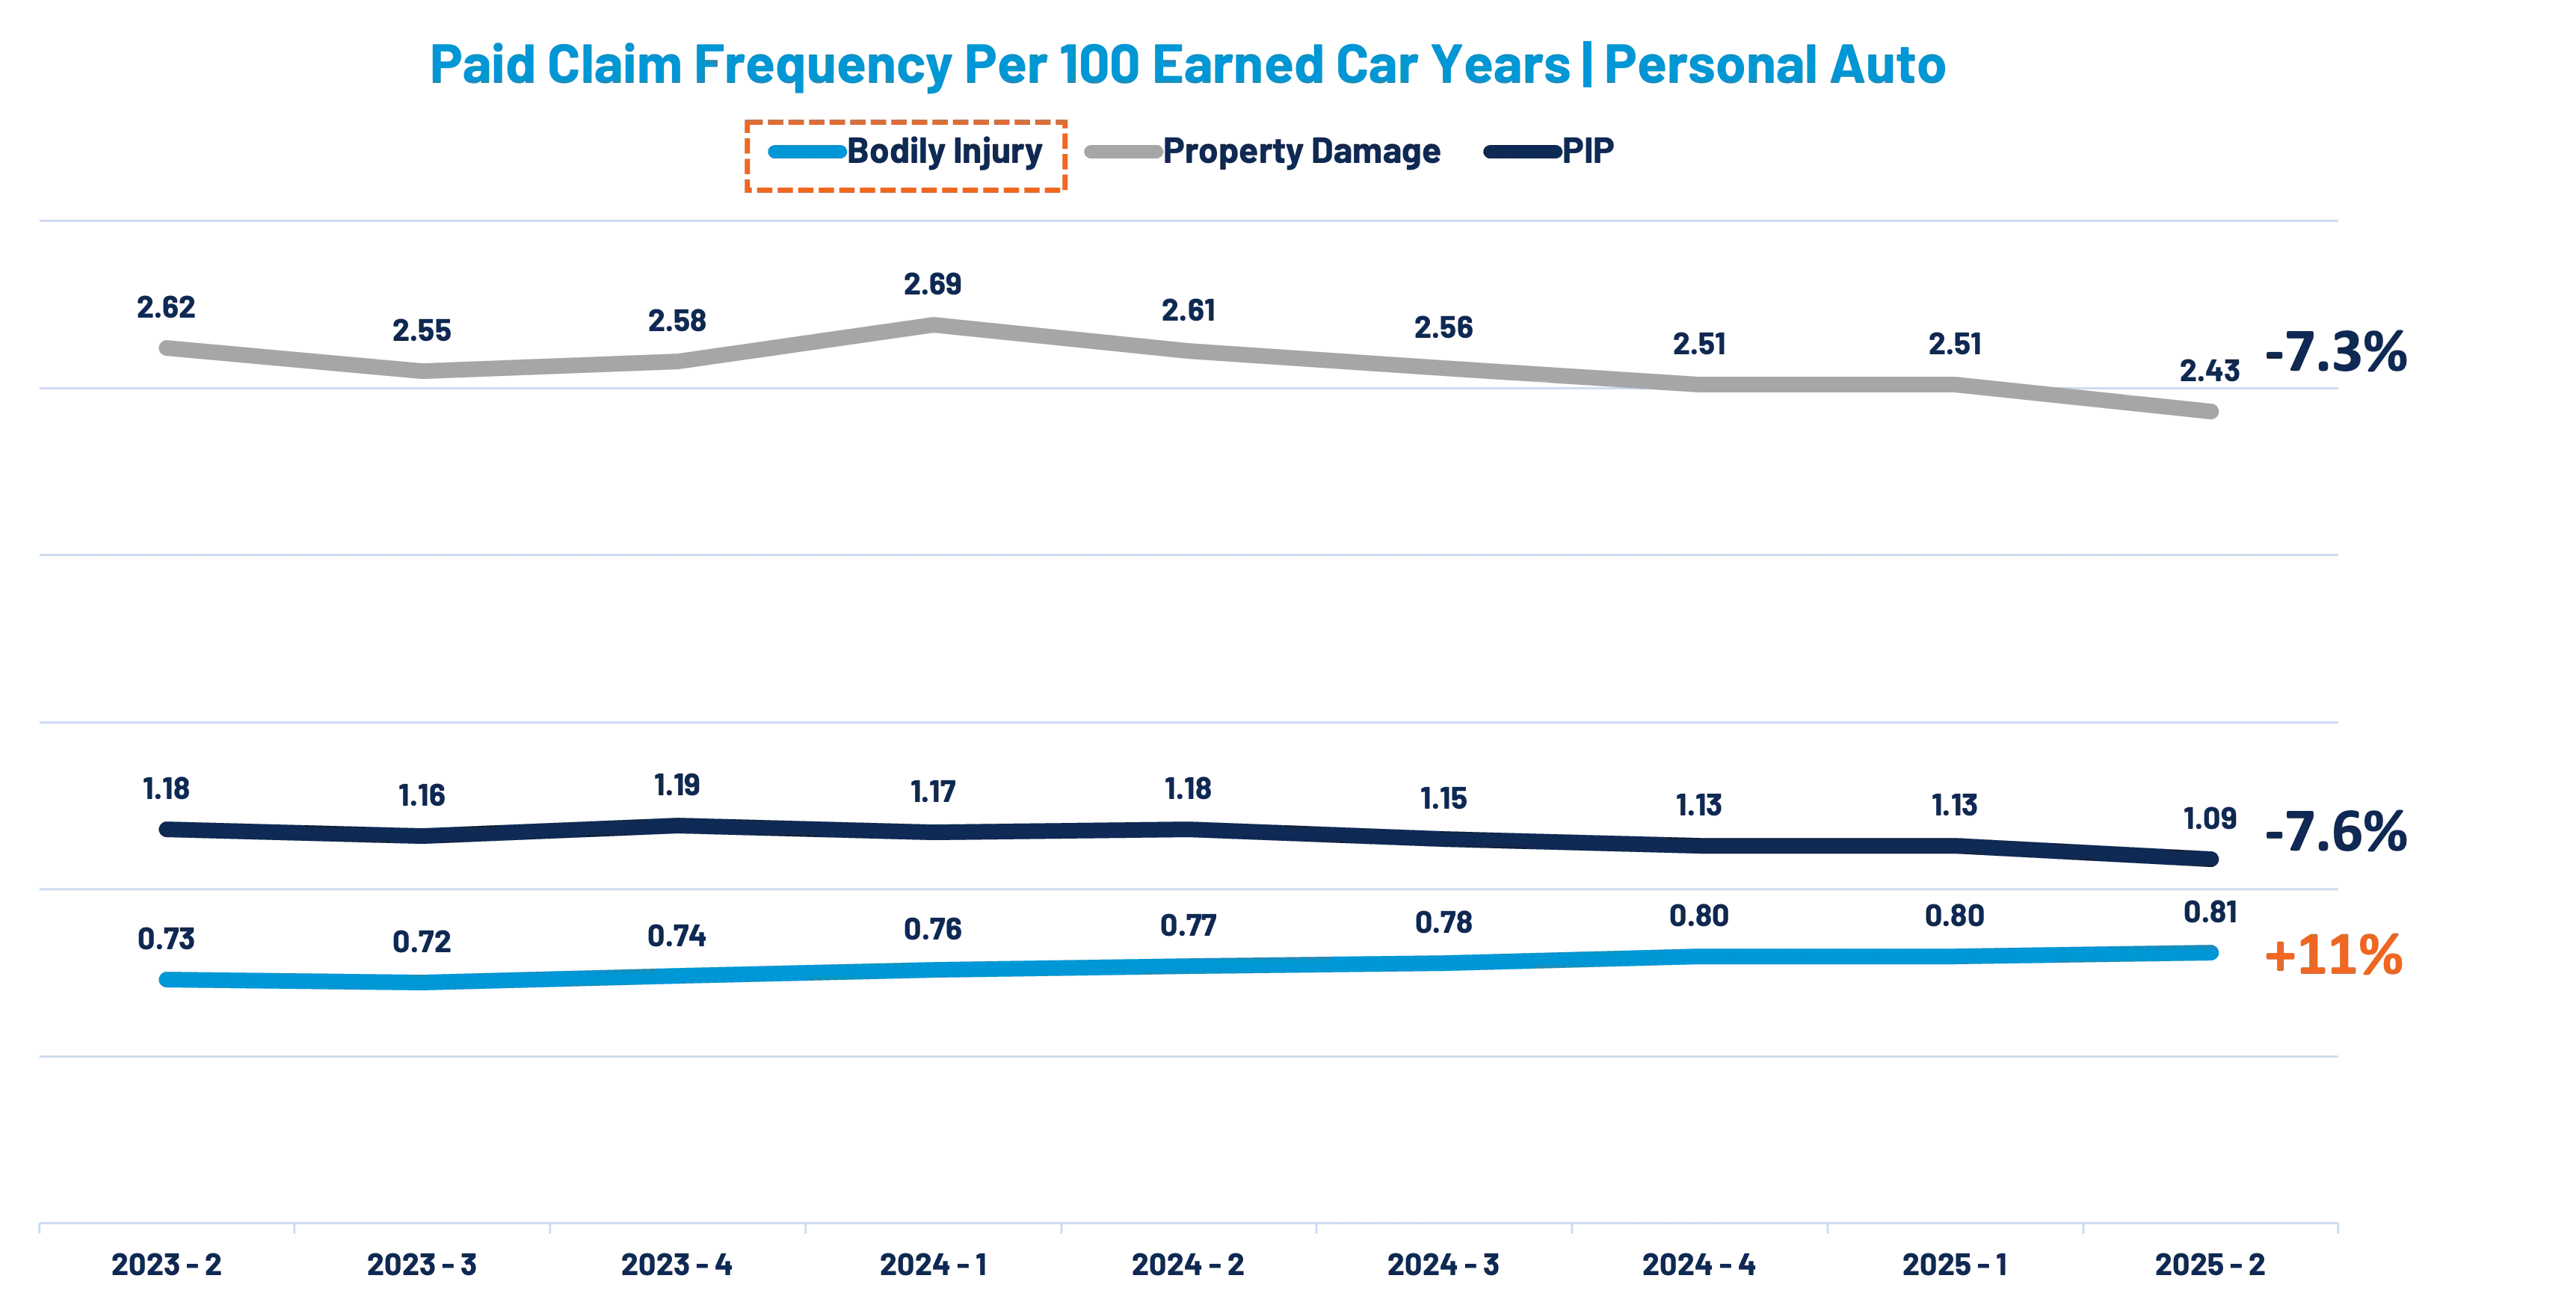
At first glance, the trend is counterintuitive. Property damage exposures are falling. Collision claims are falling. Even personal injury protection (PIP), another injury line of business, is moving in the same downward direction. Yet BI continues to climb.
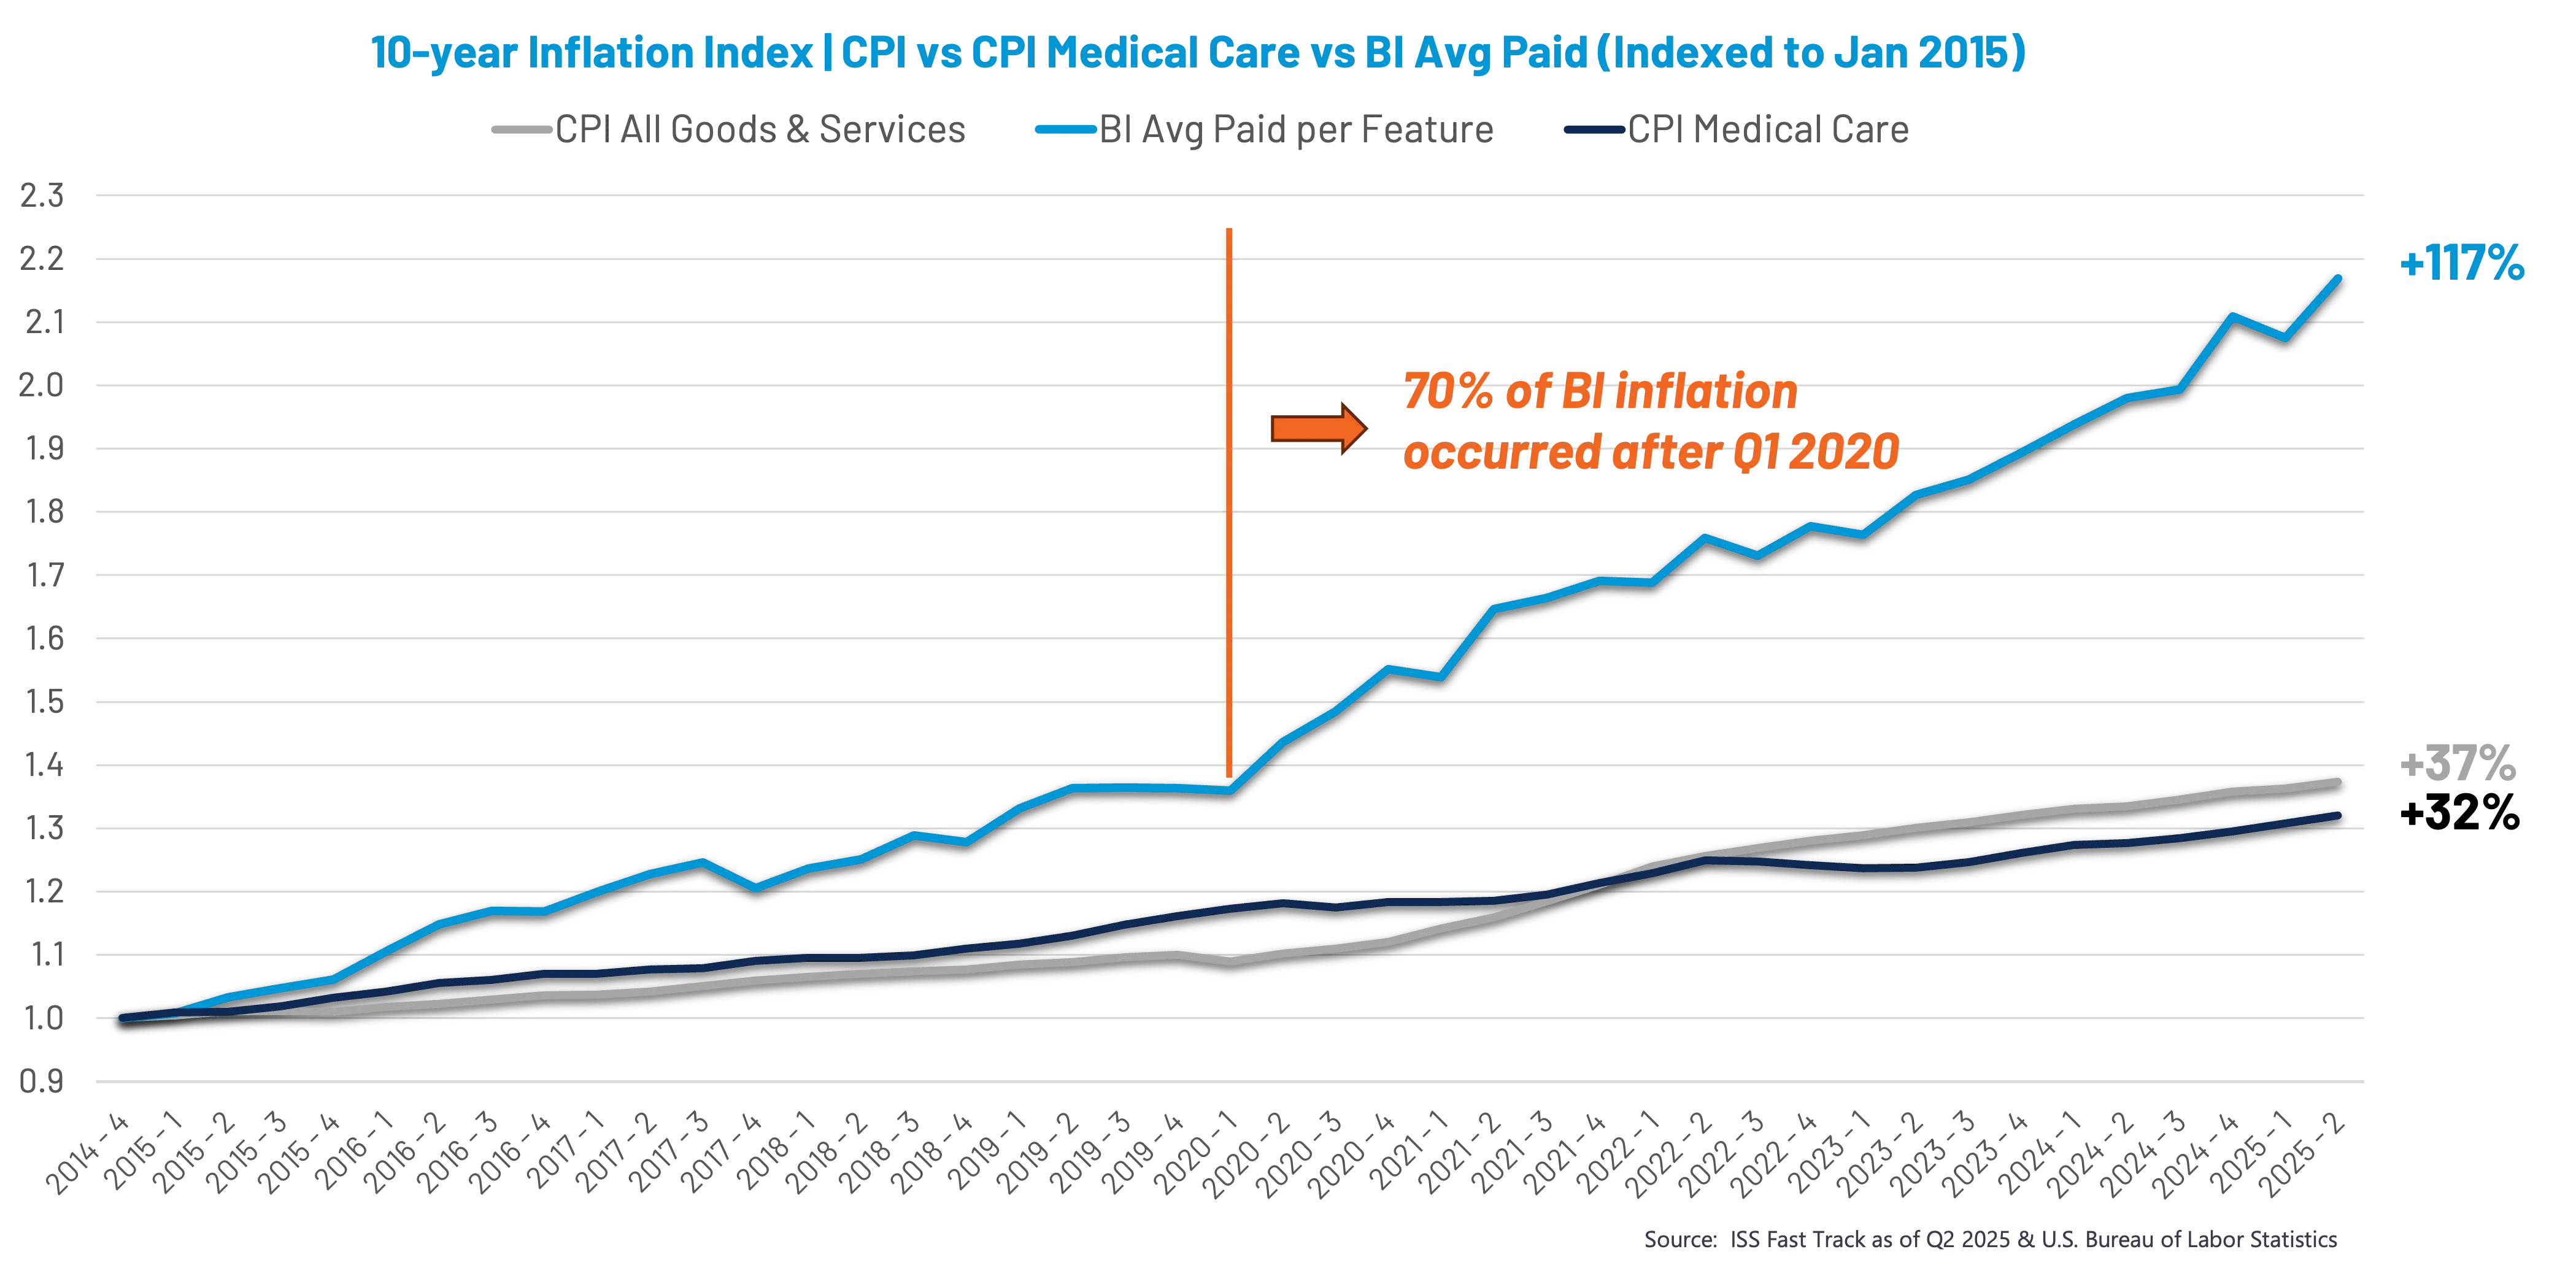
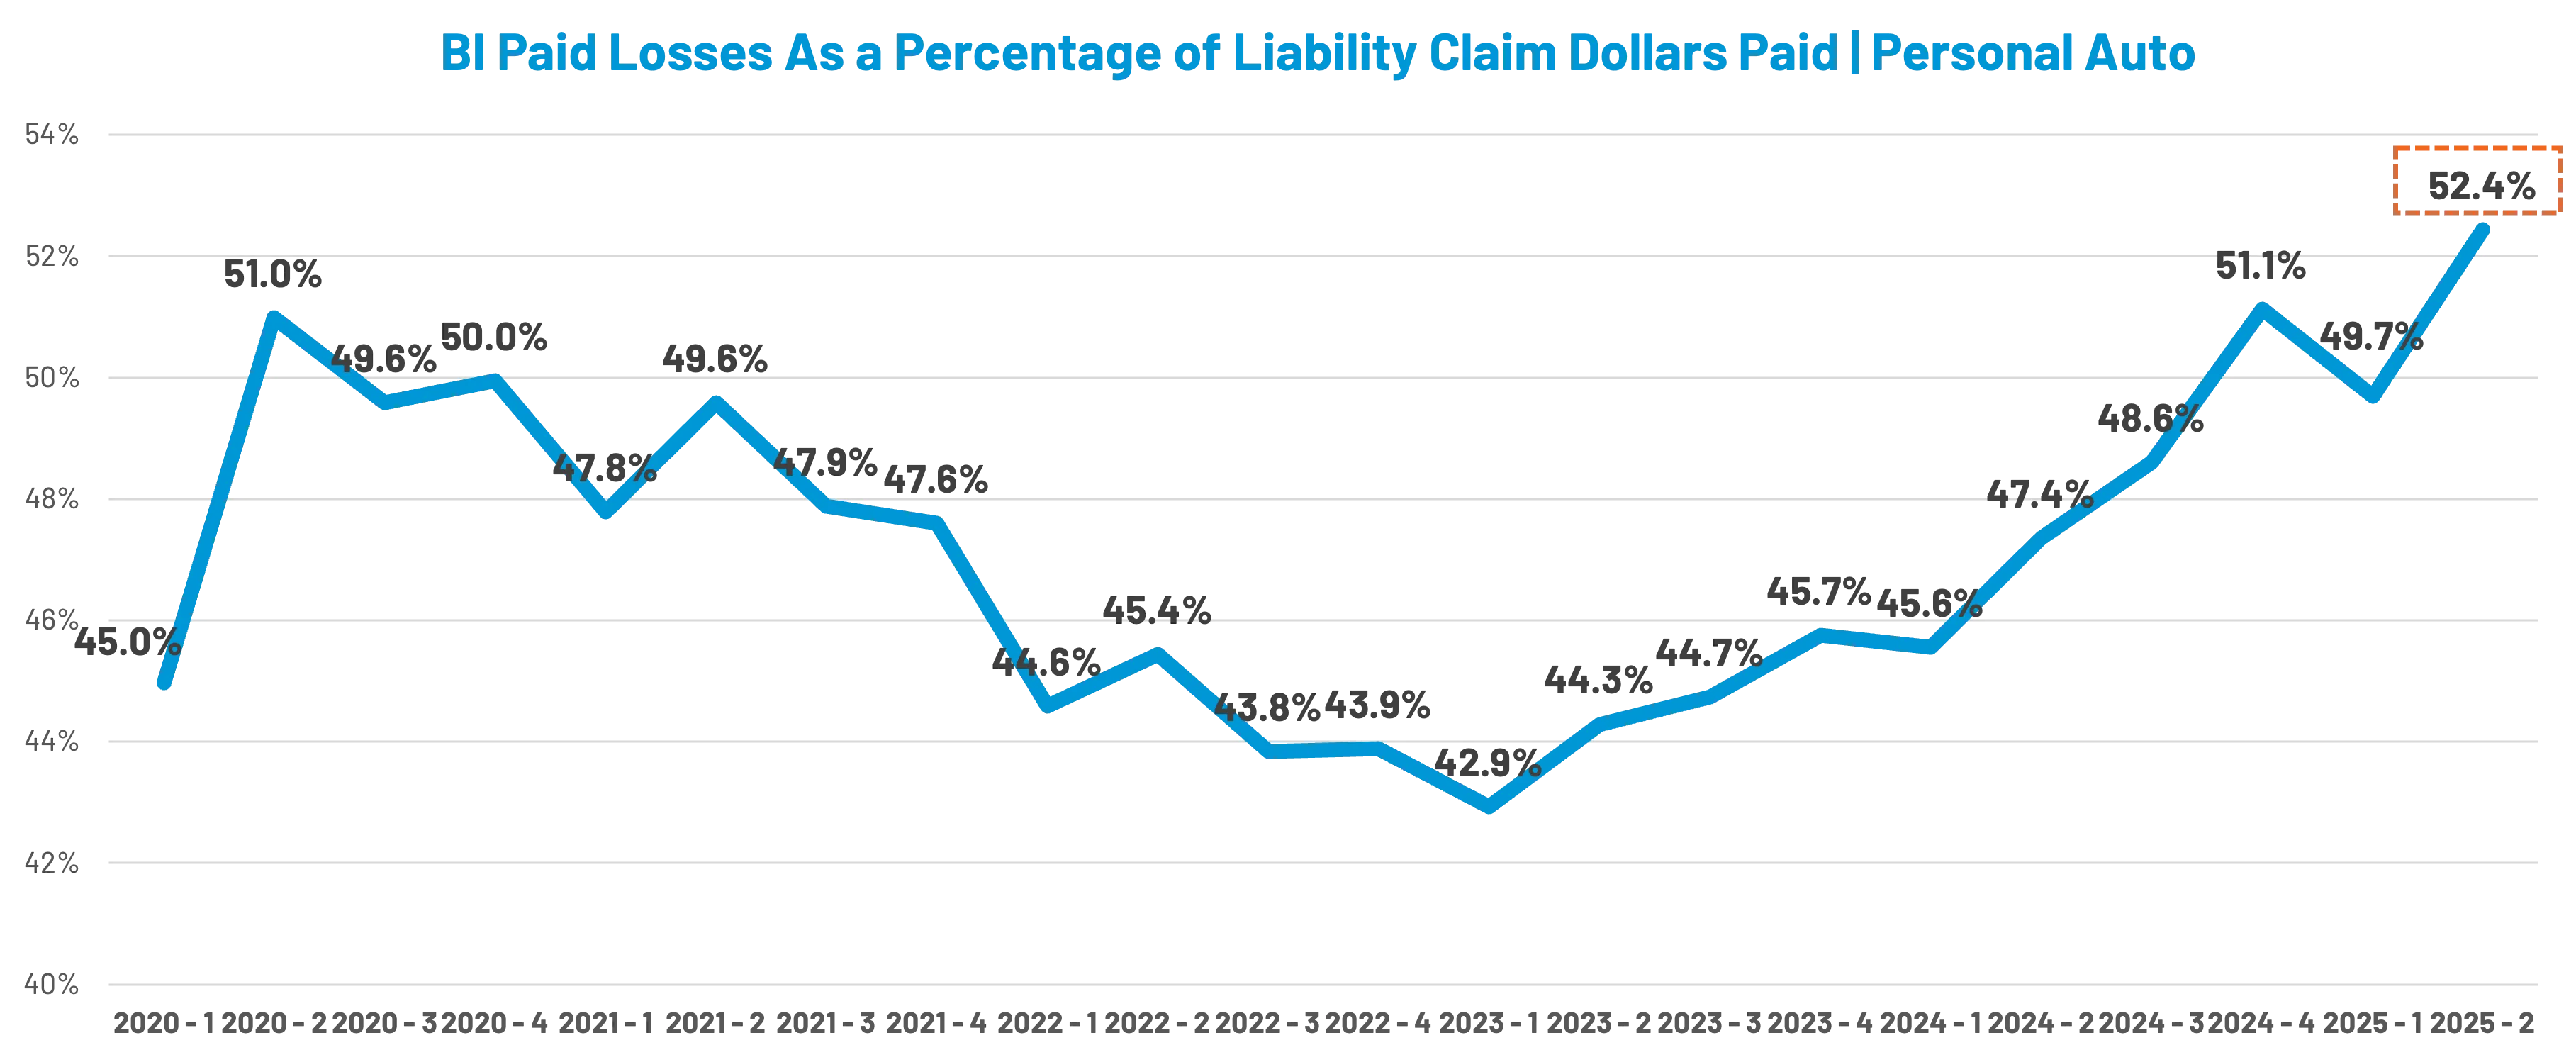
That divergence matters. With per-exposure indemnity costs rising at 3-4 times the rate of general economic inflation (Figure 2) – and BI claim frequency rising in parallel – bodily injury now accounts for 52% of total liability claim dollars paid, despite representing less than one in four property damage exposures. (Figure 3) It's a new high-water mark for a line already vulnerable to overpayment risk tied to unrelated, unverified, or inflated injury claims.
Looking Back to Look Forward: A 10-Year Frequency View
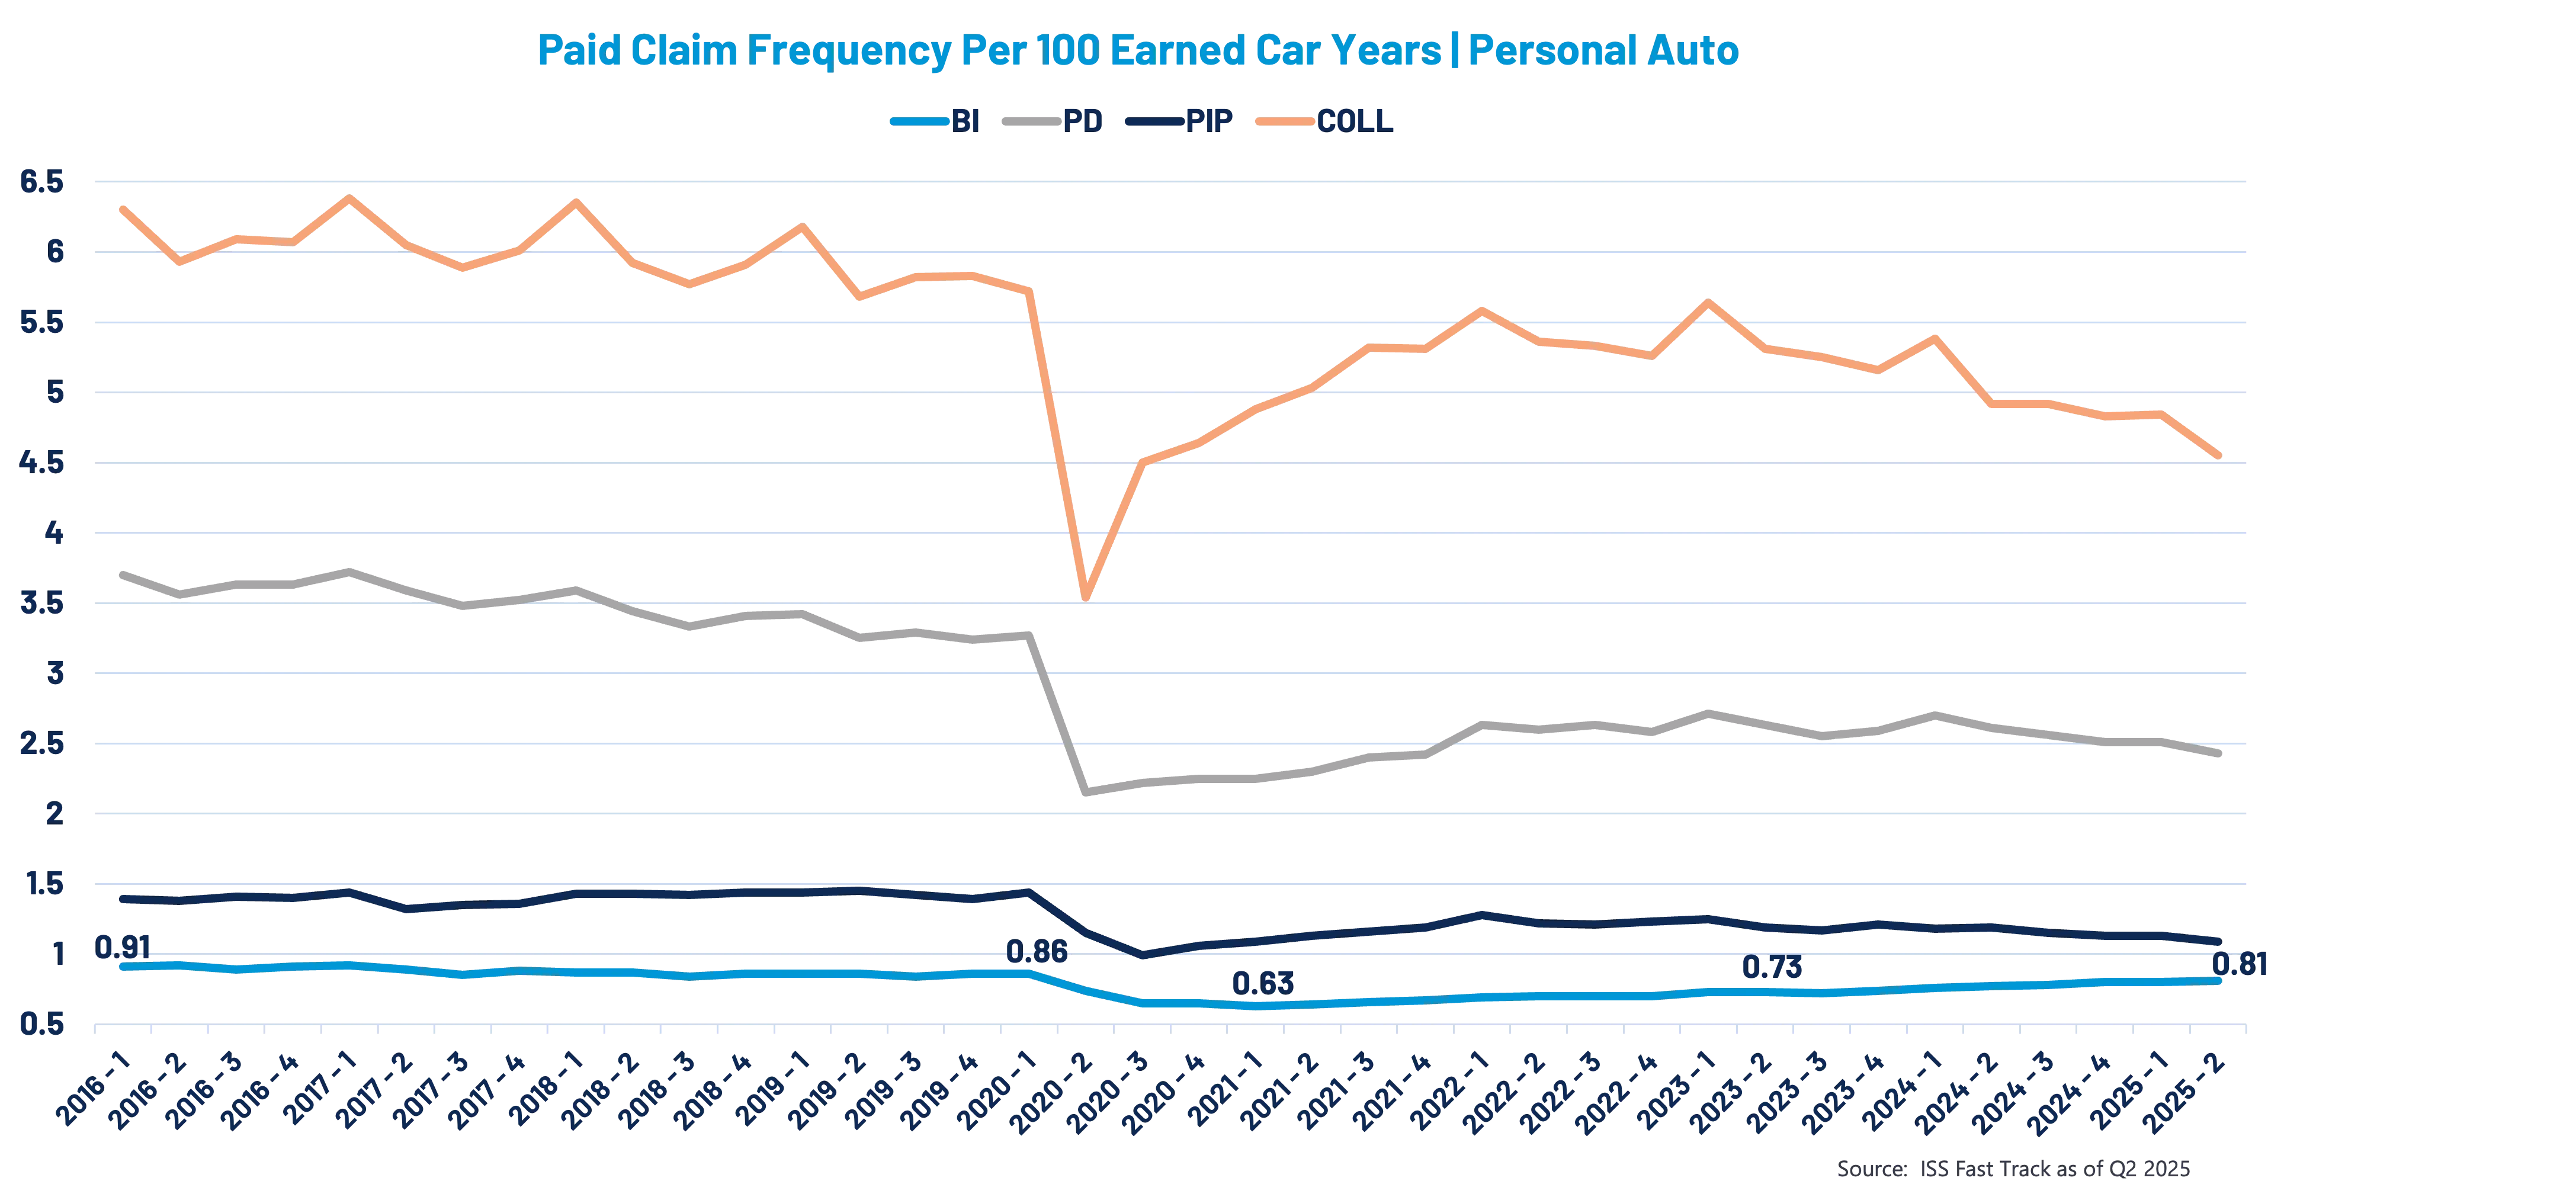
To understand why BI has split from the pack, it’s helpful to zoom out and examine a decade of claim frequency data, including the five years before the COVID-19 disruption and the five years since. (Figure 4)
- Collision (COLL) and Property Damage (PD): Declining slowly pre-pandemic, disrupted sharply in 2020, then returning to a familiar downward trajectory after roughly two years of recovery.
- Personal Injury Protection (PIP): Flat before the pandemic, briefly disrupted like COLL and PD, and now also declining.
- Bodily Injury (BI): WAS declining slightly in the 5 years leading up the pandemic, consistent with the others, yet it has continued to increase steadily since bottoming out in early 2021. Not only is this a deviation from other lines in the last two years, it’s also a deviation from pre-pandemic trajectory.
This is the first major chart inflection point: BI is no longer behaving like the lines it historically traveled alongside.
The Likely Culprit: A Rising Tide of Social Inflation
In identifying the potential reason(s) for this fundamental change of trajectory, one logical aspect to consider is the trend of auto collision impact severity from a physics perspective: Is the average auto collision claim growing more energetic year-over year?
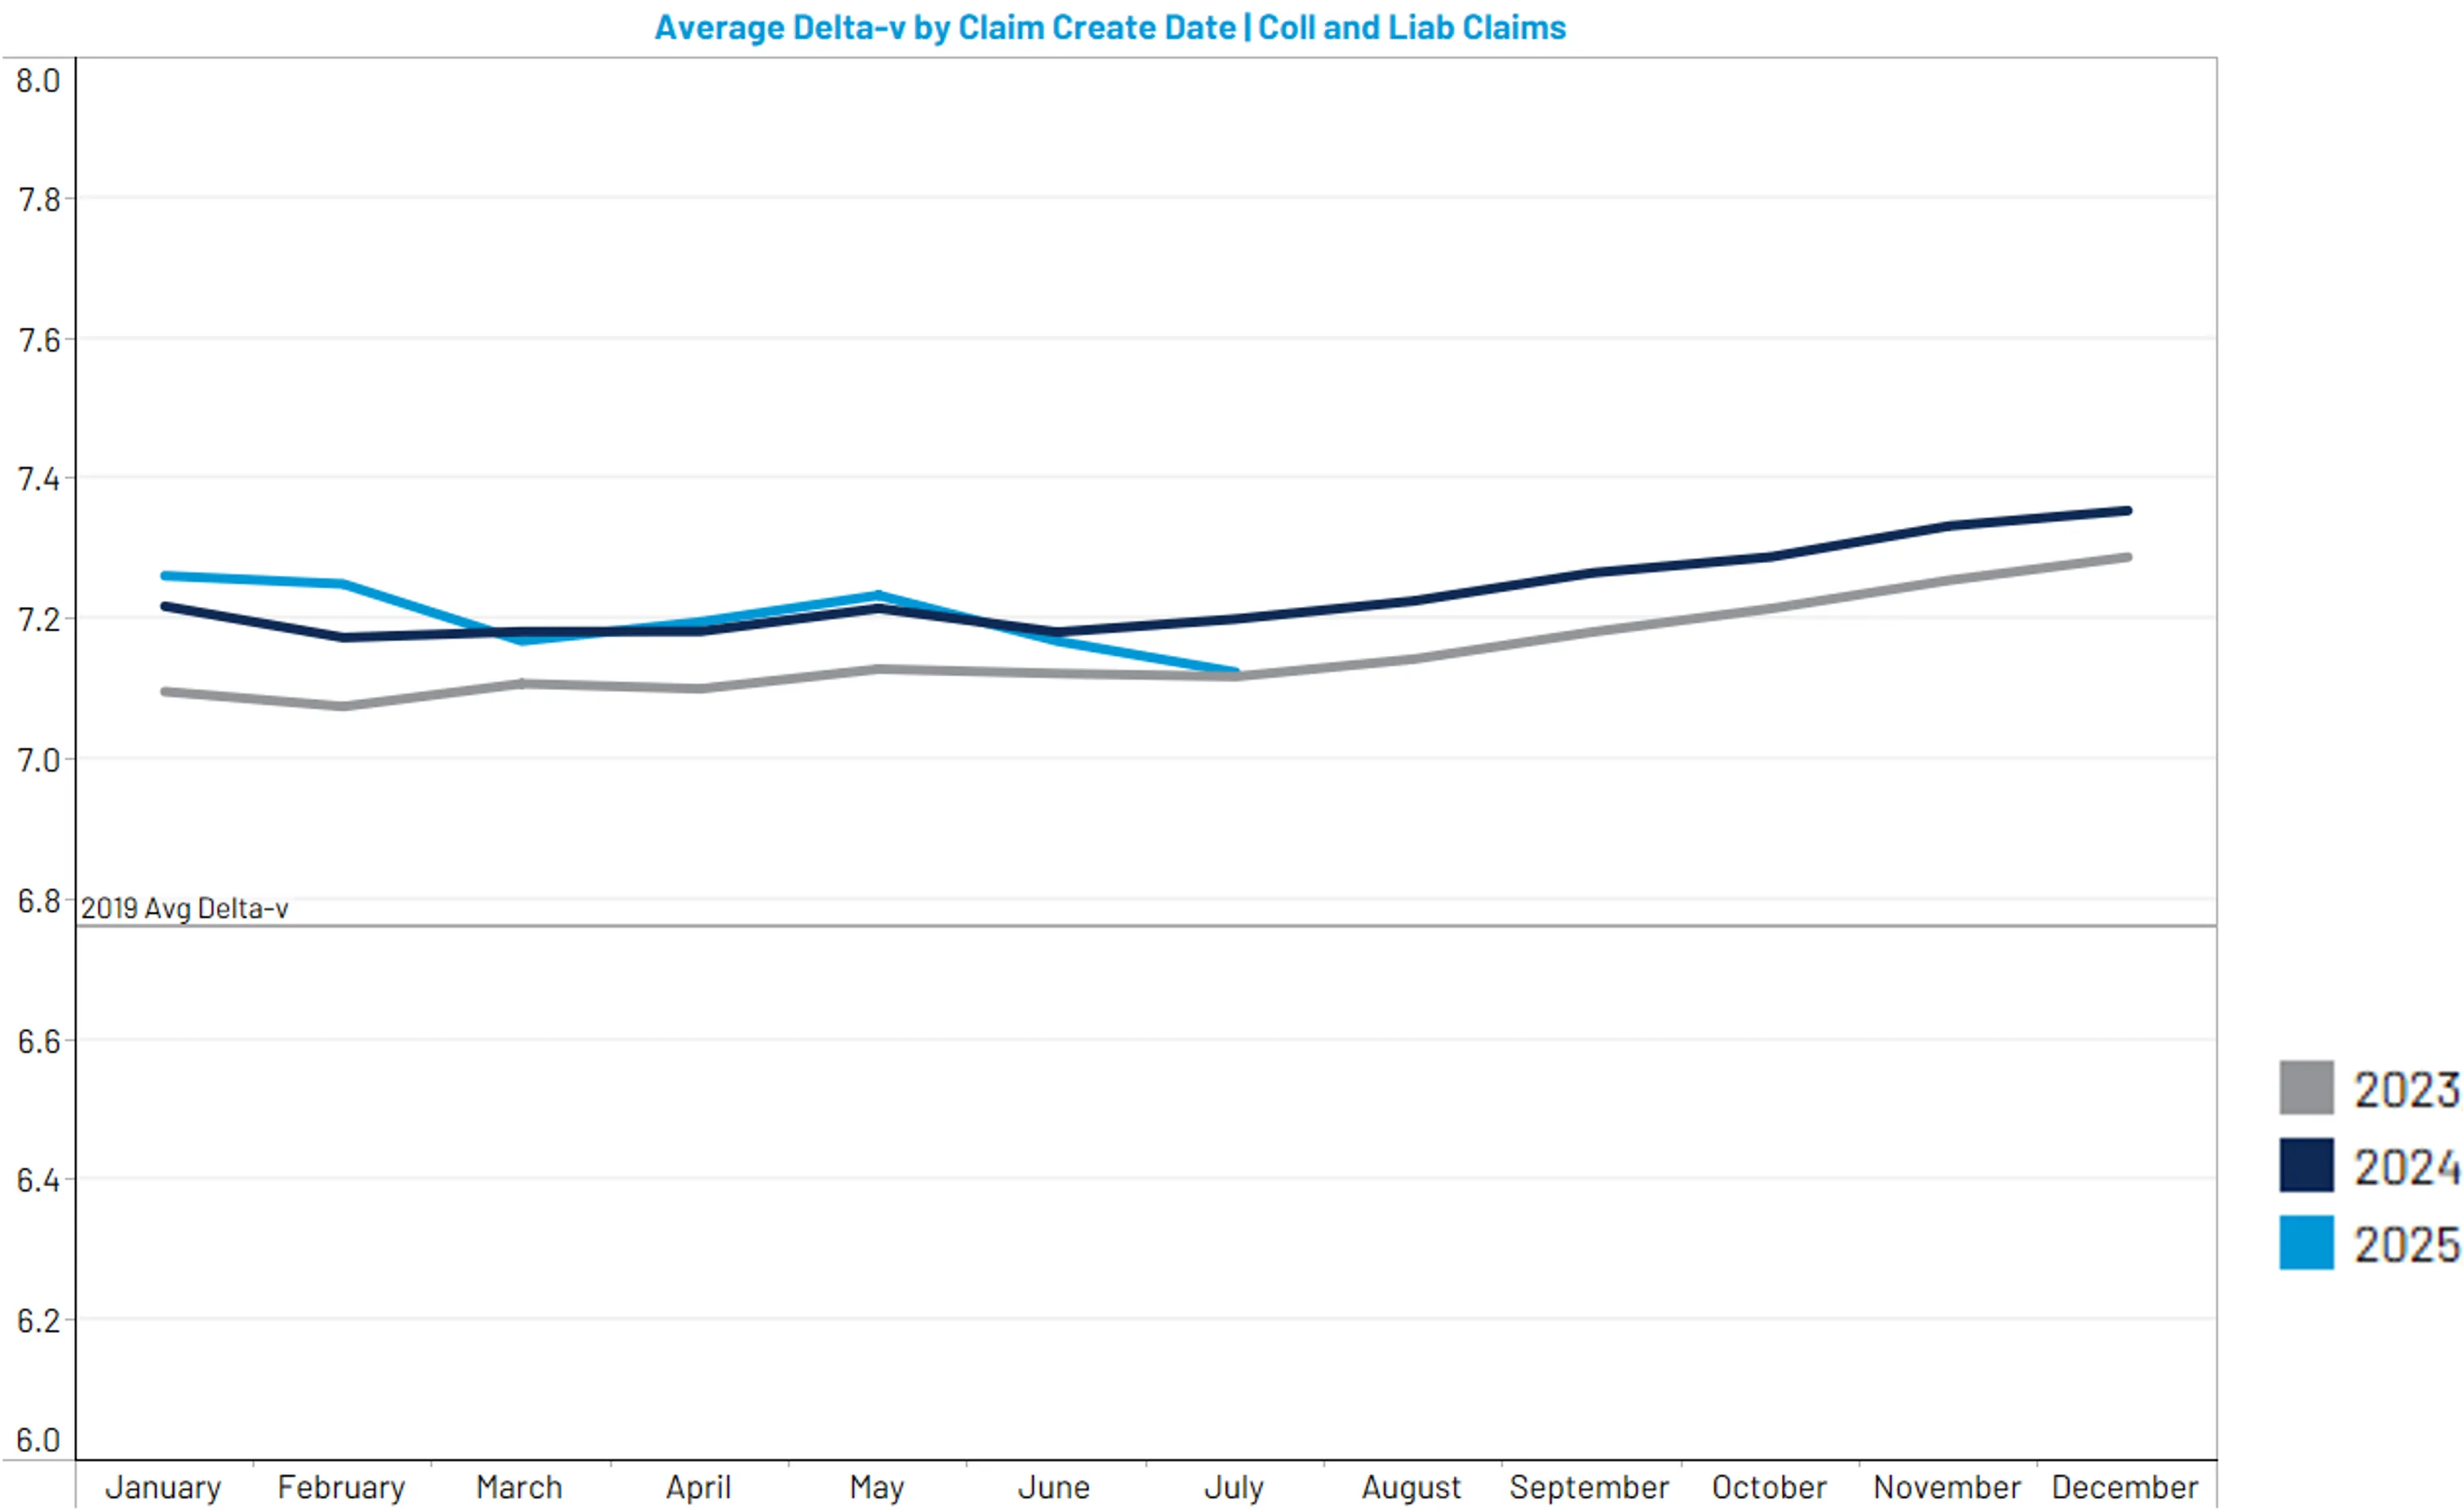
CCC data shows that while average Delta-v (change in velocity at time of impact) remains slightly higher than the referenced 2019 baseline, it has changed little over the last three years. (Figure 5)
Because collision forces haven’t shifted significantly, the next logical place to look is the macroeconomic and regulatory environment surrounding injury claims – particularly social inflation – the tendency for claim costs to outpace general inflation due to changing societal attitudes, healthcare costs, legal strategies, jury behavior, and more.
While social inflation is notoriously difficult to quantify precisely, several independent indicators point to escalating pressure:
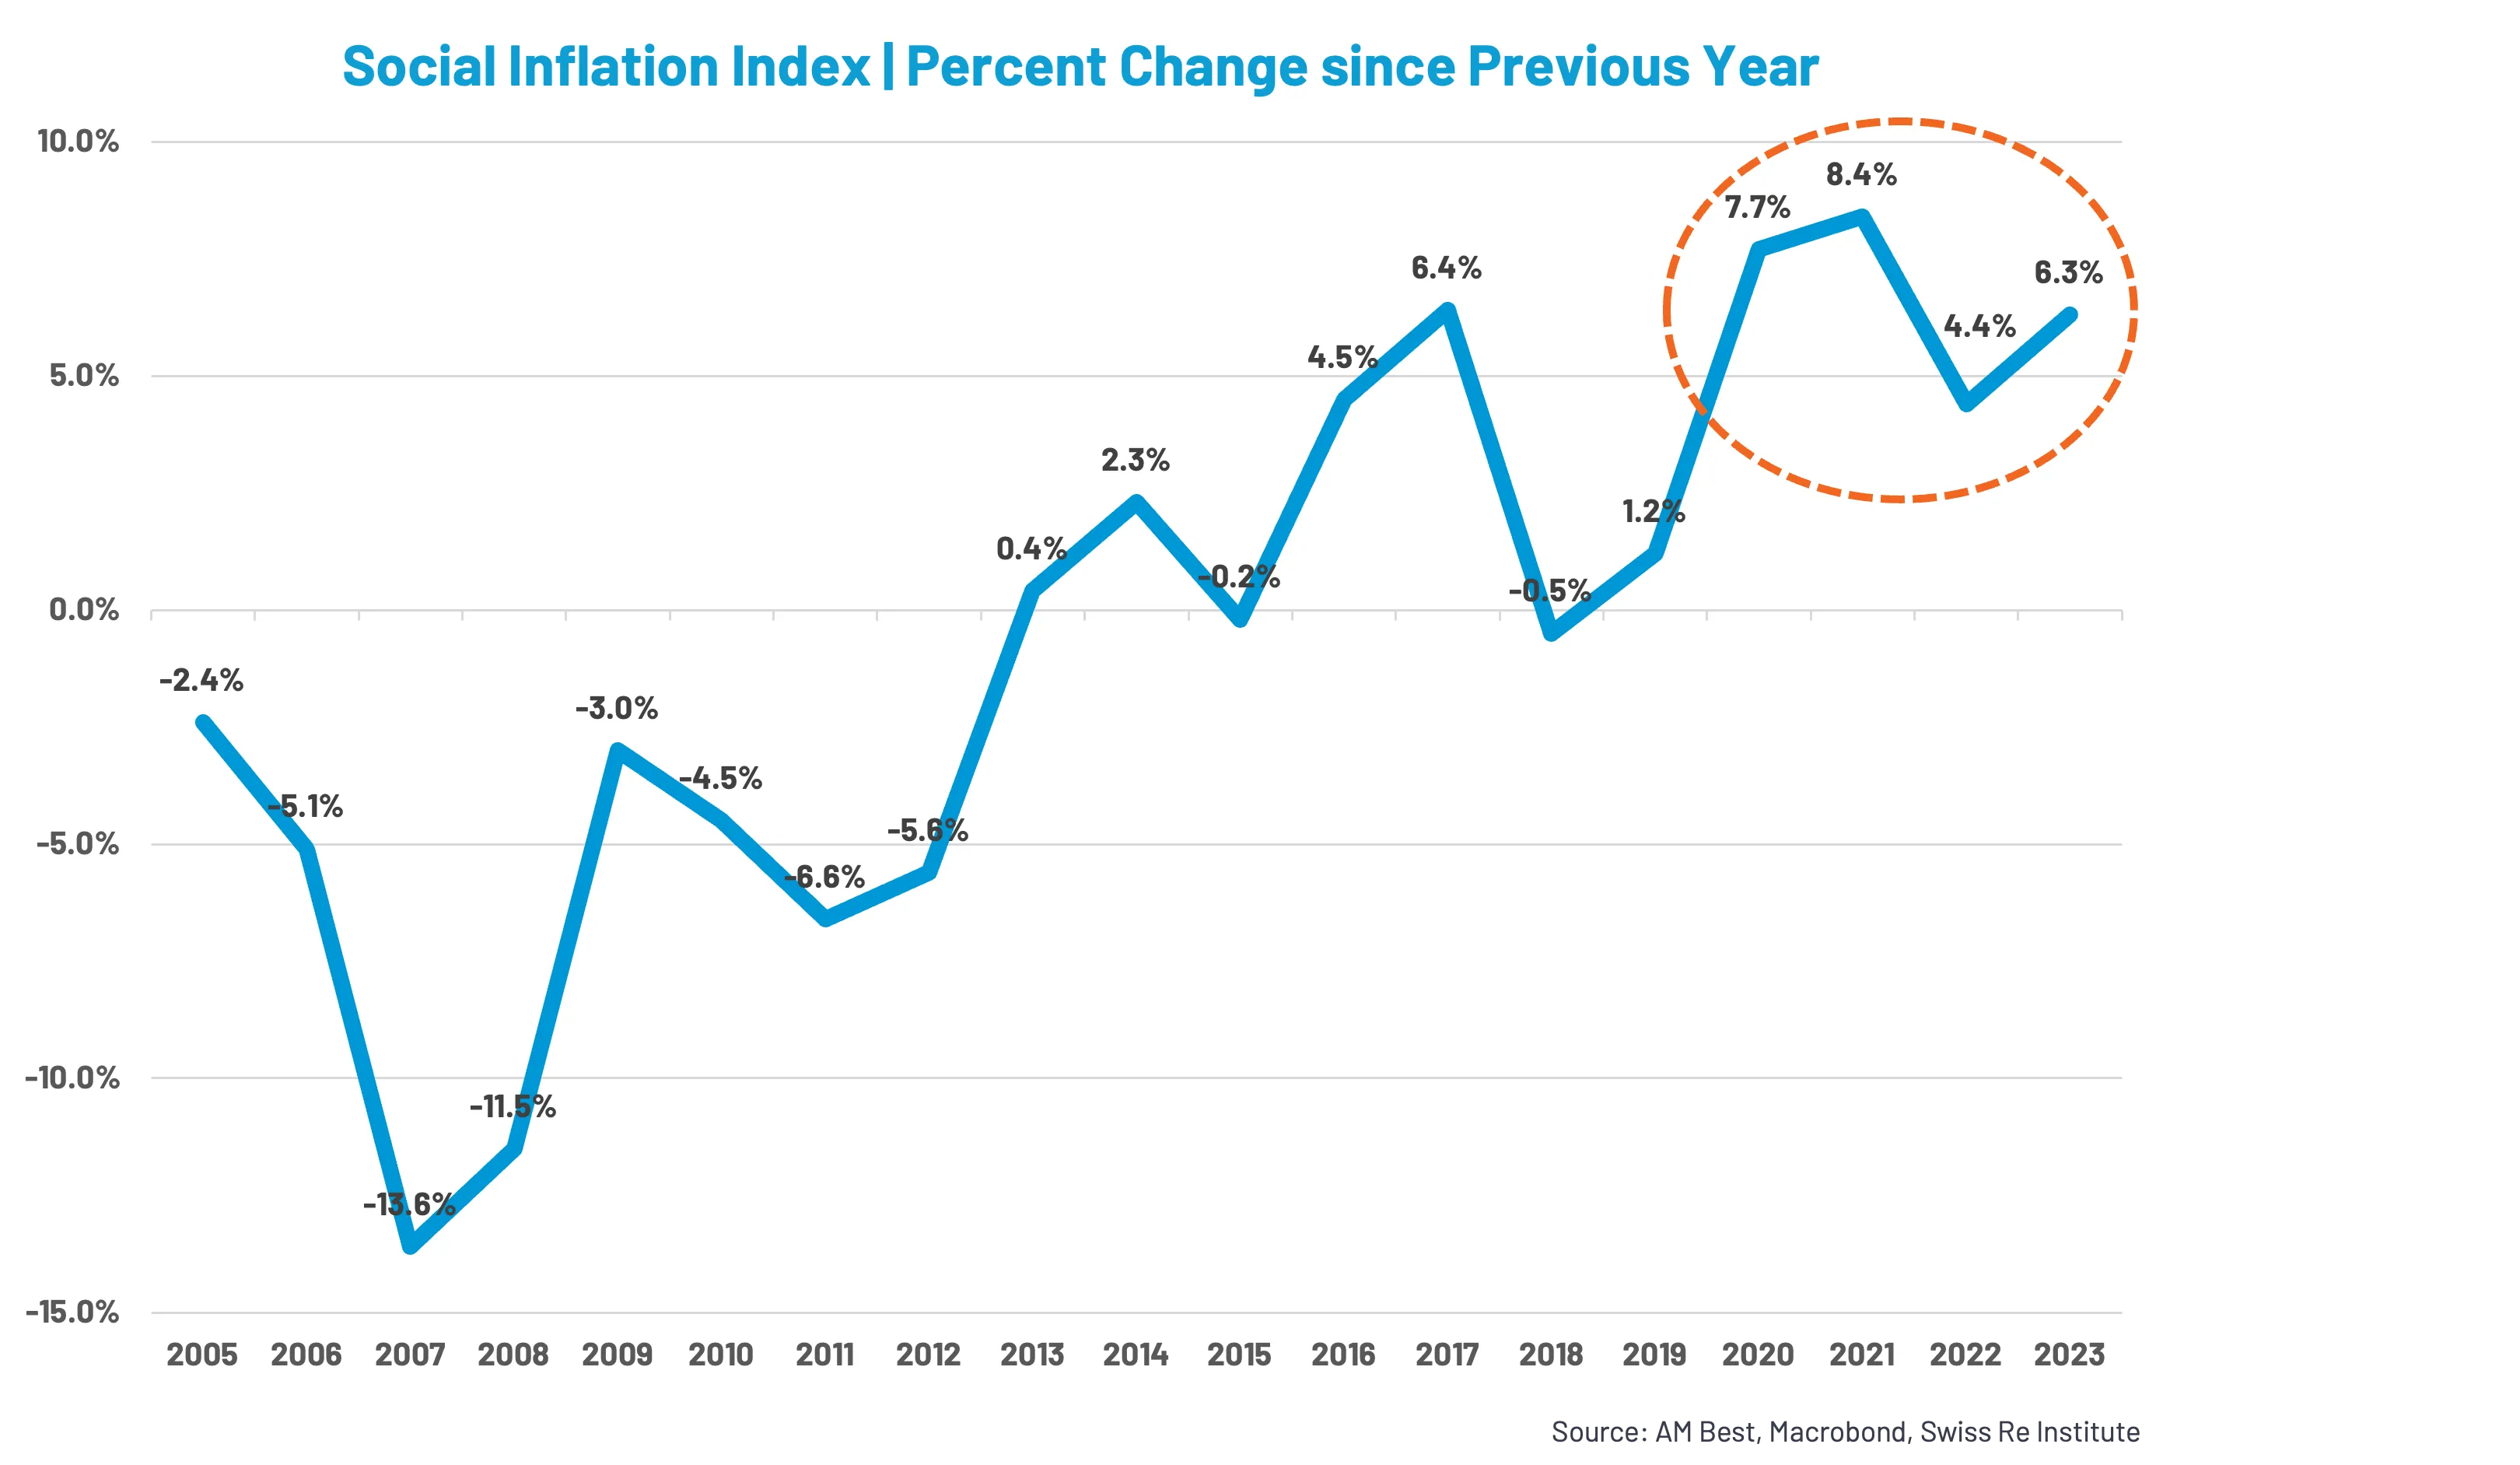
- Swiss Re's Social Inflation Index shows a steady post-2008 rise, with a 27% increase in liability costs from 2020–2023 tied to social inflation alone. (Figure 6)
- Marathon Strategies reports that nuclear verdict frequency (awards above $10M) rose 52% from 2023 to 2024, suggesting a post-COVID acceleration.
- A new Triple-I + CAS study quantifies $92 - $102 billion in combined economic and social inflation impacts on personal auto over the last decade, the majority occurring after the pandemic.
These findings align with the BI frequency chart: as social inflationary factors increase, incentives to claim injury or pursue treatment – and file suit – rise accordingly.
Putting It Together: What the Data Signals
Taken as a whole, the trends point toward an environment where post-COVID affordability challenges, healthcare cost inflation, and more aggressive legal dynamics have fundamentally shifted the liability landscape. With BI severity already comparatively high, even a modest uptick in frequency has an outsized impact on total indemnity.
So, where do auto insurers go from here? Awareness is only half the battle. Rising BI frequency – paired with high indemnity severity – demands more proactive strategies to ensure claims are evaluated accurately and consistently. And in a market where the financial incentive to allege injury continues to grow, precision matters more than ever.
This report was originally published in PropertyCasualty360.