Q4


Transformative Auto Claims & Repair Industry Trends from 2025
If 2025 revealed anything, it’s that the auto claims and repair ecosystem wasn’t simply changing – it was being fundamentally reshaped.
Pressures that once felt separate began to collide: an aging yet increasingly complex car parc, calibration needs rising fast, supply chains destabilized by tariff activity, and casualty pressures growing more intense. Operational models built for simpler vehicles and steadier cost structures were suddenly outpaced. This year forced insurers and repairers to confront not just what is happening to claims, but why and how interdependent these forces have become.
Our final Crash Course report of 2025 will look back at the inflection points that defined this year, and the realities shaping the next.
.svg)


Calibration Complexity
Few inflection points hit harder in 2025 than the rapid rise in diagnostic and calibration demands. As ADAS-equipped vehicles flowed into shops in greater numbers, calibrations became a more routine – but increasingly variable – part of repair planning. Differences in vehicle make, model, trim, sensor placement, and damage type created a widening range of calibration requirements.
And it wasn’t just the volume of calibrations that challenged repairers; it was the variability, which required more precise documentation, careful sequencing, and added repair steps that affected both quality and cycle time. Even a growing pool of aging vehicles couldn't offset this trend, as many ADAS features became more commonplace in the late 2010s.
The result was a repair environment in which diagnostics and calibrations were no longer niche tasks but central operational pillars influencing total cost, throughput, and customer communication.
For more on this, see The Current State of Calibrations.
Tariffs and Supply Chain Disruptions
Another turning point involved tariffs on imported auto components, which put sustained pressure on parts pricing throughout the year, creating unpredictable spikes that directly impacted severity. Even when claim frequency remained steady, the cost of fulfilling the average claim continued to rise. Meanwhile, global logistics remained unsettled, with uneven factory output, fluctuating shipping lanes, and persistent bottlenecks in key electronic components that delayed otherwise straightforward repairs.
For parts distributors, success often hinged on agility – tapping wider networks, adjusting sourcing strategies, and fostering stronger supplier relationships. For repairers, the consequences were exasperating; explain to customers why a simple bumper repair was waiting on a back-ordered sensor, absorb operational delays, and manage increasingly complex repair planning driven by calibration needs.
Insurers felt those downstream effects as cycle times stretched, rental exposure increased, and older vehicles – already close to total-loss thresholds – became even harder to justify repairing. What emerged was not a temporary disruption, but a structural shift in how parts move, how much they cost, and how repair plans must be built.
For more on this, see Crash Course Q3 2025 report and webinar recording.

Casualty Claims
Casualty claim pressures are building as injury claim frequency and medical costs continued to climb in 2025. Even with overall crash volumes holding steady, a greater proportion of collisions resulted in bodily injury claims, driving up severity. Medical treatments escalated more quickly post-loss, and high-cost procedures such as spinal injections appeared earlier and more frequently, even among younger claimants.
This year, claims teams began to evolve their negotiation strategies, implementing a structured, evidence-based approach emphasizing injury, functional impact, causation, and clarity around treatment rationale. In doing so, they were able to move negotiation from a late-stage settlement activity to a more strategic, disciplined component of liability management.
For more on this, see PropertyCasualty360’s webinar recording and CCC’s recap blog post.

Evolving Car Parc
Vehicle fleet trends set the tone early in 2025. The average vehicle age continued to rise as affordability challenges ranging from higher new vehicle prices to elevated interest rates pushed consumers to hold onto cars longer. Yet age was only part of the story; the composition of the car parc was changing as well. SUVs and crossovers solidified their dominance, while the presence of hybrids and EVs grew, each introducing new repair, parts, and underwriting considerations.
Under the hood, vehicles became more complex. More embedded electronics, a broader presence of ADAS, and increasingly integrated components led to more diagnostics, more calibrations, and costlier repair procedures. What entered the body shop in 2025 was fundamentally different from what shops saw even a few years prior.
These shifts influenced every aspect of claims and repair operations: older vehicles were more likely to be declared total losses by insurers, more complex vehicles required longer labor hours and specialized workflows, and evolving ownership patterns reshaped exposure. The notion of an “average vehicle” grew less meaningful as the car parc diversified.
For more on this, see Crash Course Q1 2025 report and webinar recording.

Looking Ahead
The forces that shaped 2025 demonstrate that the auto claims and repair industry is no longer defined by singular trends but by the convergence of many. Car parc evolution intensified calibration needs. Supply chain disruptions amplified cost pressures. Casualty negotiations grew more complex amidst rising injury severity.
If this year revealed the pressure points, 2026 offers the opportunity to strengthen them. Success will come to the organizations that treat these insights as a way to shape a path forward – one that supports a more resilient claims and repair ecosystem in the year ahead.


APD Industry Data
Year in Review Summary
The auto physical damage (APD) market demonstrated meaningful signs of stabilization this year, but not without reminders of the structural pressures that continue to shape claims and repair operations.
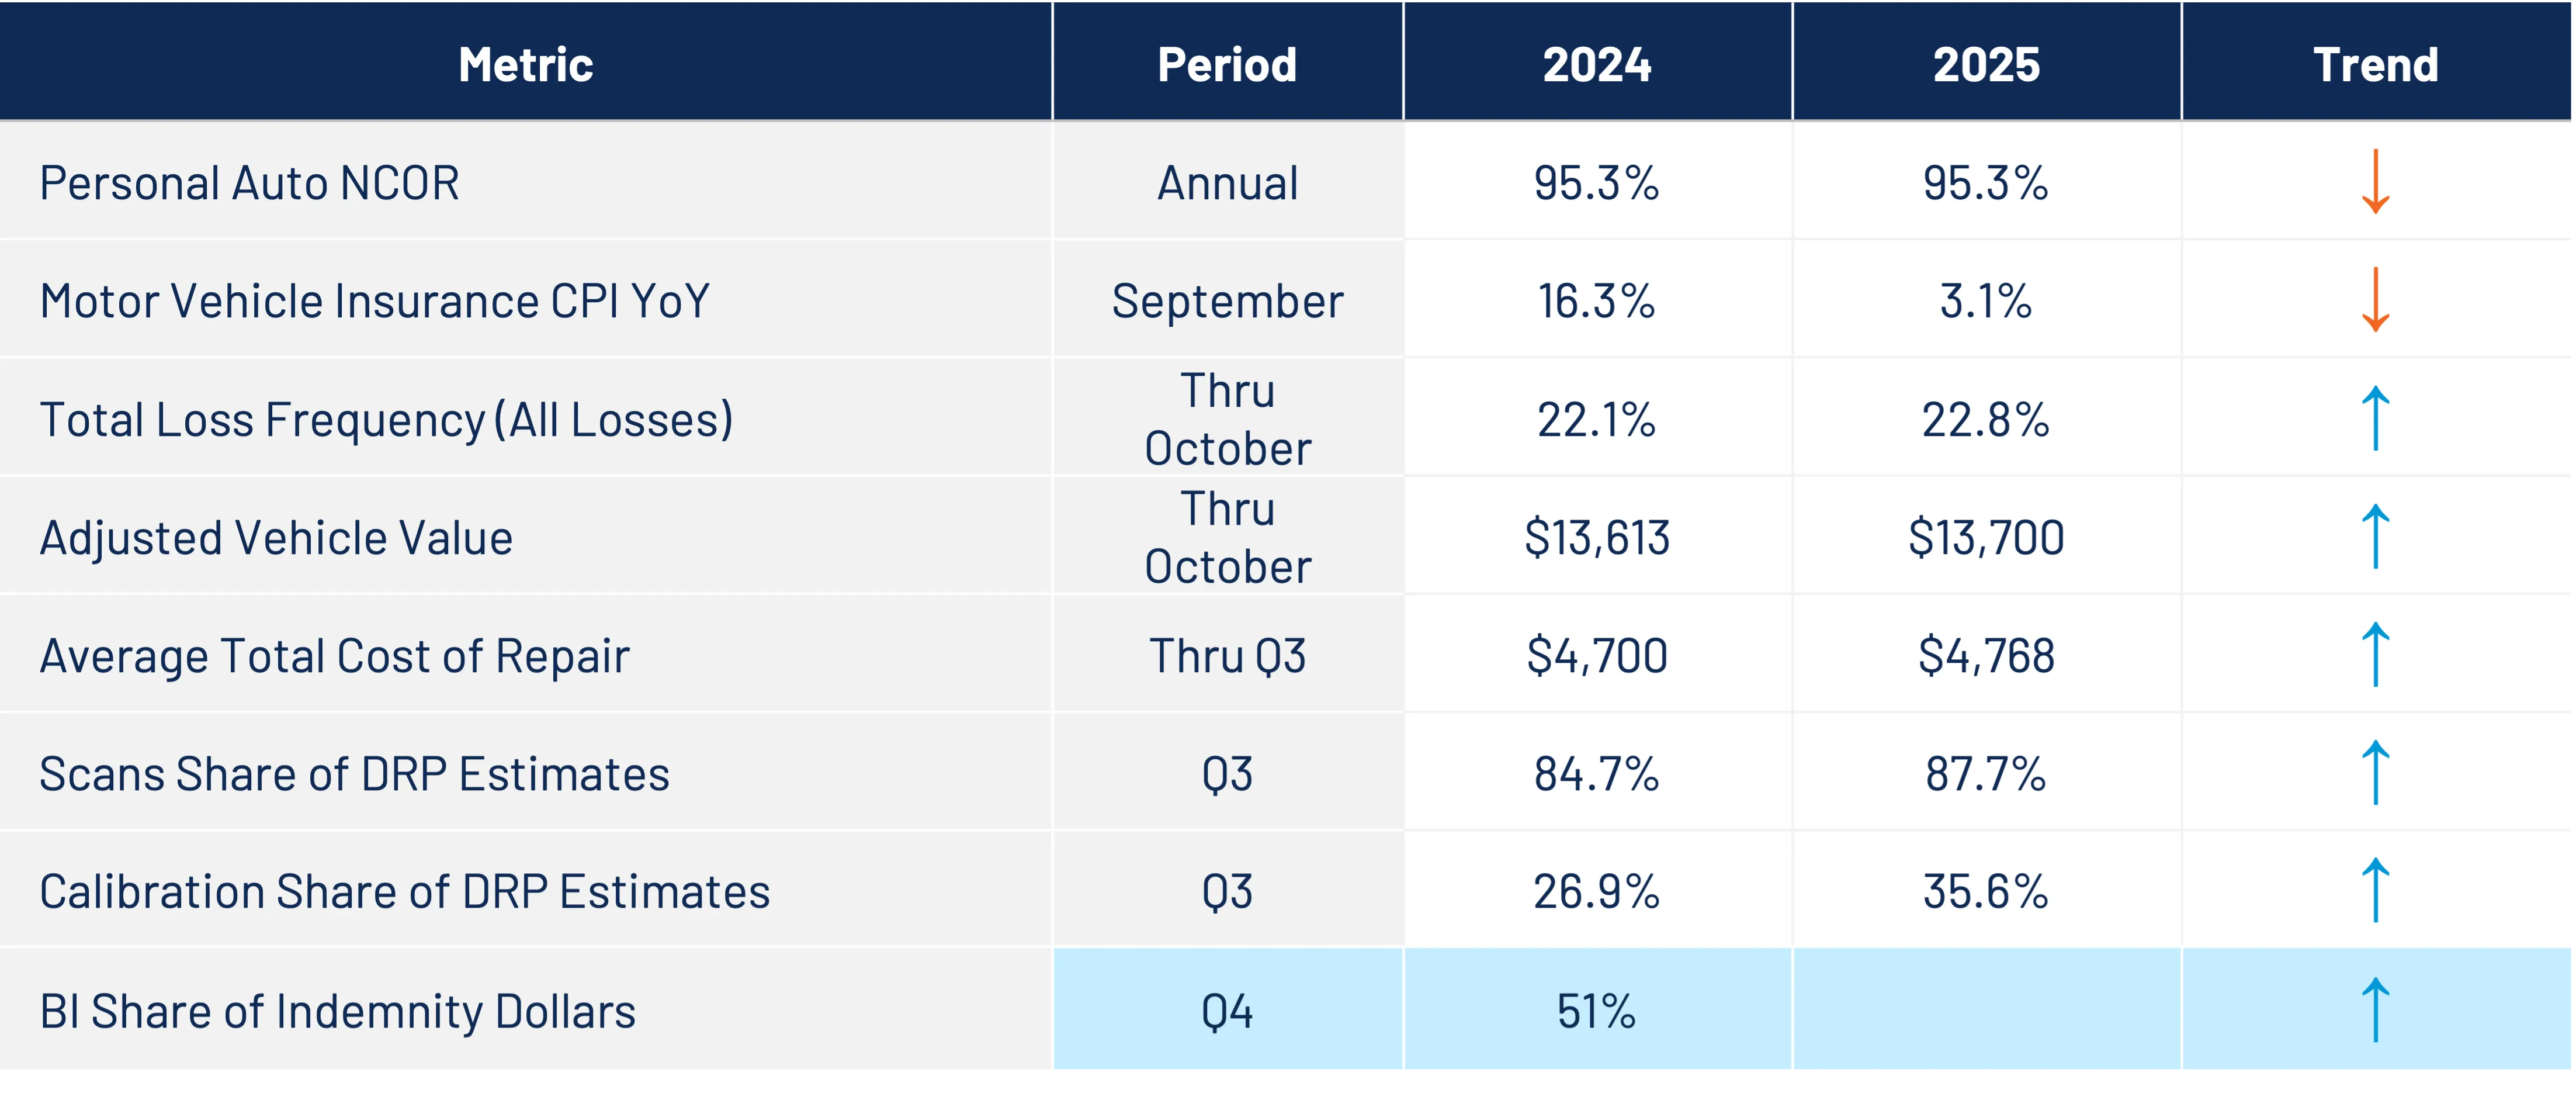
After several turbulent years marked by inflation spikes, supply chain disruption, and record vehicle complexity, the industry entered 2025 on firmer footing. Personal auto NCOR improved significantly – from 112.2% in 2022, to 104.9% in 2023, to an estimated 95.3% in 2024 and 2025 – reflecting strengthened underwriting performance. Even broader economic indicators trended in the right direction: Motor Vehicle Insurance CPI growth cooled dramatically, falling from 16.3% in late 2024 to 3.1% in 2025, easing some of the affordability concerns that have dominated insurer and policyholder conversations for the past several years.
Yet 2025 also made clear that many of the cost drivers reshaping APD are now permanent fixtures of the landscape. Total loss frequency edged higher – growing from 22.1% to 22.8% – driven by the increased age of vehicles, a decline in lower severity claims filings, and the accumulation of advanced electronics that often tip borderline repairs toward total loss decisions. Adjusted vehicle values inched up to $13,700 through October, still down from the peaks in mid-2022. And even with inflation cooling, repair costs continued their steady climb. The average total cost of repair grew from $4,700 to $4,768 through Q3, reinforcing the reality that rising vehicle sophistication – not temporary macroeconomic factors – is now a primary driver of severity.
2025 also underscored how deeply diagnostics and calibrations are embedded into the modern repair process. Scans appeared on nearly 88% of DRP estimates, while calibrations rose to more than 35% – both notable year-over-year increases. These shifts reflect the continuing expansion of ADAS-equipped vehicles and the growing prevalence of EVs and hybrids in the U.S. car parc. Repairers have had to adjust workflows, invest in new tools and training, and coordinate more tightly with insurers as the electronic and software components of repairs expand.
Overall, 2025 marked a transitional year for the auto claims and repair industry – a period where headline indicators showed improvement, but underlying dynamics confirmed a new normal characterized by higher complexity and sustained cost intensity.
The industry’s progress this year reflects growing maturity in pricing, reserving, and operational planning, but continued investment in technology, analytics, and ecosystem connectivity is still needed to navigate a now stabilized claims environment that’s been permanently transformed.
Paid Claim Trends
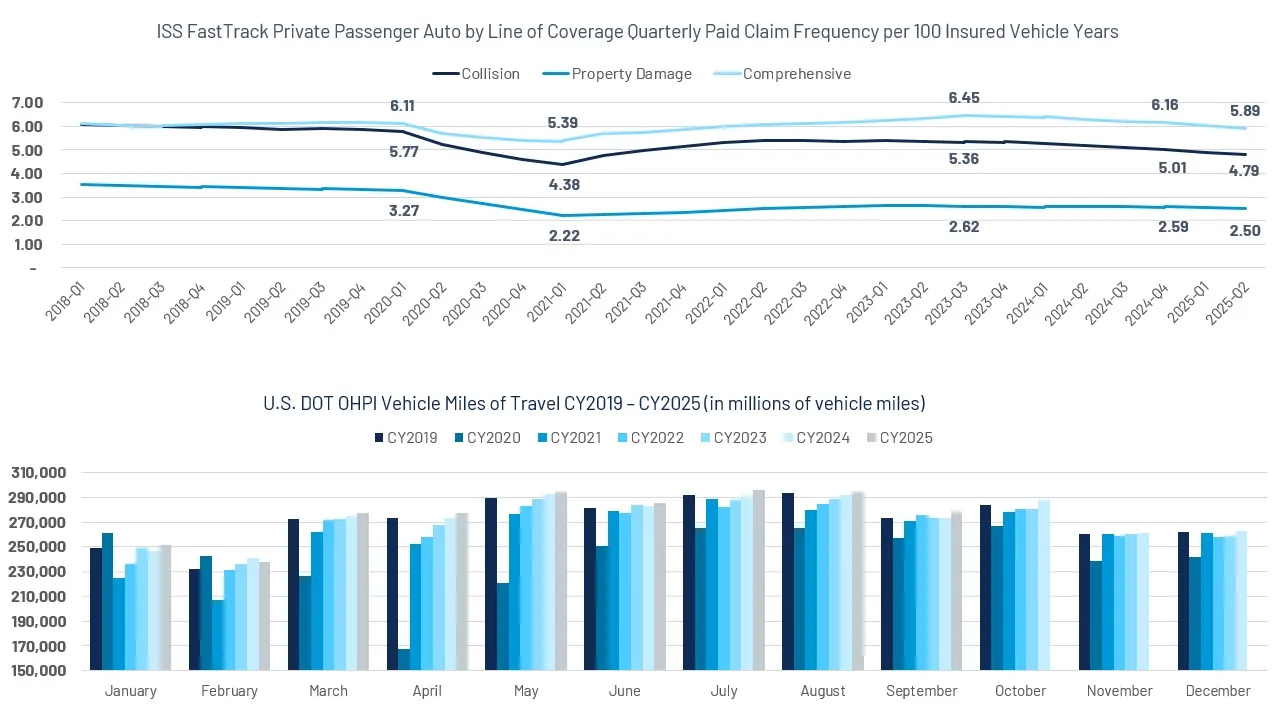
Paid claim frequency for collision and comprehensive (both 1st party coverages) continue to trend down slowly. Underlying drivers of frequency – paid count and exposure units – both continue to decline despite the overall growth within the car parc, which exceeded 295 million vehicles in Q2 this year. Liability (property damage) paid frequency remains relatively stable, though affordability challenges could drive the share of uninsured motorists higher.
Through September 2025, miles driven was +1.5% relative to 2019 and +1.0% versus prior year. Don’t let these seemingly small numbers fool you. In 2024, the U.S. averaged over 273 billion miles driven per month. A 1.0% increase (year-over-year through September) is over 25 billion additional miles driven. (Figure 1)
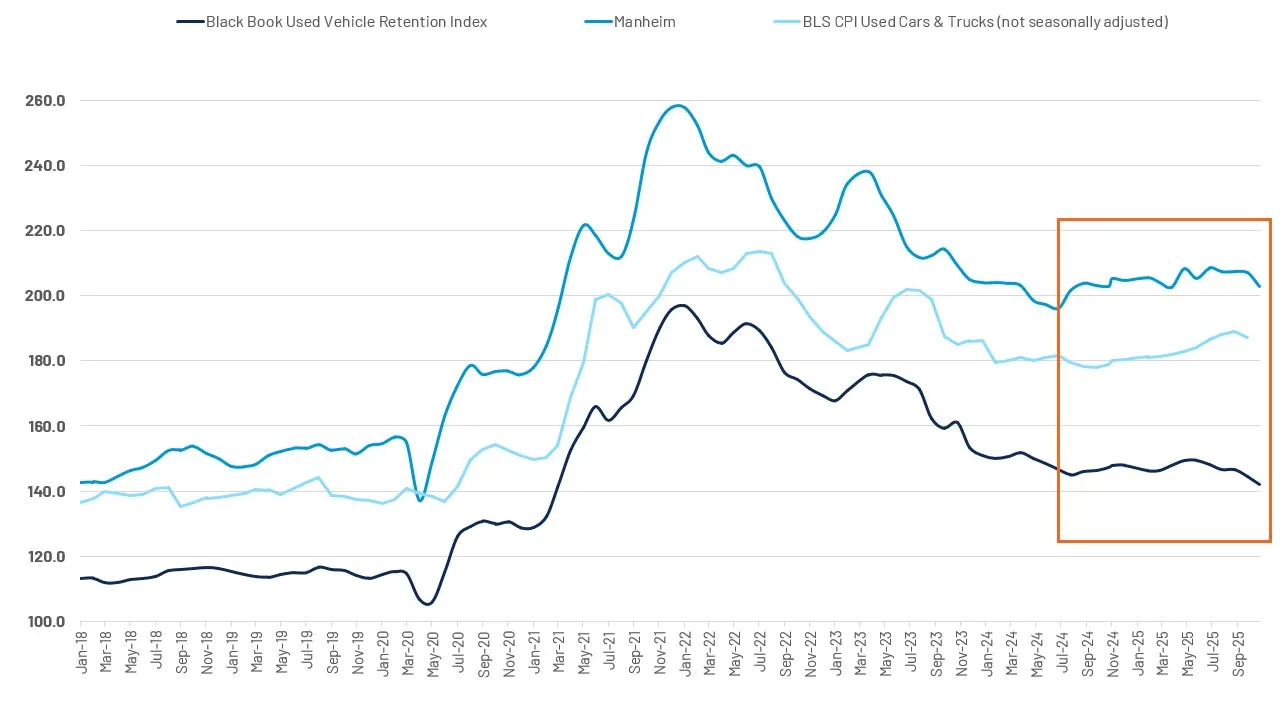
Wholesale used vehicle values are generally reflecting increases year-to-date, though wholesale indexes (Black Book, Manheim) have recently reflected flattened and even negative shifts in used vehicle values.
Retail prices, reflected in the BLS CPI for used vehicles were up +5.1% year-over-year in September. Supply and demand dynamics have not played as much of a role in used vehicle pricing in 2025 based on these trends. (Figure 2)
Total losses continue to represent a larger share of claims. Contributing factors, such as declining vehicle values, aging car parc, and a declining share of lower dollar claims being reported, continue to shift the claims mix. (Figure 3)
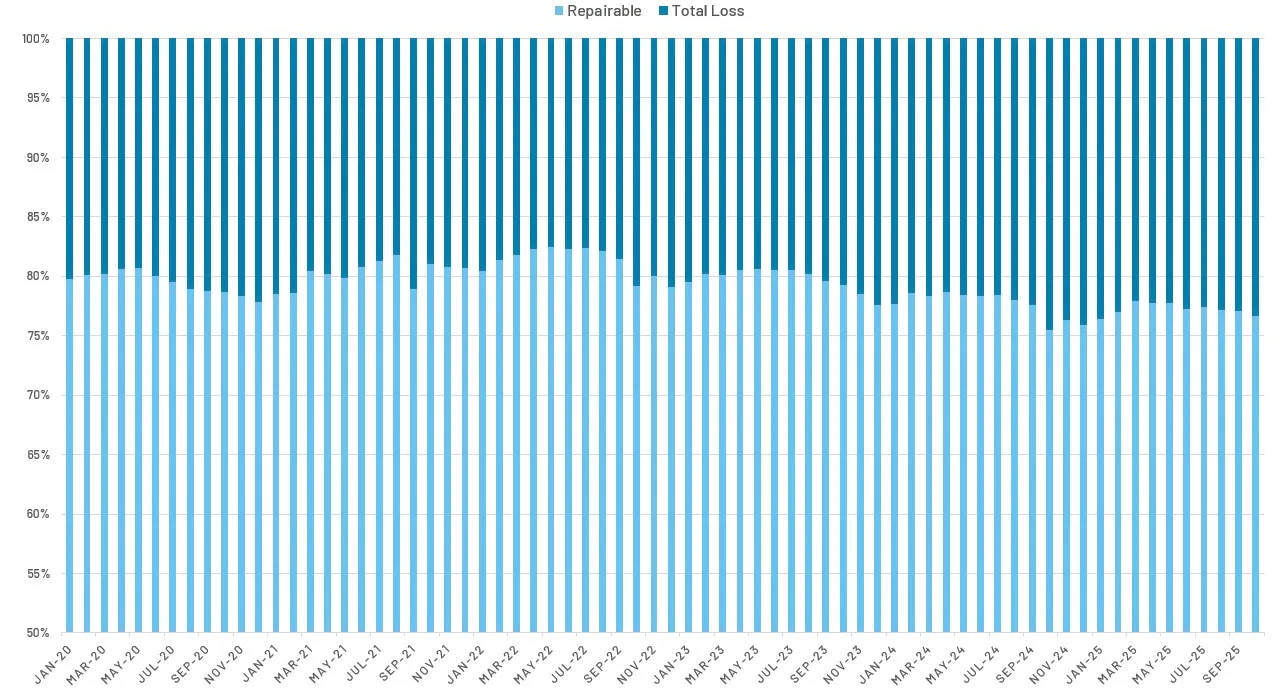
The share of claims flagged total loss was a record in 2024 – based on CCC’s historical trends. 2025 results appear poised to eclipse that record by close to a whole percentage point.
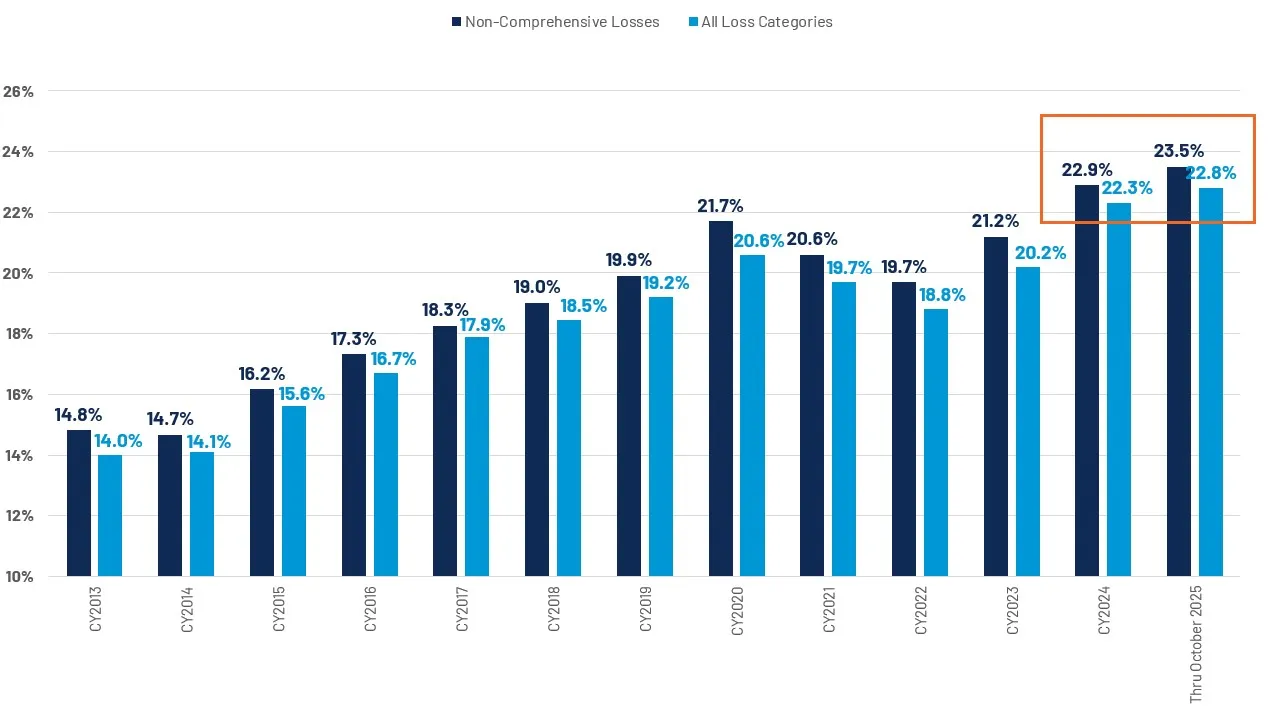
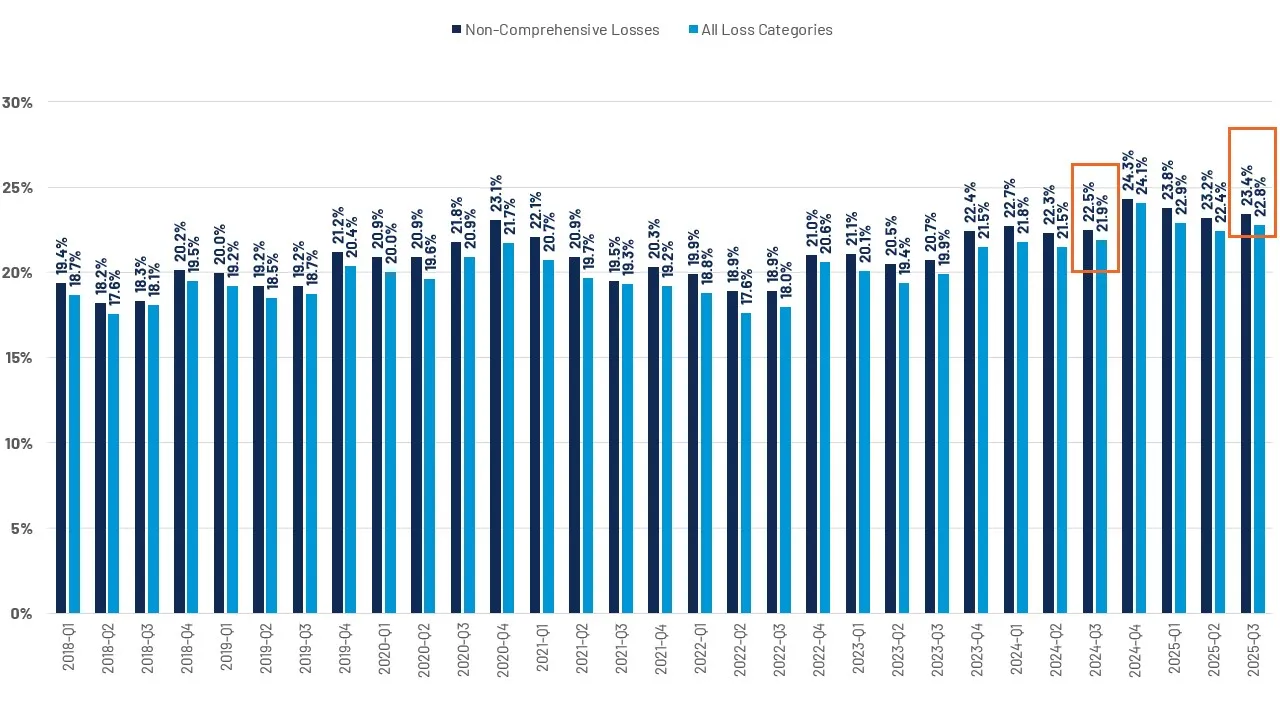
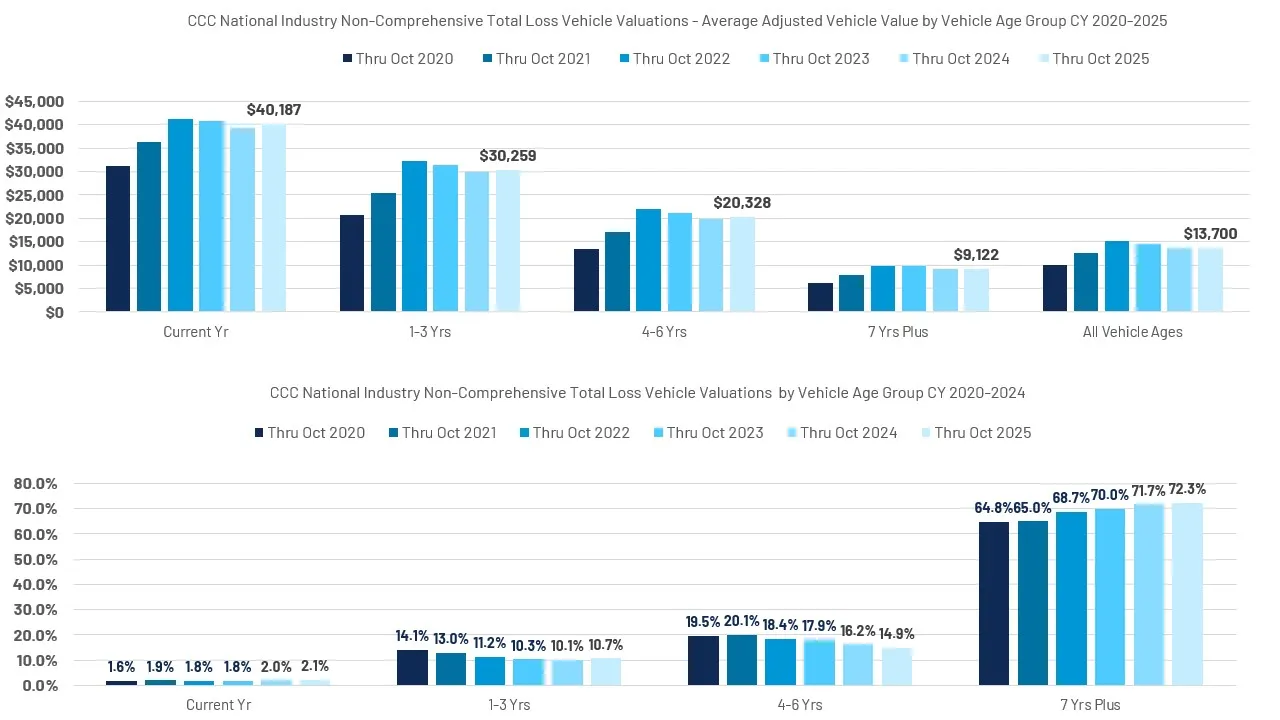
This increase is despite increases in used vehicle values and a relatively calm year in terms of weather events, where total loss frequencies can increase rapidly. Instead, the share of claims identified as total loss has increased due to an older age mix – over 72% of total loss valuations are on vehicles 7 years or older – and the continued decline in lower-dollar claims has exacerbated total losses. (Figure 4) Year-over-year, the share of total losses is up +0.9 pp in Q3. (Figure 5)
Average adjusted vehicle values (AAVV) on non-comprehensive valuations were +0.6% year-over-year through October. Through October, AAVV was -6.3% in 2024 and -4.0 2023. Vehicles 7 years old or older are still seeing AAVVs down -0.8% in 2025. Vehicles 6 years old or newer are all positive: Current year or newer +2.3%; 1-3 years +1.0%; and 4-6 years old +2.4%. Through October, AAVVs are +37% relative to 2020. The age mix of non-comprehensive valuations is highly representative of the age vehicle mix within the U.S. car parc. Older vehicles continue to represent a large share of the vehicle pool, while we see less representation from newer vehicles, a reflection of decreased new vehicle sales since 2020. (Figure 6)
NICB has reported vehicle thefts in the first half of 2025 were down 23% (334,114 vs. 435,754), sustaining the national trend going back to early 2024. Over one million vehicles were stolen in 2022 and 2023. In 2024, thefts declined 16.7% year-over-year to 850,708.
Following a slight reprieve, the latter part of 2024 began to see an increased share of thefts relative to total losses. However, 2025 has experienced a sharp decline in the share of total loss thefts. (Figure 7)
Despite the decline, the market still seems ripe for moral hazard and fraud given the state of auto finance – where 3% of auto loans slipped into serious delinquency in Q3 2025, 6.65% of subprime auto borrowers were at least 60 days past due in their loans in October (a new record), and over 28% of trade-ins on new vehicle loans are under water by an average amount of almost $7,000 (Q3 2025).
(CY 2020-2025, by Quarter)
Total Cost of Repair Trends
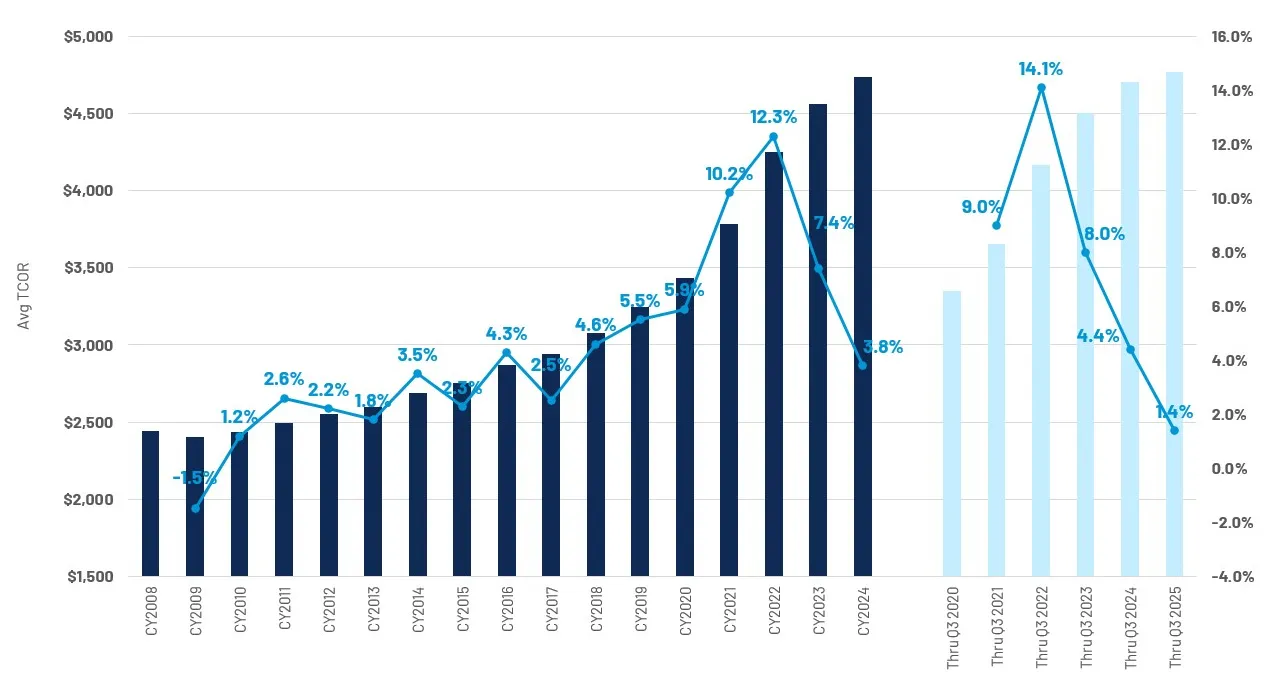
Though likely to develop higher, the year-to-date average total cost of repair (TCOR) is +1.4% year-over-year, at $4,768. The average TCOR finished 2024 at over $4,730, or +3.8% year-over-year. This was the lowest increase since 2017, and we are likely to see a sub-2% increase in 2025.
Increases in repair costs have been mitigated by the increase in total losses and age mix; almost 46% of repairable vehicles are 7 years or older, generally requiring less parts and labor hours. However, there are a variety of underlying factors which continue to put upward pressure on repair costs, including part prices, labor rates, and diagnostics. (Figure 8)
If you missed our Q3 2025 Crash Course Webinar on the effects of tariffs, watch the replay.
Repairable Appraisal Statistics
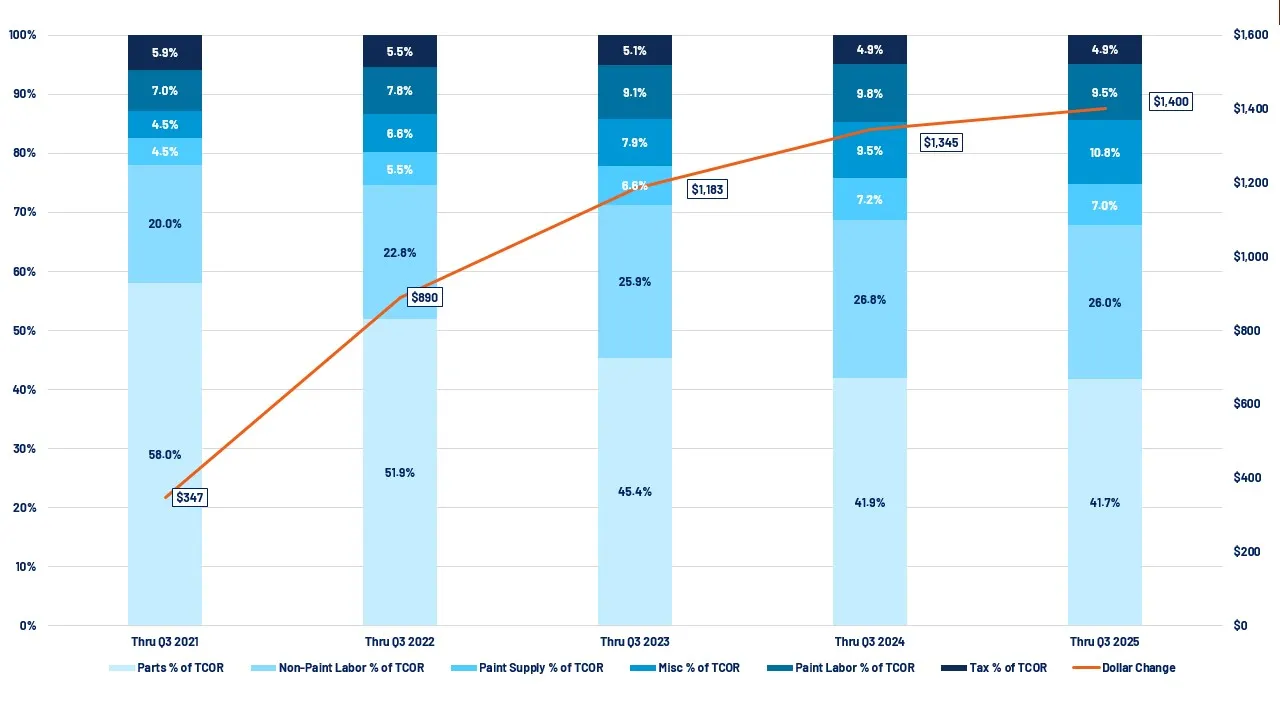
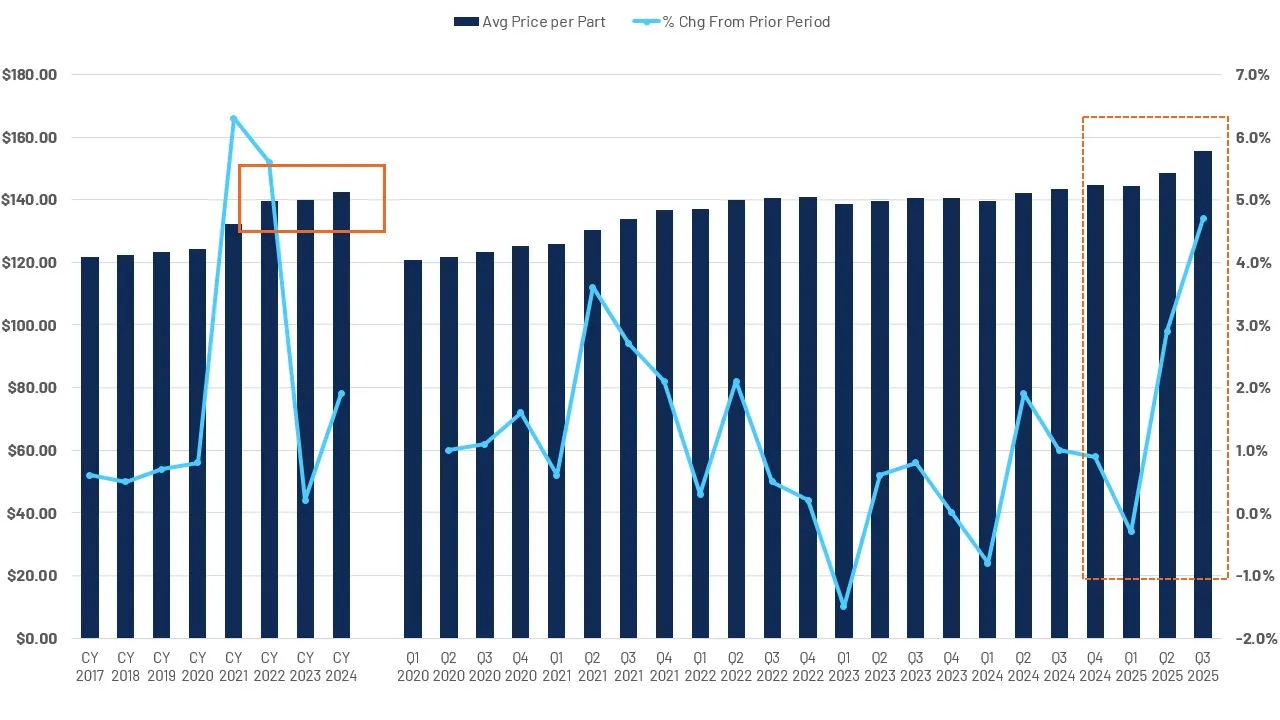
In recent months, and likely a result of price increases resulting from tariffs, we have only seen modest increases in overall part dollars and the contribution in TCOR increases due to parts, which we will continue to monitor. (Figure 9)
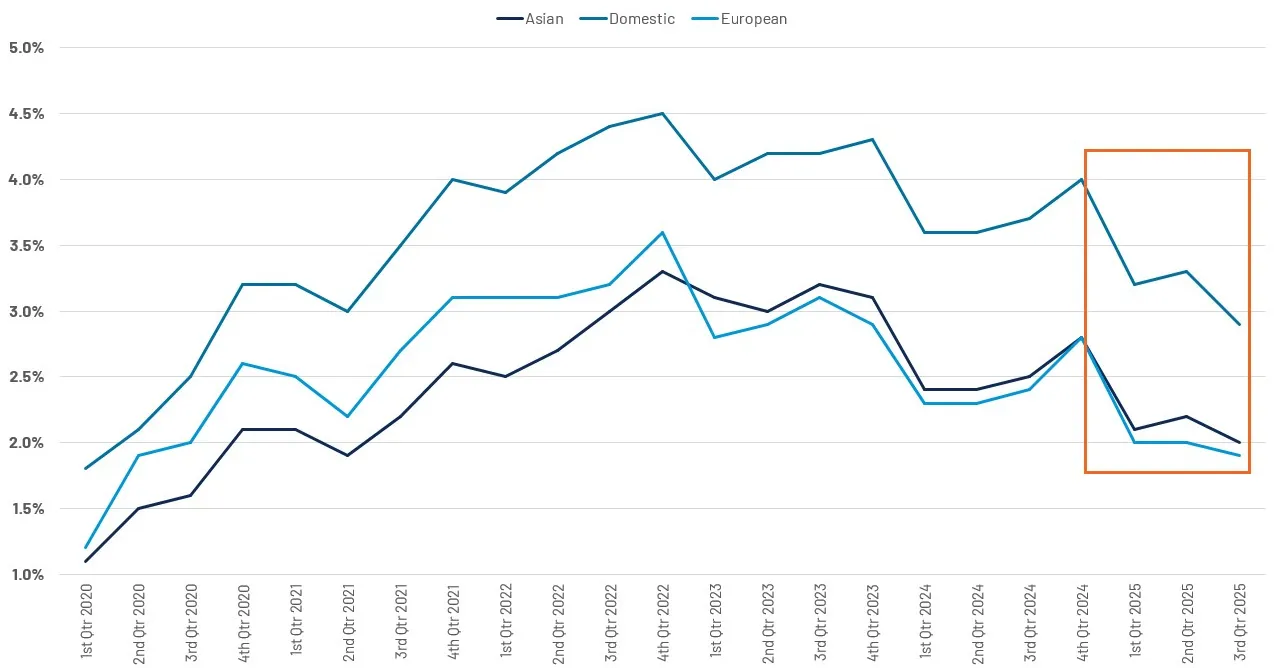
Average part prices had been relatively flat between 2022 and 2023. However, prices did begin to show signs of inflation beginning in Q2 2024. Q2 and Q3 results indicate more dramatic increases in the average price per part, as tariff impacts are solidified and supplier pricing is adjusted. (Figure 10)
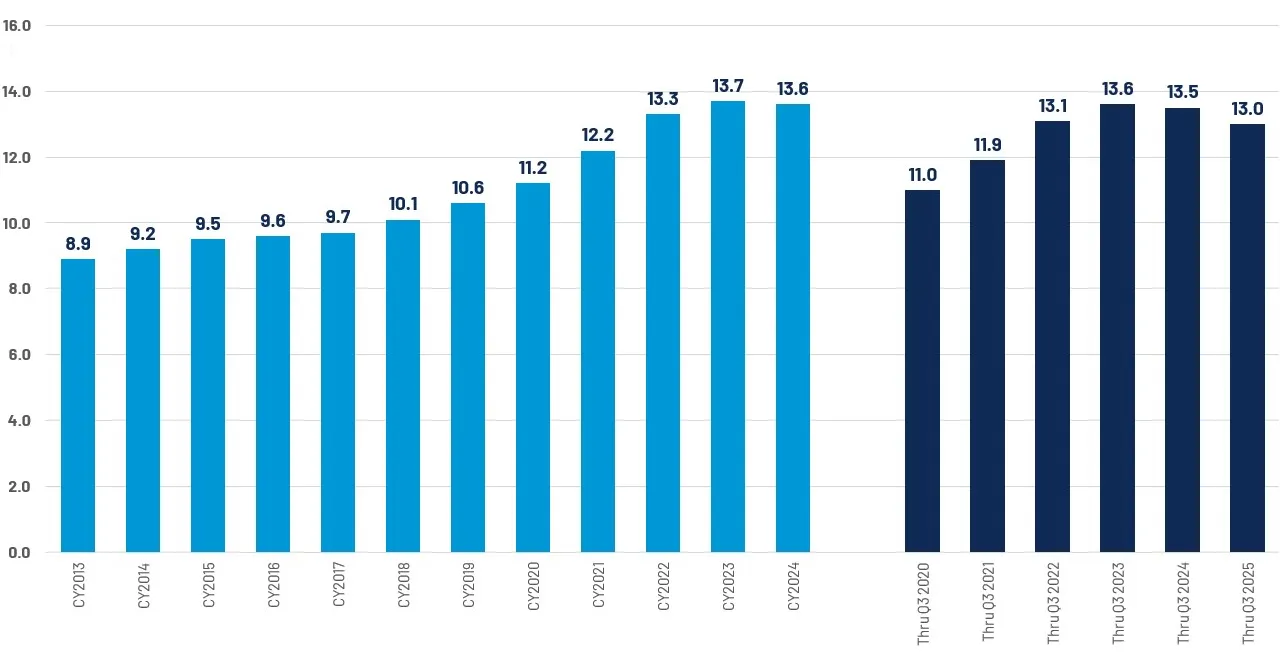
Industry part utilization remains down year-to-date by one half of a part per repair (-0.5). Much of this could be attributed to a repairable age mix which is biased towards older vehicles and increased total losses. (Figure 11)
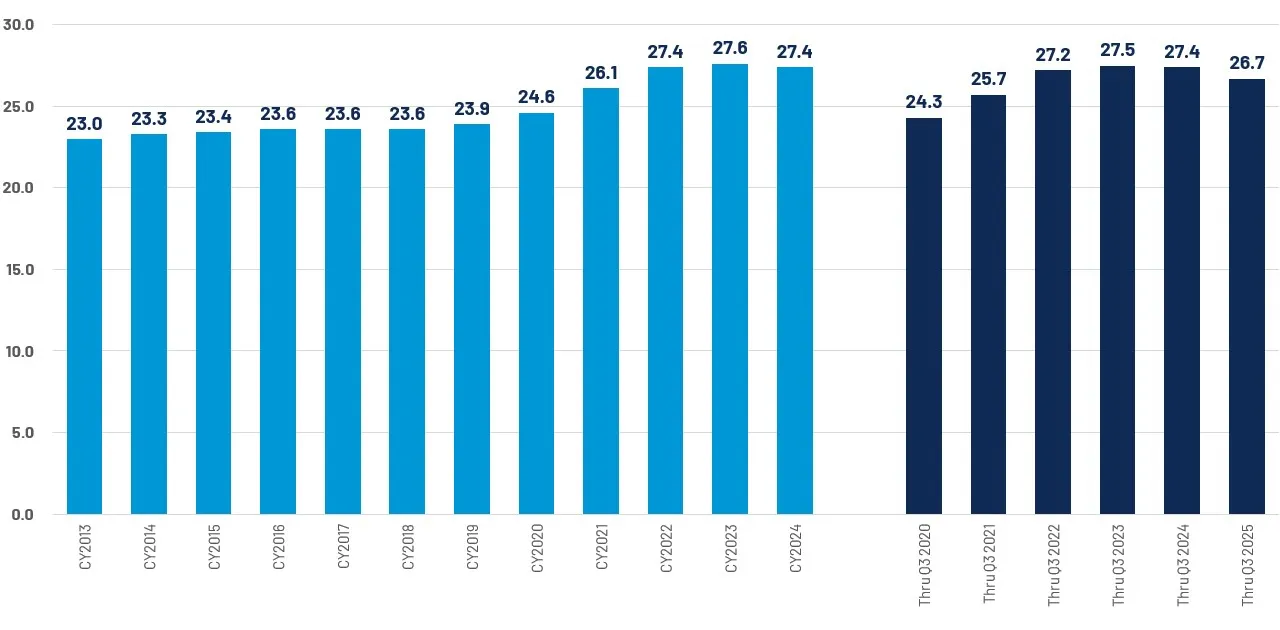
Like part volume, average labor remains down year-over-year. Initial results through Q3 indicate a notable decline in the average number of labor hours per repair – down ~0.7 hours per repair, though this result could still be developing (supplements, etc.) Labor hours can also be attributed to repairable age mix and increased total losses. (Figure 12)
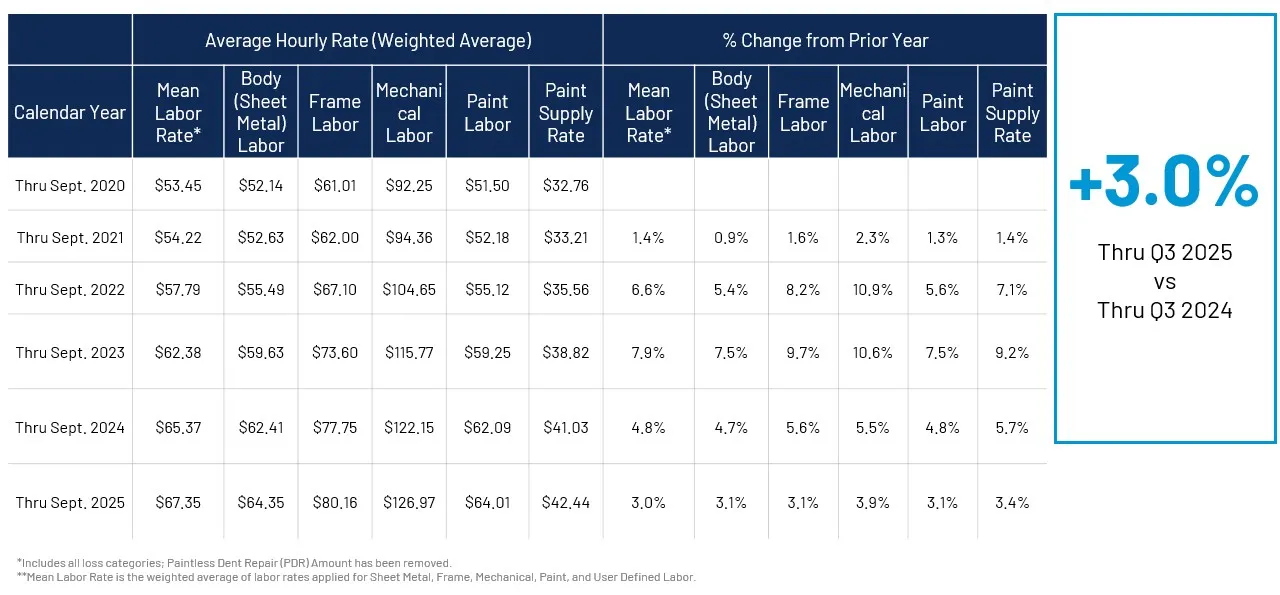
Labor rates continue to be a major contributor to year-over-year repair cost increases. Year-to-date through September, labor rates saw a 3.0% increase. Through Q3, labor rates were +4.8% in 2024 and +7.9% in 2023 following significant inflation across the economy. Labor rates are currently trending at or below inflation (CPI all items). Labor rates peaked ~9 months after inflation reached its apex in June 2022. (Figure 13)
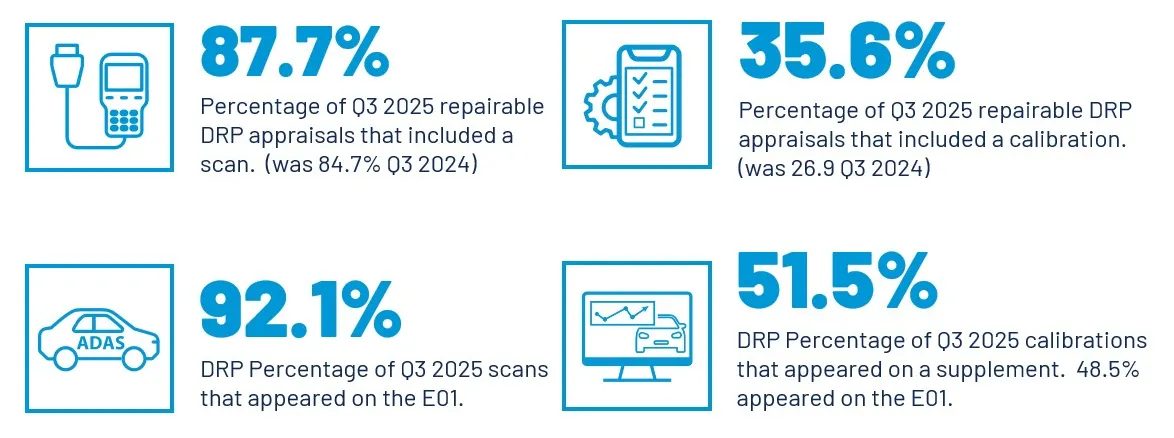
As we discussed previously, ADAS features continue to proliferate. This is reflected in the continued increase in appraisals that include diagnostic operations - namely, scans and calibrations. The share of DRP appraisals that included a scan reached nearly 88% in Q3 2025, while calibrations trended towards 36%.
The inclusion of calibrations is accelerating at a rate similar to what we saw with scans in recent years and implies a continued increase in repair costs. While over 92.1% of scans are included in the initial DRP estimates, the majority of calibrations appear on supplements, requiring additional review and approval time while vehicles are in the process of being repaired. (Figure 14)
Shop Productivity Trends
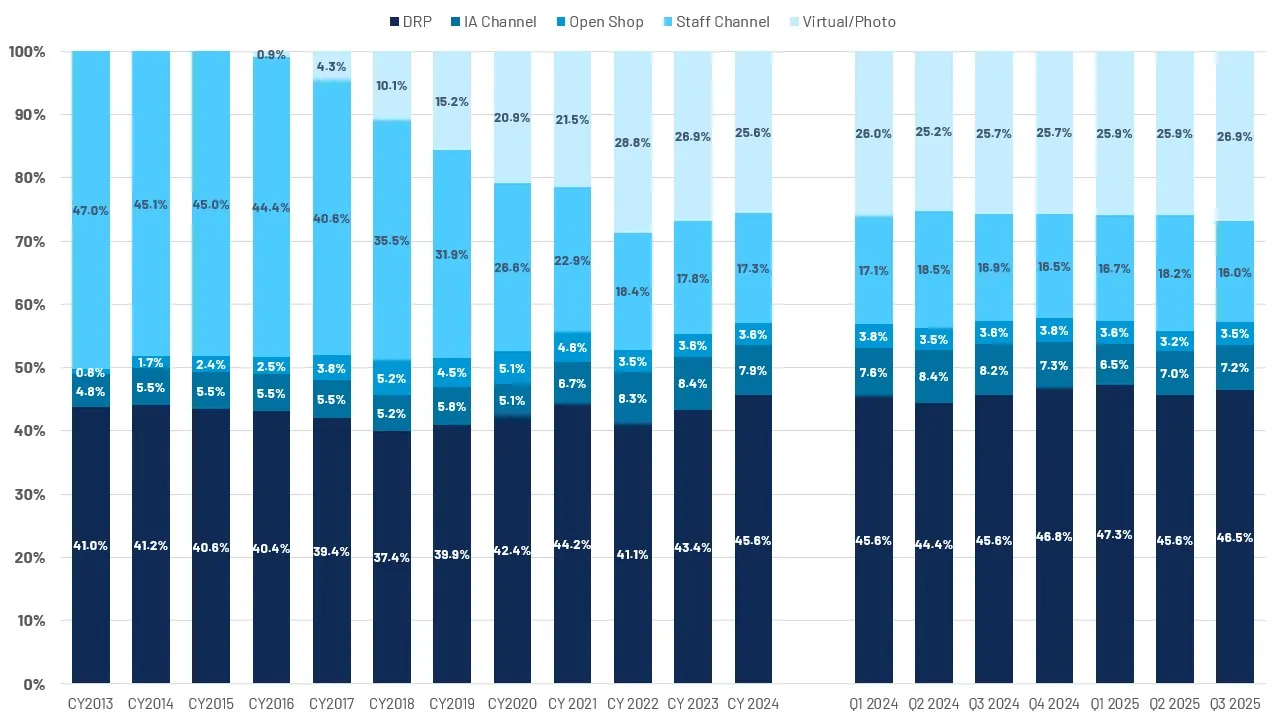
Method of inspection trends reflect a continued reliance upon direct repair programs to complete appraisals on behalf of insurance carriers. Carriers continue to evolve their mix of inspection solutions to meet the needs of their clients and long-term staffing and operations objectives. An increased total loss propensity adds additional pressure in getting vehicles to the right place – a shop or salvage yard – the first time. (Figure 15)
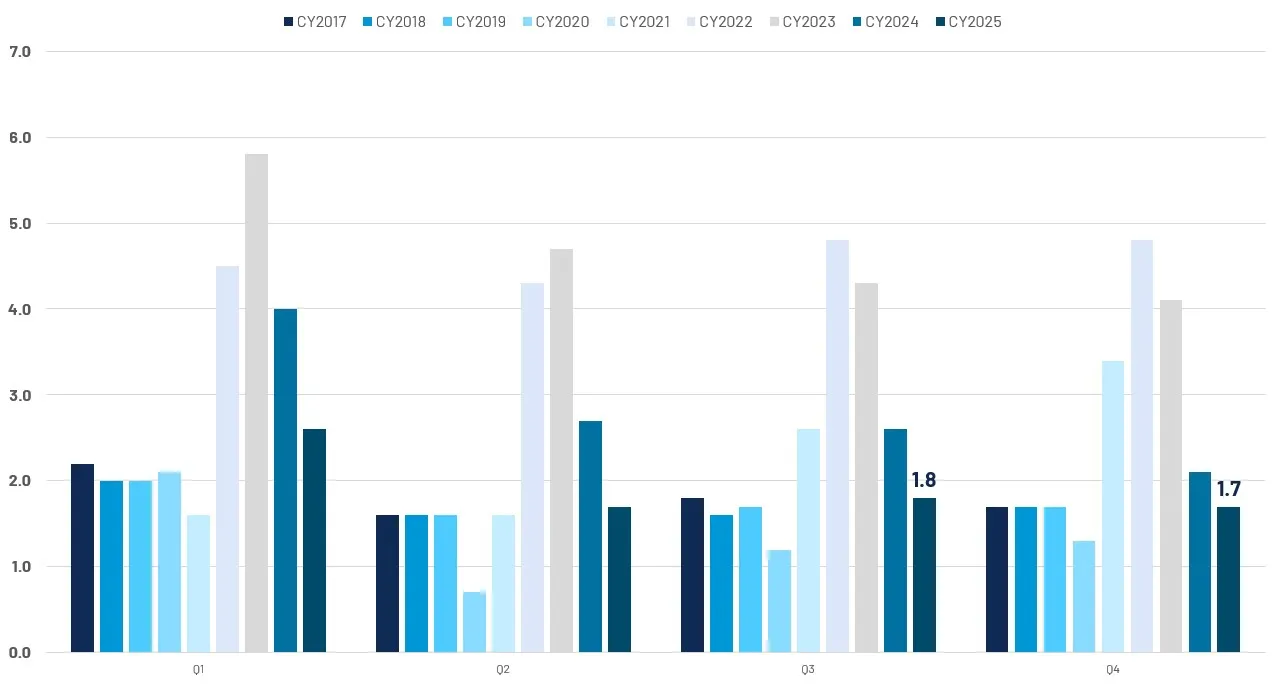
Shop backlogs continue to improve on a year-over-year basis. Where we saw more heavier hit vehicles being repaired in 2022 and 2023, decreased vehicle values and an older vehicle mix has increased total loss frequency, accounting, at least in part, to improved cycle times. Claims volumes, which remain down year-over-year, are also contributing to improved backlogs. (Figure 16)
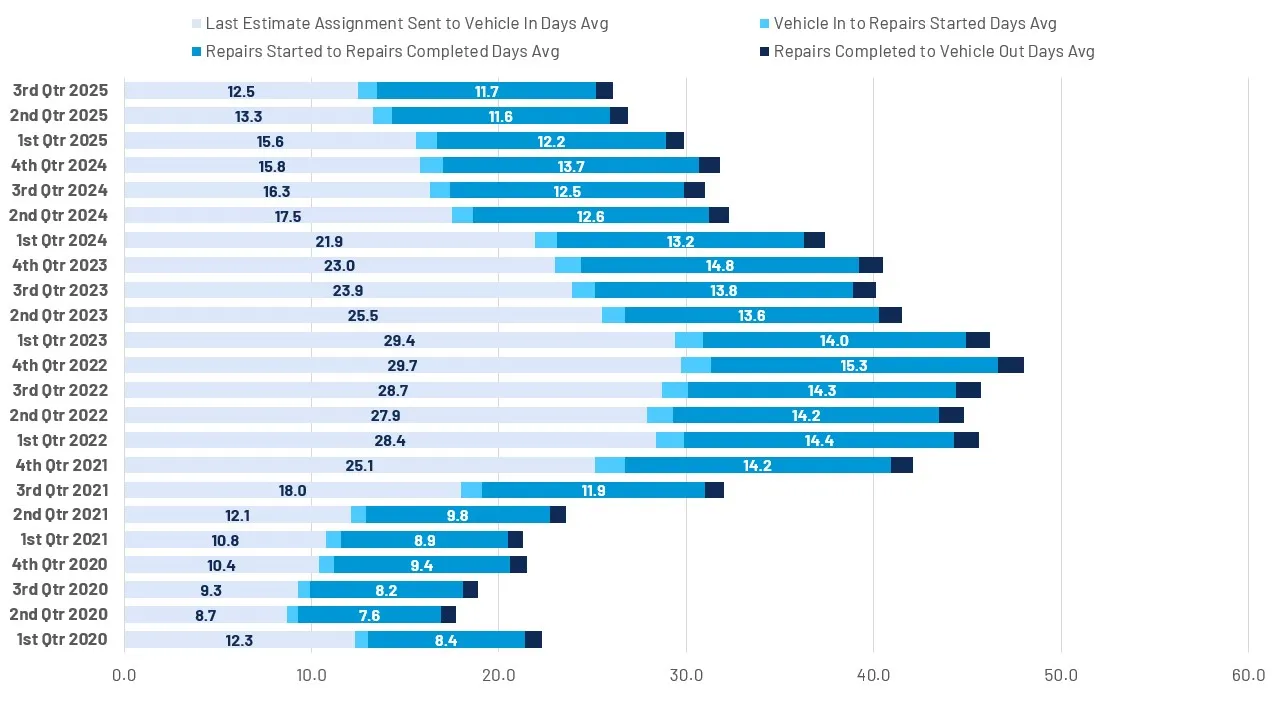
Improved backlogs and increased total losses are also reflected in improved cycle times. The average time between last estimate assignment sent and vehicle in (to the shop) are almost half of the days required in Q1 2023. Overall repair days remain down 2+ days in total from their peak yet remain up by multiple days relative to 2020. Factors such as increased supplement handling, vehicle complexity, and technician shortages could be contributing to elongated repair times. (Figure 17)
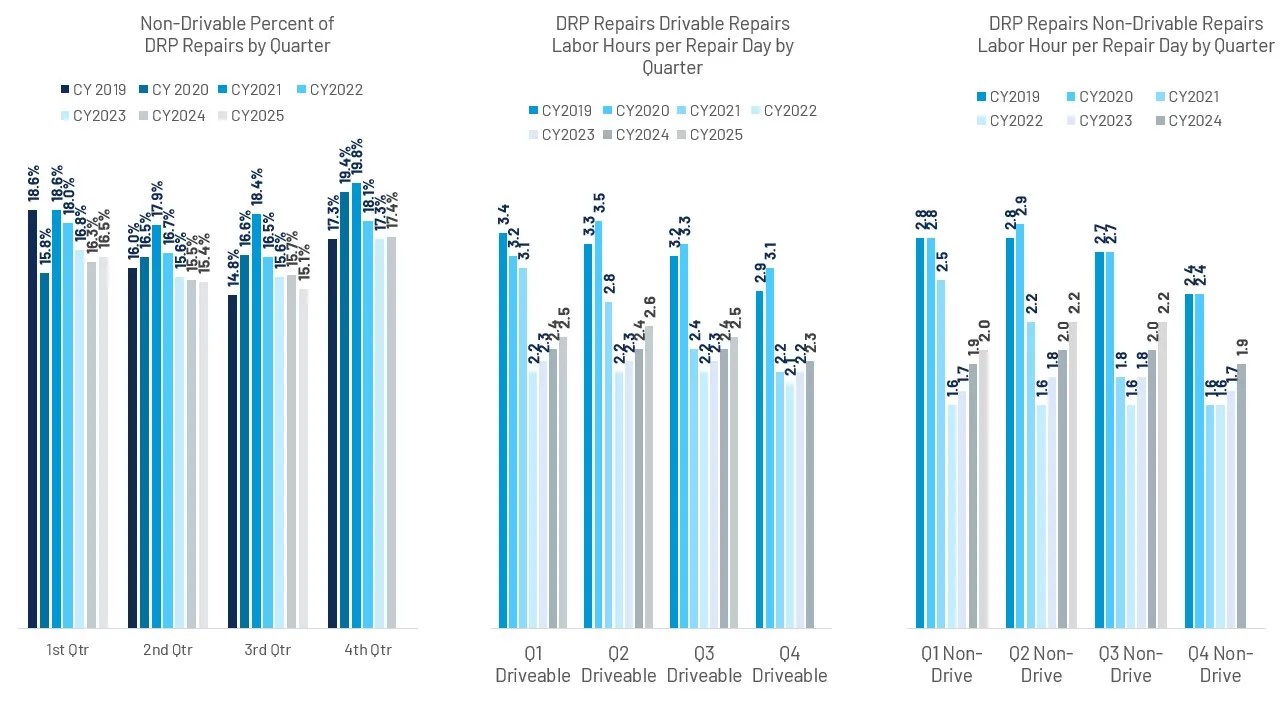
The share of non-driveable repairable claims was down in both the second and third quarters, likely a result in increased total loss activity. Daily productivity – measured by labor hours per repair day, indicated modest, yet noticeable improvements year-over-year, especially with non-driveable vehicles.
Given the increased propensity for repairs to include supplements, productivity improvements will likely rely upon improved communication and process efficiency between shops and insurance carriers. (Figure 18)

Casualty Industry Data
Year in Review Summary
As we near the close of 2025, all signs point to deepening challenges within auto liability injury lines for insurers. While claim frequency has been decreasing slowly across most lines of business, bodily injury remains an outlier, increasing quarter over quarter. Research suggests this anomaly is influenced by the building impact of social inflationary factors, especially within the post-COVID era. At the same time, medical billing inflation and indemnity outcomes continue to increase 3-4 times as fast as general economic inflation.
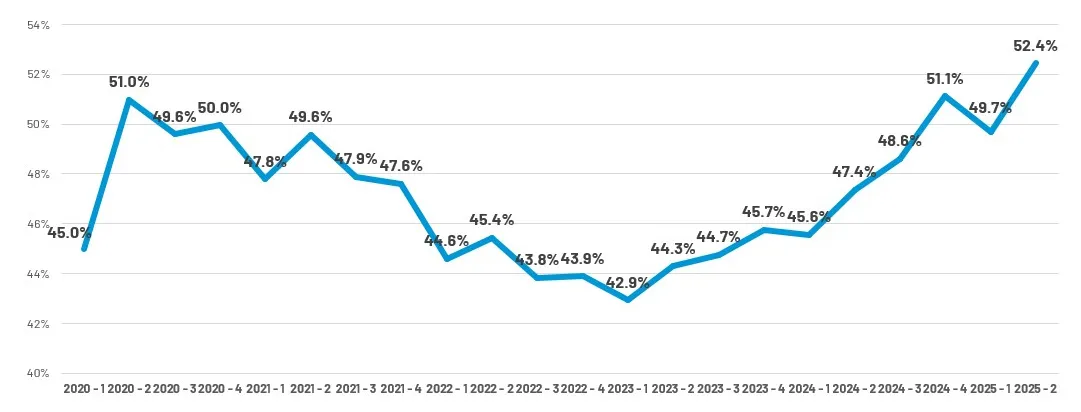
The combination of rising bodily injury frequency and severity has resulted in a notable and unprecedented indemnity shift within personal auto; Bodily injury indemnity now makes up the majority (52%) of liability dollars paid, even though less than one out of four property damage exposures have an associated injury exposure.
Treatment trends continue to shift toward a preference for high-dollar procedures such as CT Scans, Steroid Injections, and experimental treatments such as Platelet-Rich Plasma Therapy (PRP) and Extracorporeal Shock Wave Therapy (ESWT), further exacerbating billing inflation. Indicators of continued affordability challenges are reflected in the growing number of uninsured/underinsured injury submissions, especially in key venues such as California, where the minimum liability limits doubled at the beginning of the year.
Similar billing and treatment trends are reflected within first party injury lines (PIP, Medpay) although the overall indemnity impact has been blunted by decreasing claim frequency. In addition, tariff-sensitive medical billing - including drugs, medical supplies, and equipment - has shown notable inflation within 2025.
Third Party Trends
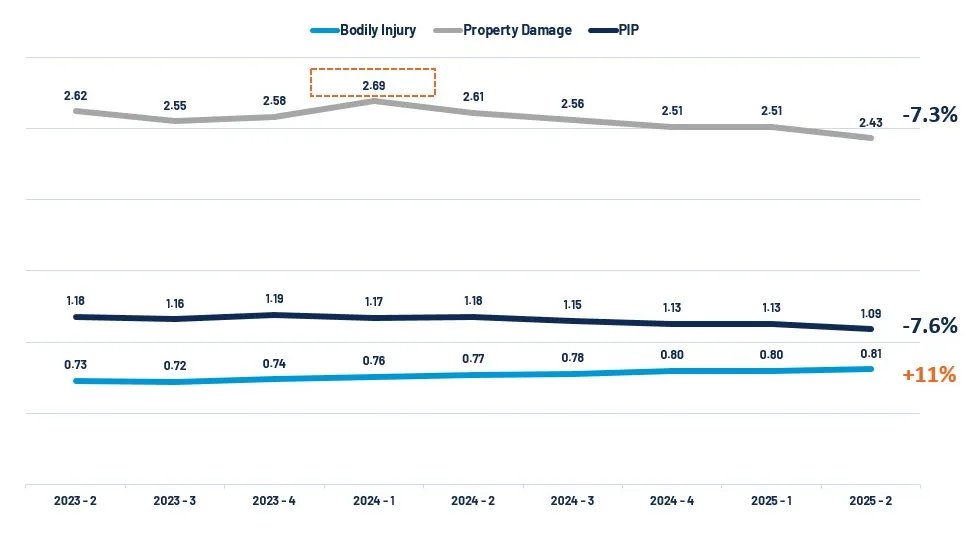
Bodily injury claim frequency has been increasing despite property damage and PIP claim frequency decreasing over the last 2 years. (Figure 1)
Average 3rd party bodily injury paid outcome is now $29.9K per injured party, which represents a 9.6% increase since Q2 2024 and a 32% increase since Q2 2021. (Figure 2)

BI dollars as a percentage of all liability dollars paid reached a new high of 52.4% as of Q2 2025 (Figure 3)
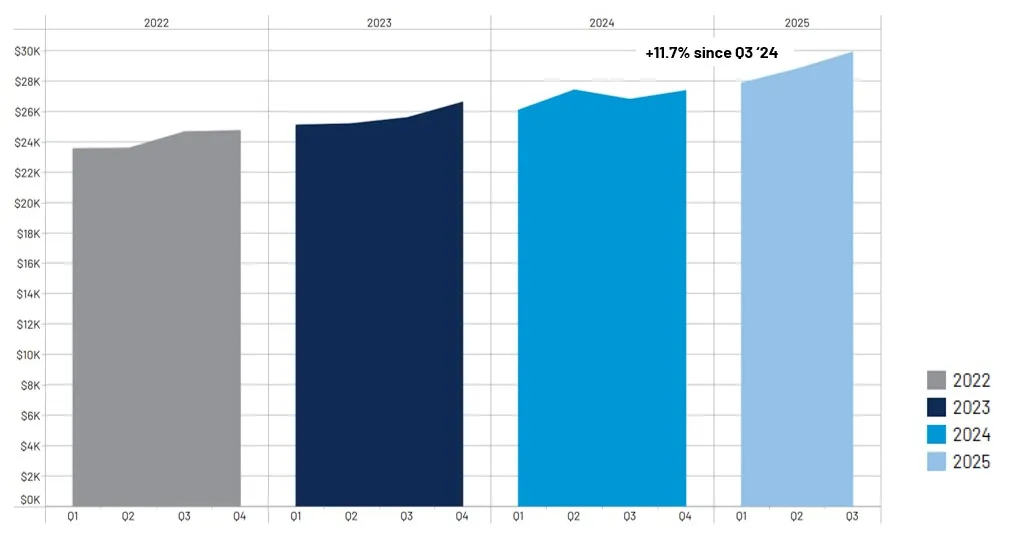
Average third-party medical bill submission per injured party increased 11.7% since Q3 2024 (Figure 4)
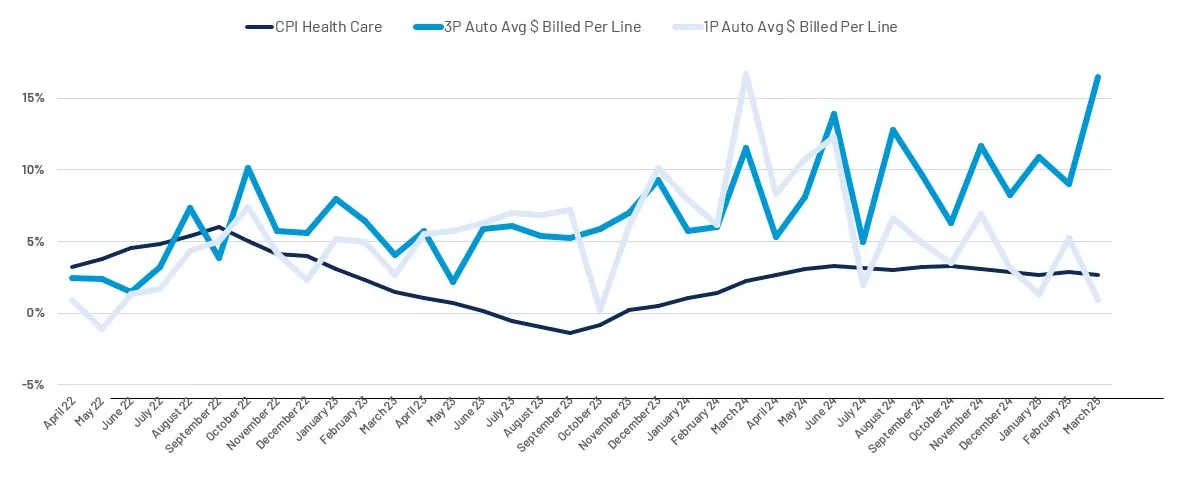
Third Party Auto Medical Billing inflation rates continue to outpace the Consumer Price Index for Health Care, while First Party Medical Billing inflation rates are moving closer to CPI. (Figure 5)
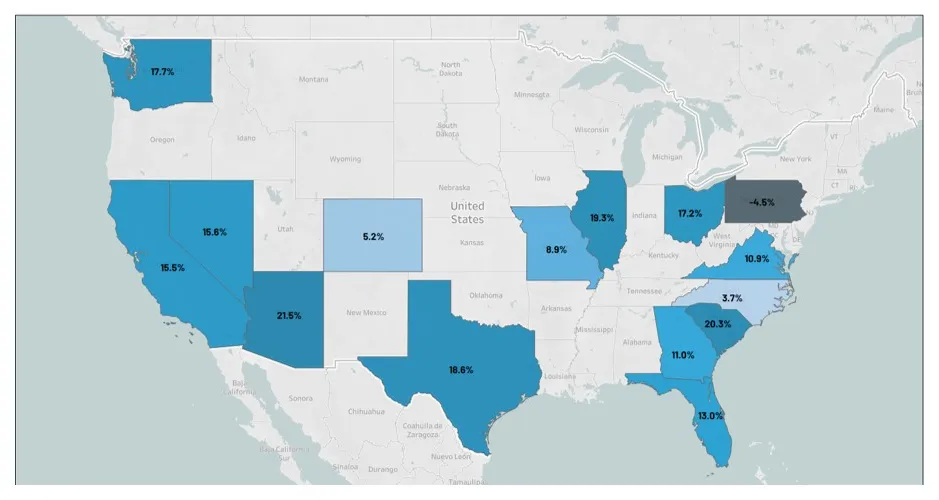
Largest severity increases in key volume states since Q3 2024 have occurred in AZ, SC, IL, TX, and WA. (Figure 6)
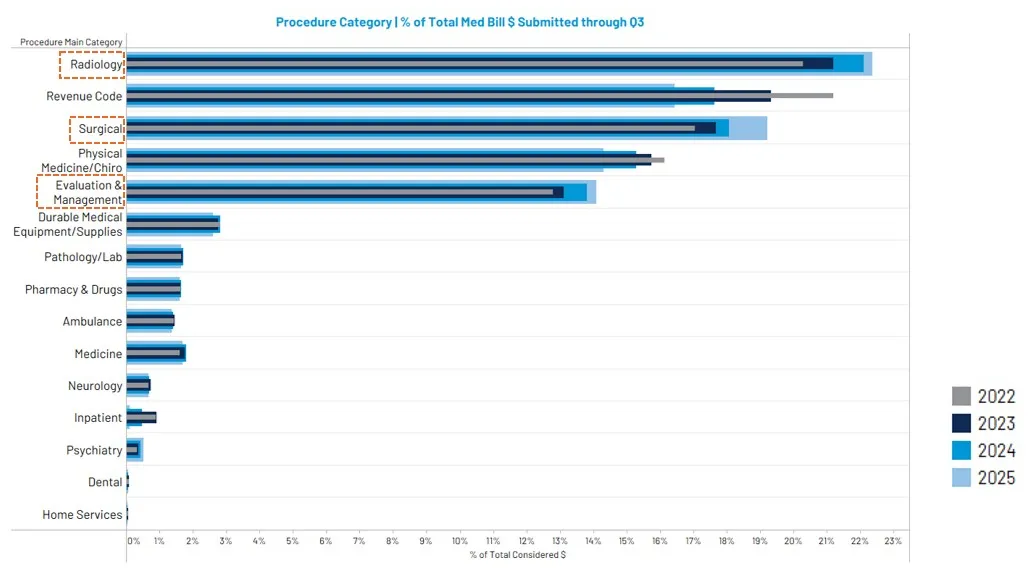
Distribution of procedure dollars shows increases in Radiology, Evaluation & Management, & Surgical as of Q3 2025. (Figure 7)
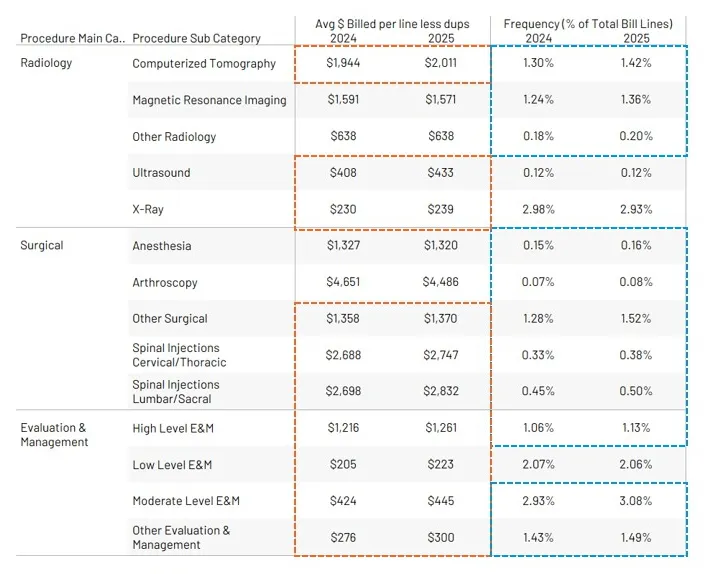
Drilling further into procedure category gains, price increases occurred in most subcategories, with notable bill frequency increases occurring for CT Scans, MRIs, Surgeries, Injections, and High-Level Eval & Management. (Figure 8)
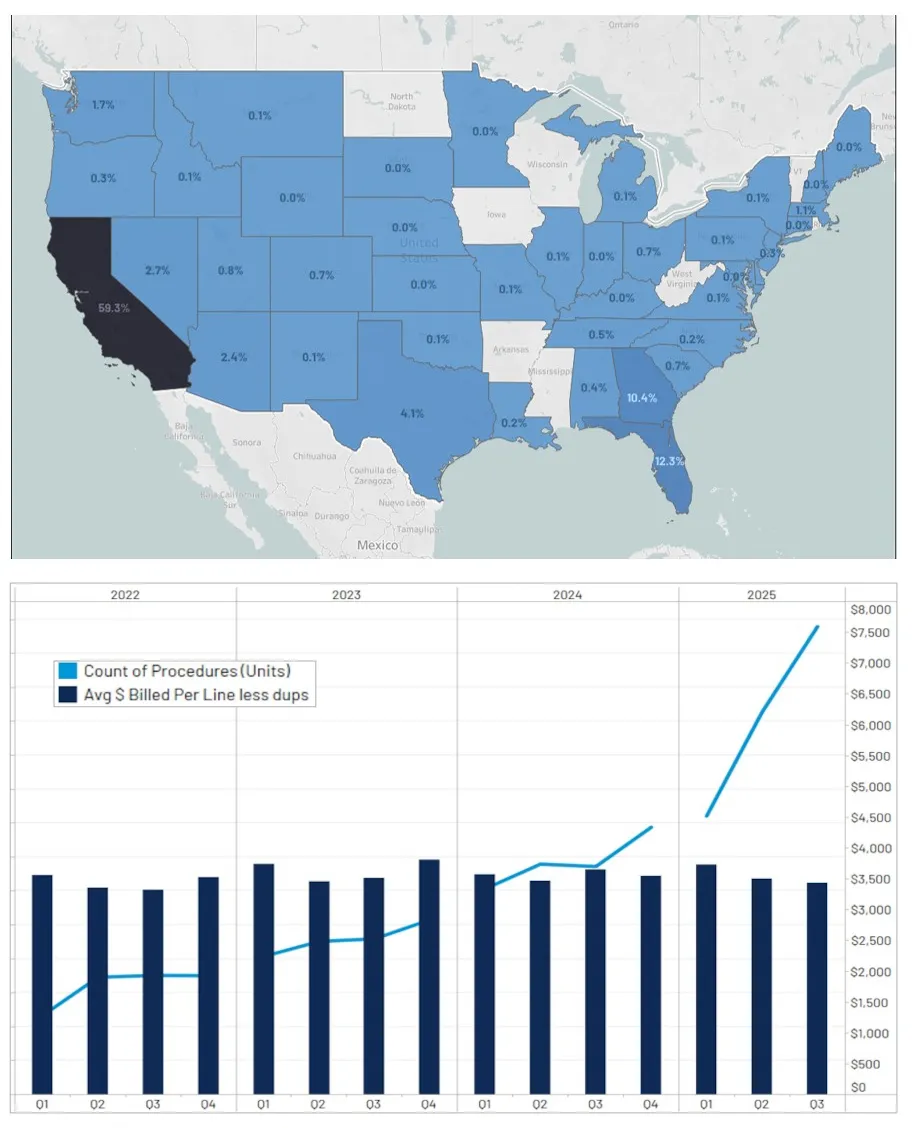
PRP procedures continue to increase rapidly in frequency. PRP code 0232T is now the 5th highest surgical procedure by total dollars billed. The average claimant has three separate PRP procedures, with most utilization occurring in CA. (Figures 9 & 10)
The percentage of third-party claims submitted for injuries caused by an uninsured or underinsured motorist continues to increase. (Figure 11)

First Party Trends
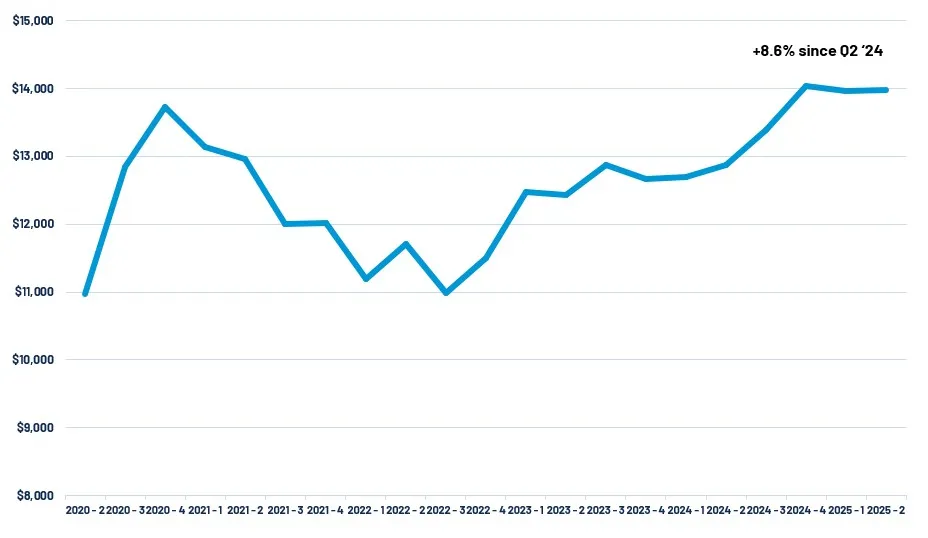
PIP claim paid outcome per injured party has increased 8.6% since Q2 2024. (Figure 12)
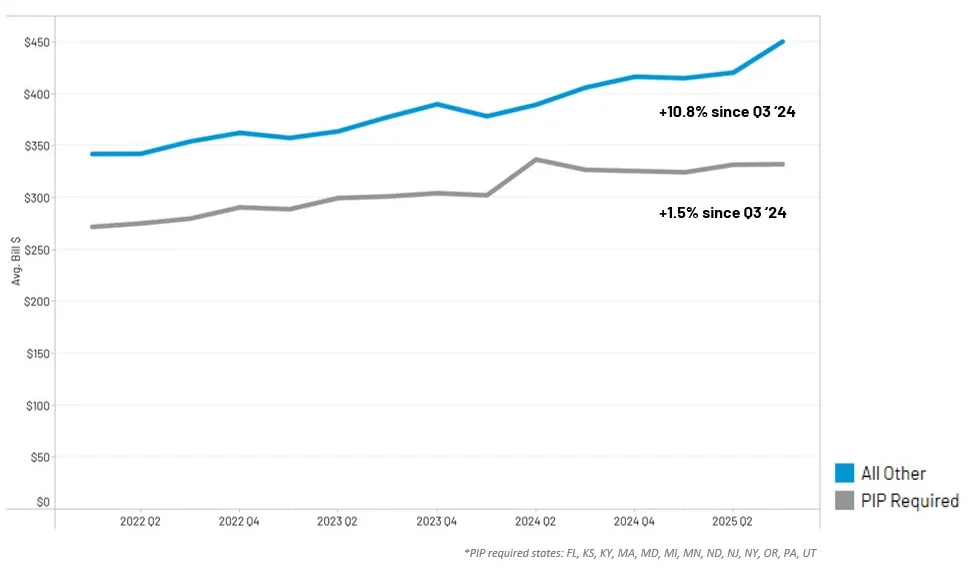
First-party bill line severity has increased 1.5% in PIP-required states and 10.8% in All Others since Q3 2024. (Figure 13)
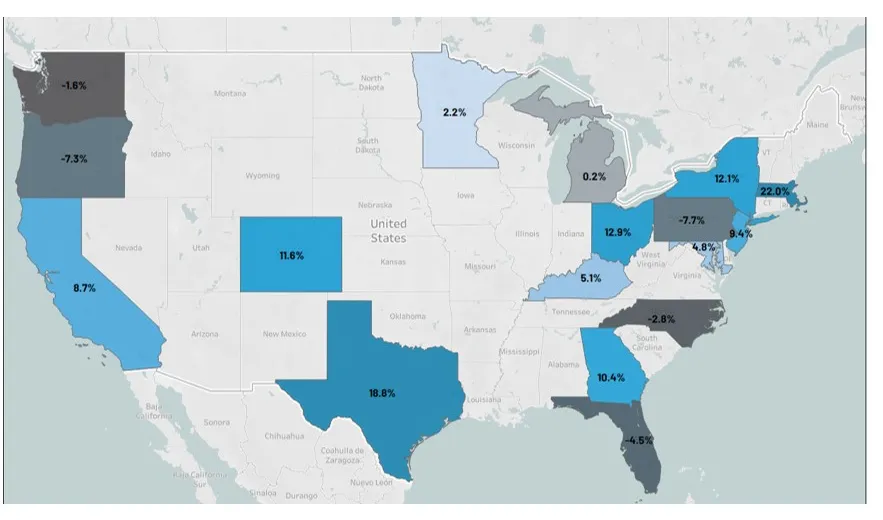
For key volume states, the most notable line level increases since Q3 2024 have occurred in MA, TX, OH, NY, CO, and GA. (Figure 14)
Distribution of procedure dollars shows notable increases in Radiology, Surgical, Eval & Mgmt, DME, and Pharmacy/Drug as of Q3 2025. (Figure 15)
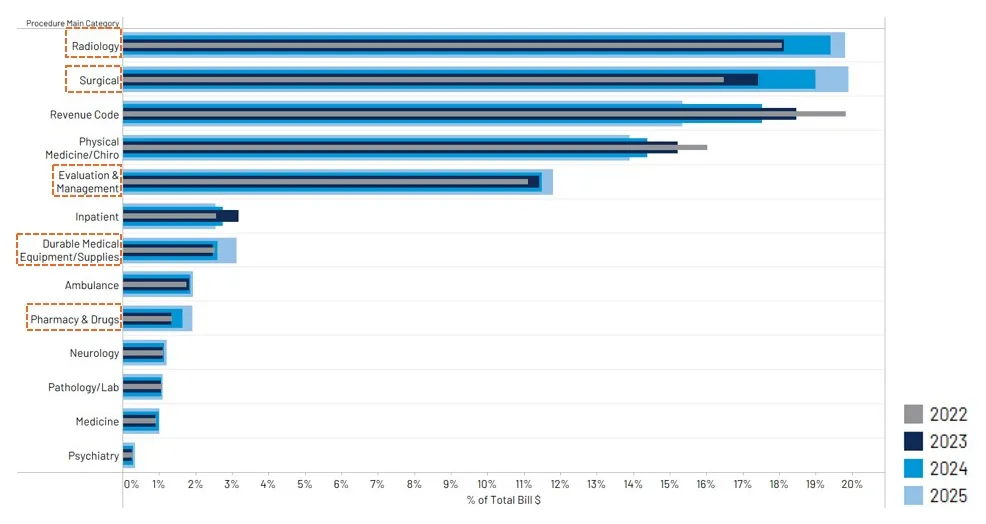
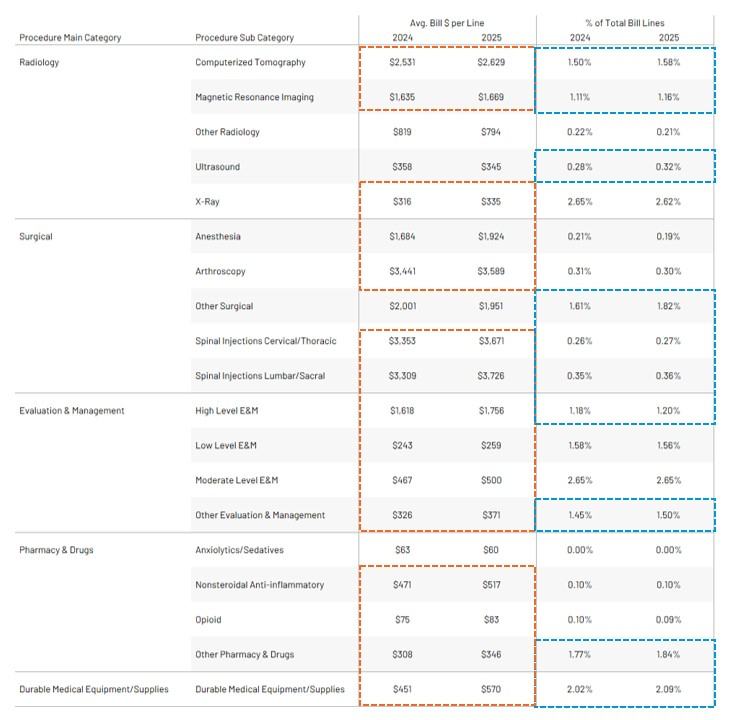
Drilling further into growth categories, movement is driven by both cost and frequency increases within most procedure subcategories. (Figure 16)
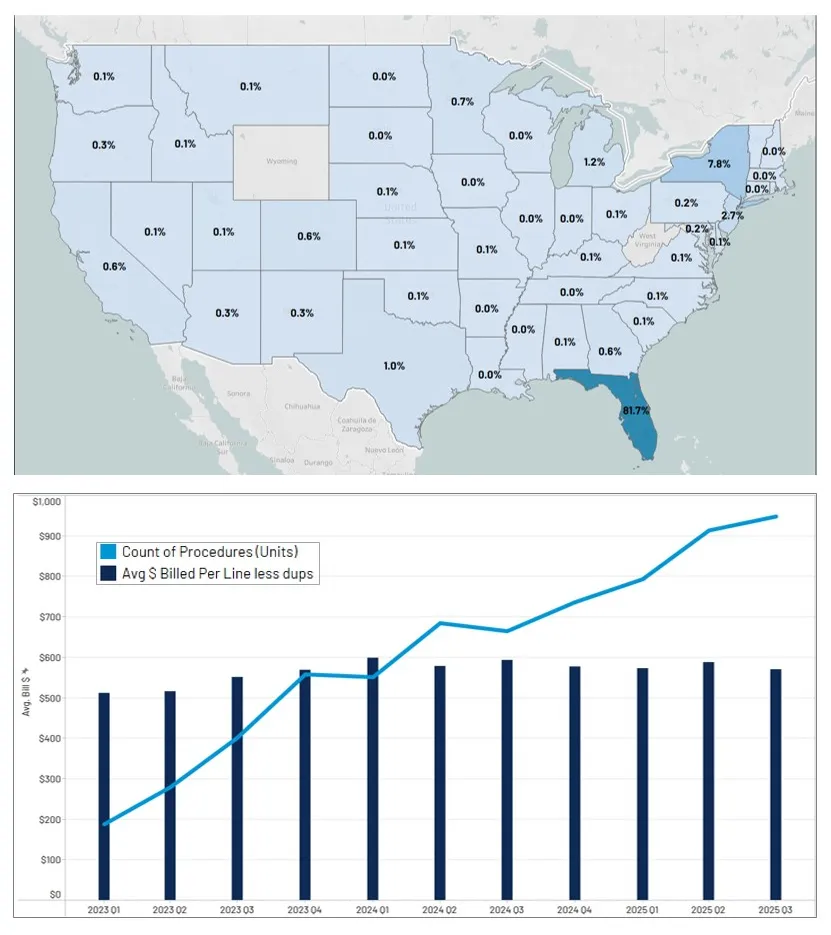
Extracorporeal Shockwave Therapy (ESWT) procedures are increasing in frequency. The vast majority of utilization is in Florida, where it is the second highest surgical code by $ billed with an average of 9 procedures per injured party. Similar to PRP, this procedure is classified as experimental and not reimbursed by Medicare or most private insurance. (Figures 17 and 18)


Disclaimer
The information and opinions in this publication are for general information only, are subject to change and are not intended to provide specific recommendations for any individual or entity. Although information contained herein has been obtained from sources believed to be reliable, CCC does not guarantee its accuracy and it may be incomplete or condensed. CCC is not liable for any typographical errors, incorrect data and/or any actions taken in reliance on the information and opinions contained in this publication.
Note: Where CCC Intelligent Solutions Inc. is cited as source, the data provided is an aggregation of industry data related to electronic appraisals communicated via CCC's electronic network or from total loss valuations processed by CCC. Where CCC Casualty is cited as a source, the data provided is an aggregation of industry data collected from claims data communicated via CCC Casualty’s electronic network.
Intelligent Solutions
Collision Repairers
Our solutions help repairers run more efficient body shop businesses, while making repair decisions simpler and faster.
Insurance Carriers
Our solutions help insurers make more confident decisions earlier, creating intelligent claims experiences that are more connected for their employees and more compassionate for their policyholders.
Auto Manufacturers
Our solutions help auto manufacturers enhance their consumers’ repair experiences, while connecting them to the industry’s largest repair network.
Get Your Complimentary Report