Q3

How the Economy and Supply Chain Disruption Are Forging a New, More Complex Auto Industry Reality
The automotive industry is navigating a period of complex and sustained economic uncertainty marked by rising costs and shifting global dynamics. In our Crash Course Q3 report, we explore how newly imposed tariffs are amplifying this uncertainty, creating ripple effects across the entire ecosystem, from global manufacturing and supply chains to consumer behavior and insurance economics.
Our analysis reveals several critical trends that illustrate how these economic pressures are reshaping industry behavior, operational models, and consumer decision-making:
- Original Equipment Manufacturers (OEMs) and suppliers are caught in a strategic paradox, compelled by tariffs to explore re-shoring and localizing production while simultaneously being squeezed by the rising costs and shrinking margins that make such investments difficult. The long-held certainties of global supply chains are shifting, forcing a complicated and costly rethinking of where and how vehicles and their components are made.
- Consumers are feeling the effects of today’s economic pressures. With inflation lingering, interest rates elevated, and vehicle prices continuing to rise, many households are experiencing added strain on their finances. This is evidenced by record levels of auto loan debt, rising delinquencies and repossessions, and a marked shift in behavior, including postponing large purchases, downgrading insurance coverage, and selecting higher deductibles, which in turn is depressing the frequency of smaller auto insurance claims.
- Collision Repairers face the three-part challenge of absorbing tariff-related cost increases, investing in expensive diagnostic and calibration equipment, and navigating a shortage of skilled technicians at a time when the number of labor hours logged each week is exceeding typical levels for this time of year. According to Crash Network, this could be a sign that shops may need to ramp up hiring so as not to overwhelm current employees working at near maximum capacity.
- Auto Insurers find themselves in a delicate balancing act. Rate increases spurred by rising inflation have increased consumer shopping, yet insurers are still grappling with unpredictable claims trends and the rising severity of both repairs and total losses. Additionally, casualty severity continues to outpace economic inflation due to the combined effects of medical billing and social inflation. Tariffs and regulatory changes to public health funding are potentially exacerbating these trends.
With the entire automotive ecosystem in a tenuous state, adapting to a new, unpredictable, and more expensive reality is imperative.
.svg)


Introduction:
The New Era of Uncertainty
For decades, the automotive industry operated on a model of increasing globalization and just-in-time efficiency – a model built for speed, scale, and predictability – but the post-pandemic world has upended that foundation. Instead of a return to stability, our data shows the industry is grappling with a convergence of three powerful economic headwinds reshaping the industry in real time: tariffs, inflation, and weak consumer confidence. Combined, they have created a new era of uncertainty for the industry.
While uncertainty is a constant in insurance and repair, this moment is categorically different – it's volatility that permeates every layer of the value chain. Tariffs are redrawing global supply maps, inflation is impacting repair economics, and consumer confidence is eroding demand in unpredictable ways. These forces aren't just influencing claims – they're reshaping the assumptions that underpin underwriting, pricing, and network design. The result: a level of systemic unpredictability that challenges traditional models and demands a new kind of intelligence and orchestration.
This is not merely a cyclical downturn; it is a structural shift. The core question is no longer just which vehicles to build, but where to build them, who can afford to buy them, and how they can be affordably insured and repaired.
This Crash Course Q3 report will explore the "supply chain reaction" and the interconnected pressures forcing adaptation across the entire automotive value chain. We'll examine how tariffs are acting as a catalyst for change, how consumers are responding to the financial squeeze, and how these forces are creating downstream challenges and opportunities for OEMs, suppliers, repairers, and insurers.

The Catalyst: Tariffs and the Re-Shoring Paradox
Many things in the current automotive environment are, in some way, a reaction to economic uncertainty, with tariffs the most potent accelerant.
Recent trade policies – including 25% tariffs on many imported vehicles, 50% tariffs on steel and aluminum, and new requirements for 85% of vehicle content to be sourced from the U.S. (or USMCA partners) to qualify for exemption – have injected cost and complexity into the global supply chain, forcing a fundamental reassessment of manufacturing and sourcing strategies that have been in place for decades.
The Center for Automotive Research (CAR) estimates a total cost impact of $107.7 billion across all automakers in the U.S. As a result, OEMs are confronting a challenge that goes to the core of their business model. For years, the origin of a component was a matter of logistics and cost efficiency, but now, where the part comes from matters.
This has triggered a difficult and expensive reevaluation of the entire supply chain. Analysts expect that dozens of vehicle models will need to be re-engineered over the next 12 to 18 months in a concerted effort to meet the 85% domestic content threshold.
This has given rise to a re-shoring paradox. While the tariffs are designed to drive a shift toward U.S.-based production, in the near-term they also challenge the manufacturer profitability needed to afford that investment. For example, the rising costs of imported raw materials and components – like steel, aluminum, and electronics – are squeezing manufacturer margins. This financial pressure delays the investments needed for U.S. expansion. OEMs must balance the high cost of continuing to rely on global supply chains and the front-loaded expense of localizing production.
This uncertainty has also forced a strategic pivot in product offerings. The transition to electric vehicles (EVs) faces lower-than-expected consumer demand and supply chain complications; and now with the impending expiration of the $7,500 federal tax credit for new EVs, major manufacturers are scaling back.
Ford has paused a $12 billion EV investment to pivot towards hybrids. General Motors has delayed the rollout of several EV models and scaled back production targets, with Cadillac abandoning its plan to be all-electric by 2030. Honda and Nissan have similarly nixed certain EV models in favor of hybrids and SUVs.
This leads to the question of how these higher expenses will ripple downstream. As OEMs re-shore production and re-engineer vehicles to comply with tariffs, the associated costs will likely be passed on. In an environment where consumers are already financially strained, their ability to absorb these higher prices is one of the biggest question marks hanging over the industry's future.

The Consumer Squeeze: Navigating Financial Strain
The macroeconomic pressures rattling the automotive industry are tangible realities impacting household budgets and influencing purchasing decisions. Amid sustained financial strain from inflation and high interest rates, consumers are feeling squeezed, forcing them to re-evaluate big-ticket purchases, including vehicles, insurance coverage, and credit usage.
Household finances show clear signs of stress. Total household debt hit a staggering $18.2 trillion in the first quarter of 2025, with auto loans accounting for $1.66 trillion of the total. Loan delinquencies are also rising sharply; nearly 8% of all auto loans are now 30+ days delinquent, the highest level recorded since 1994. Consequently, vehicle repossessions jumped by 43% from 2022, reaching 1.73 million in 2024.
This financial fragility is reflected in consumer sentiment. The University of Michigan's Consumer Sentiment Index indicated slight improvement in July 2025, but remains 18% below December 2024, noting that "sentiment remains broadly negative," with consumers concerned about the trajectory of the economy and the potential impact of tariffs. This pessimism directly influences behavior in the auto market, where 62% of consumers feel it is a bad time to buy a vehicle due to persistent high prices and interest rates.
To cope with these pressures, consumers are making difficult choices:
- Delaying Purchases: A recent Guardian Survey found that 35% of consumers have postponed or canceled plans to buy a home (22%), a car (8%), or both (5%) due to economic uncertainty.
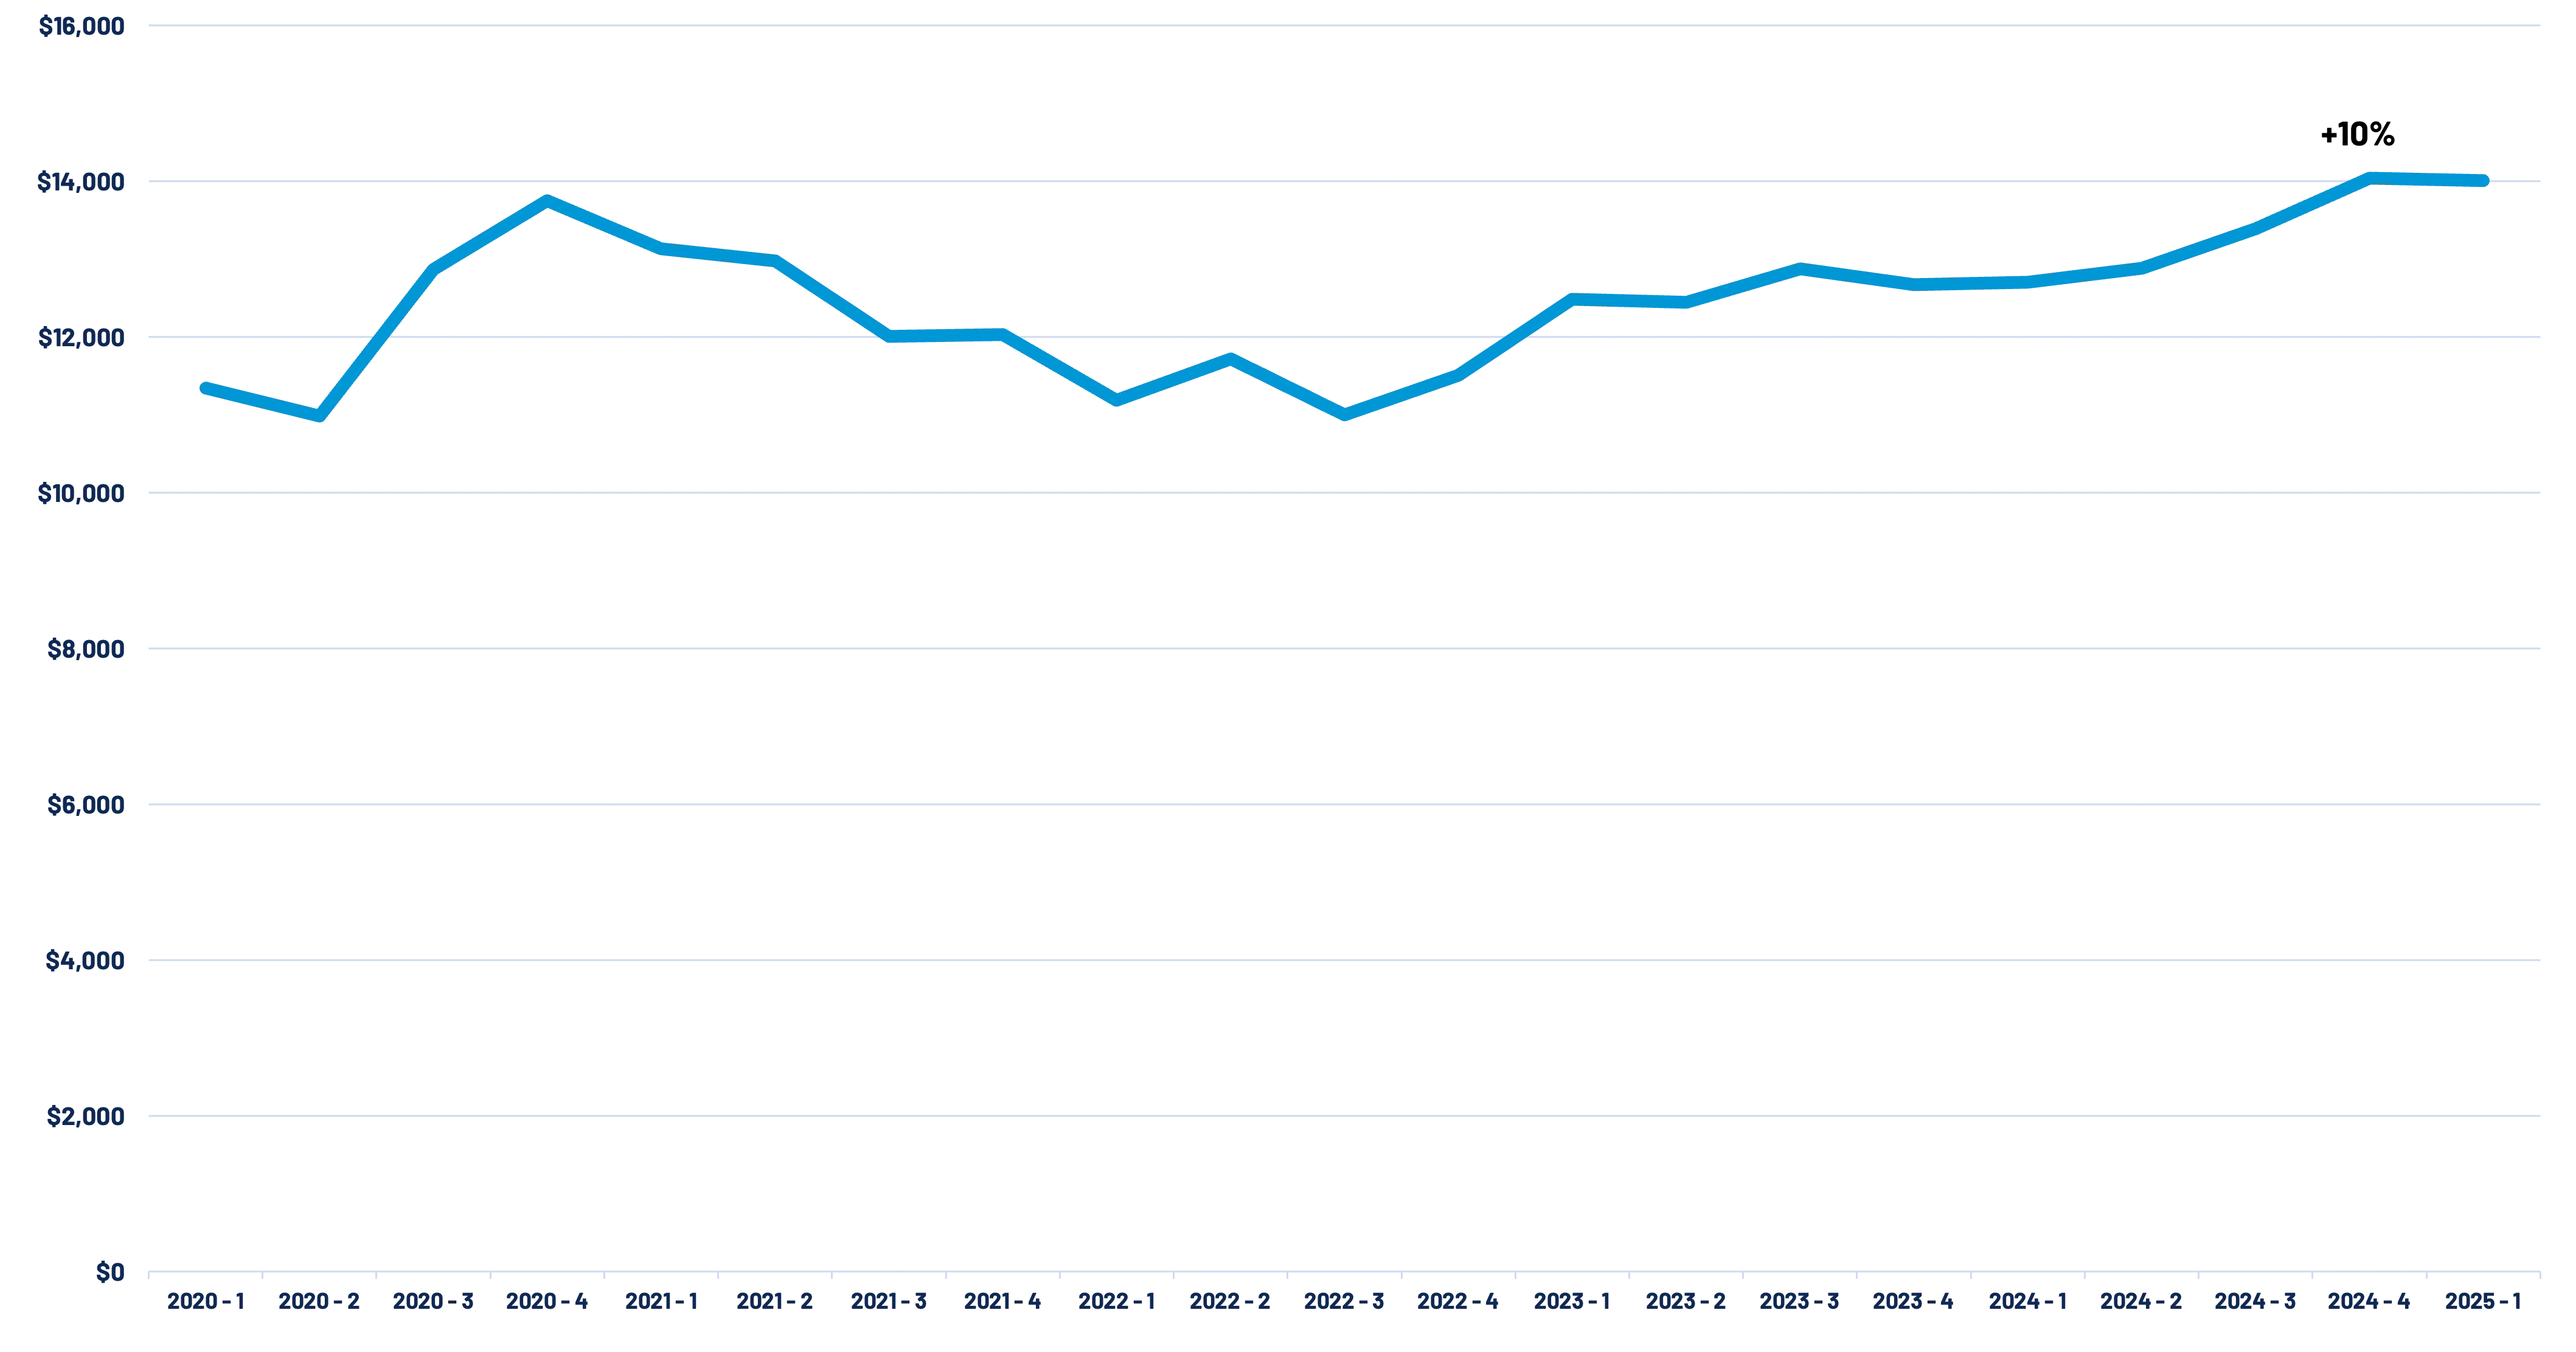
- Stretching Affordability: For those who do purchase a vehicle, affordability is a major challenge. Edmunds' Q2 2025 report shows that while buyers are putting less money down, the average new vehicle loan amount has reached an all-time high of $42,388. To manage payments, loan terms are being extended, with 84-month loans now accounting for a record 22.4% of new vehicle financing. The number of consumers with monthly payments over $1,000 has also hit a record high at 19.3%. And nearly 25% of trade-ins on new vehicle purchases had negative equity, with the average amount owed on these "upside-down" loans reaching another all-time high of $6,838.
- Cutting Back on Insurance: The financial strain is also evident in how consumers manage their insurance costs. The Guardian Survey also revealed that 1 in 3 people would temporarily go without insurance to free up funds for necessities. Over the past year, 29% have downgraded or canceled some type of insurance, with auto insurance seeing the steepest decline at 15%. This includes an 8% shift from full coverage to liability-only policies.
- Shifting to Higher Deductibles: One of the most significant trends is the consumer shift toward higher deductibles to lower their premium payments. According to CCC data, the most common deductible ($500) has decreased by 6 percentage points since 2021, and $1,000 deductibles have seen a nearly 5-point increase. $2,000 and $2,500 deductibles have also seen noticeable increases. (Figure 1)

The decision to take on higher deductibles, drop collision and comprehensive coverages, or forgo repairs and/or filing a claim altogether is a primary driver behind the decline in claim frequency, particularly for lower-value claims. What used to be an insured repair may now be delayed, self-paid, or ignored completely, and the claims that are filed are becoming increasingly complex and costly and may include higher rates of prior unreported damage.
Additionally, the average total cost of repair continues to climb, driven by rising part prices and the ever-increasing complexity of vehicle technology, particularly Advanced Driver-Assistance Systems (ADAS). (Figure 2)
The Downstream Impact: A New Reality for Auto Claims and Repair
The combination of tariff-driven cost pressures and the consumer financial squeeze create powerful downstream currents for the auto insurance claims and collision repair industries. While these sectors are interconnected, they are experiencing the new economic reality in distinct ways.
The Auto Insurer's Balancing Act
After several years of poor performance, the P&C insurance industry’s Net Combined Operating Ratio (NCOR) showed marked improvement in 2024, finishing at a profitable 96.6%. Personal auto, in particular, improved by nearly 10 points to a 95.3% NCOR. However, Triple-I and Milliman reported that the overall industry NCOR is projected to rise to 99.3%, driven largely by homeowners' insurance challenges. Personal auto is expected to see its NCOR tick up to 96%, while commercial auto is forecasted to remain unprofitable at 103%.
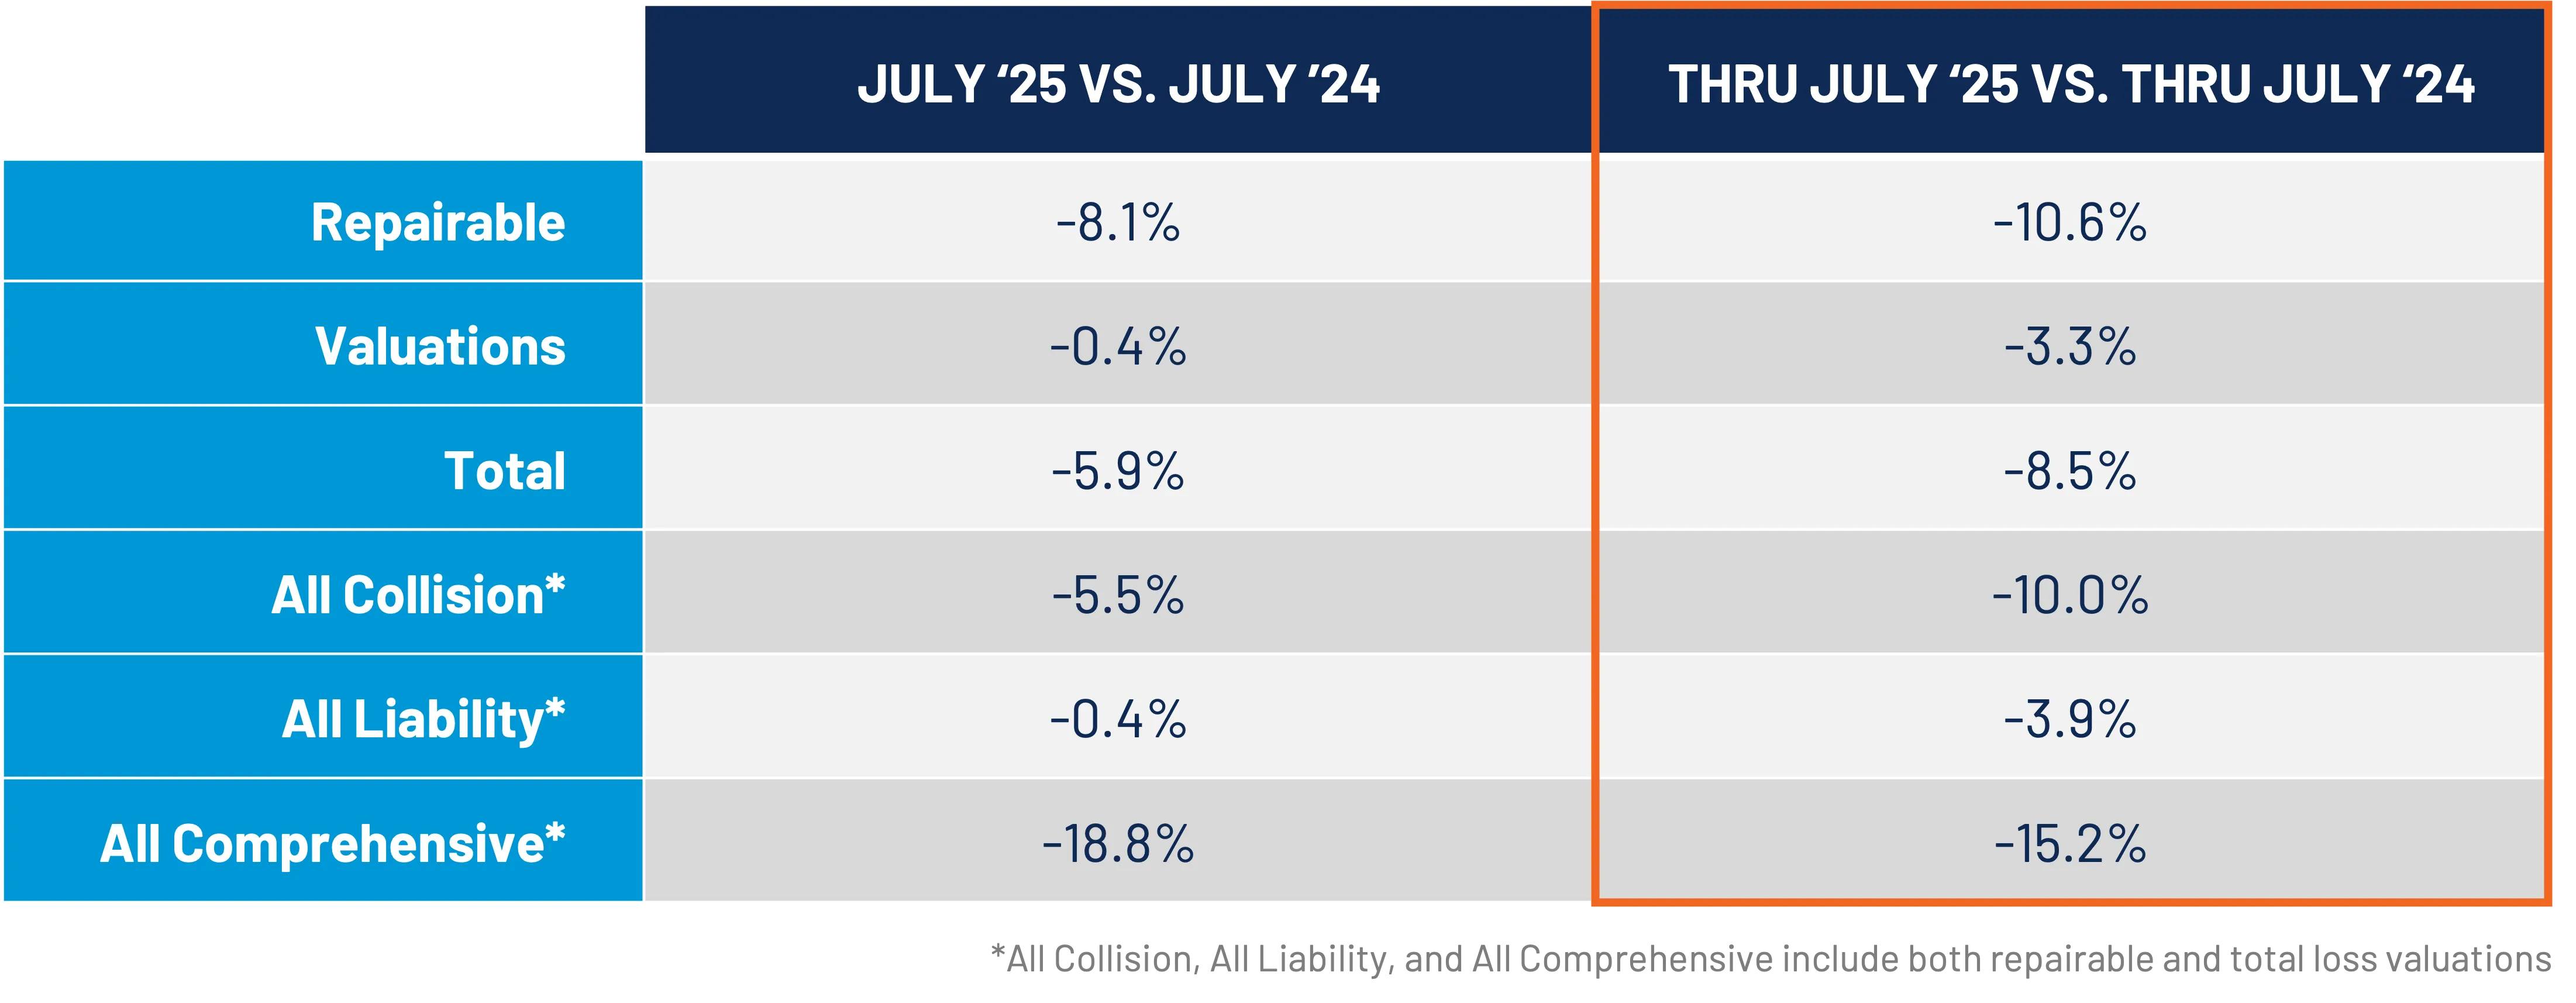
CCC data indicates total industry claim counts are down 8.5% year-over-year through July 2025. (Figure 3) This is not because roads are safer; in fact, overall moving violations were up 17% year-over-year in 2024. The decline in claims counts is simply a direct reflection of the consumer behaviors detailed earlier.
- First-Party Claims Lead the Decline: Collision and comprehensive claims account for nearly 90% of the annual decline in volume. Comprehensive claims alone are down 15.2% through July 2025. (Figure 4) This is partly due to fewer severe weather events compared to 2024, but it is also a story of economics.
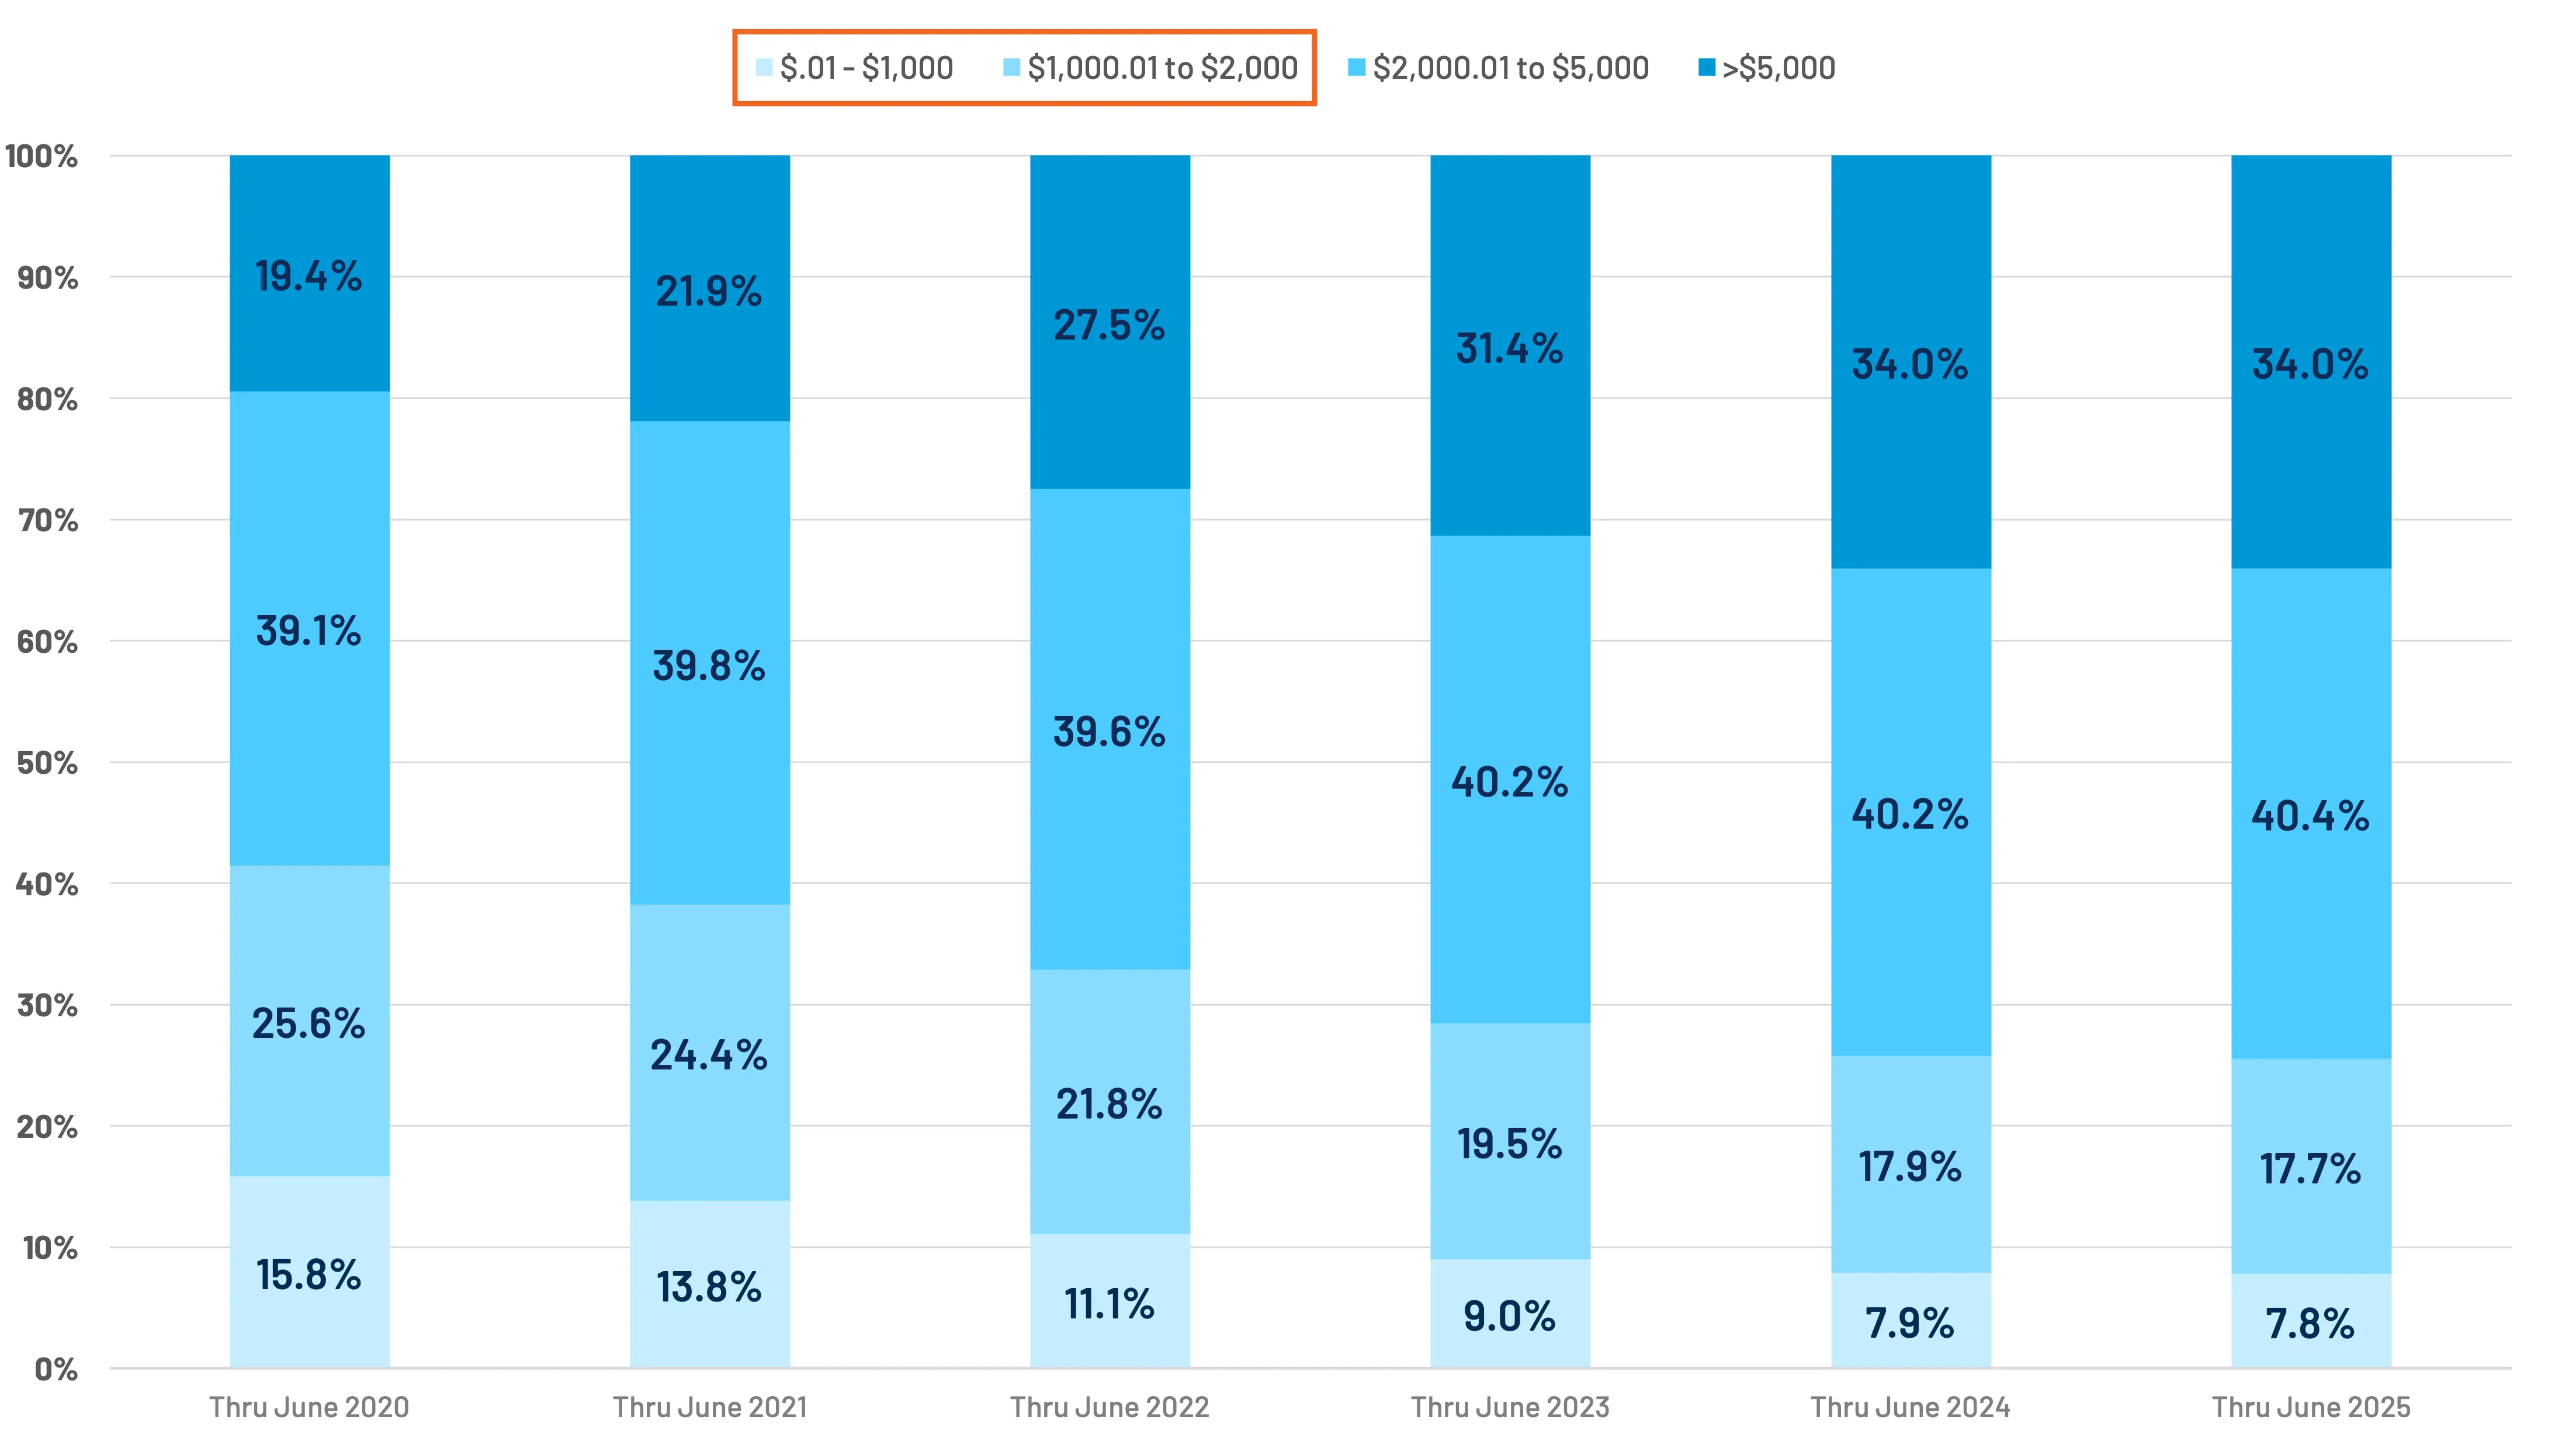
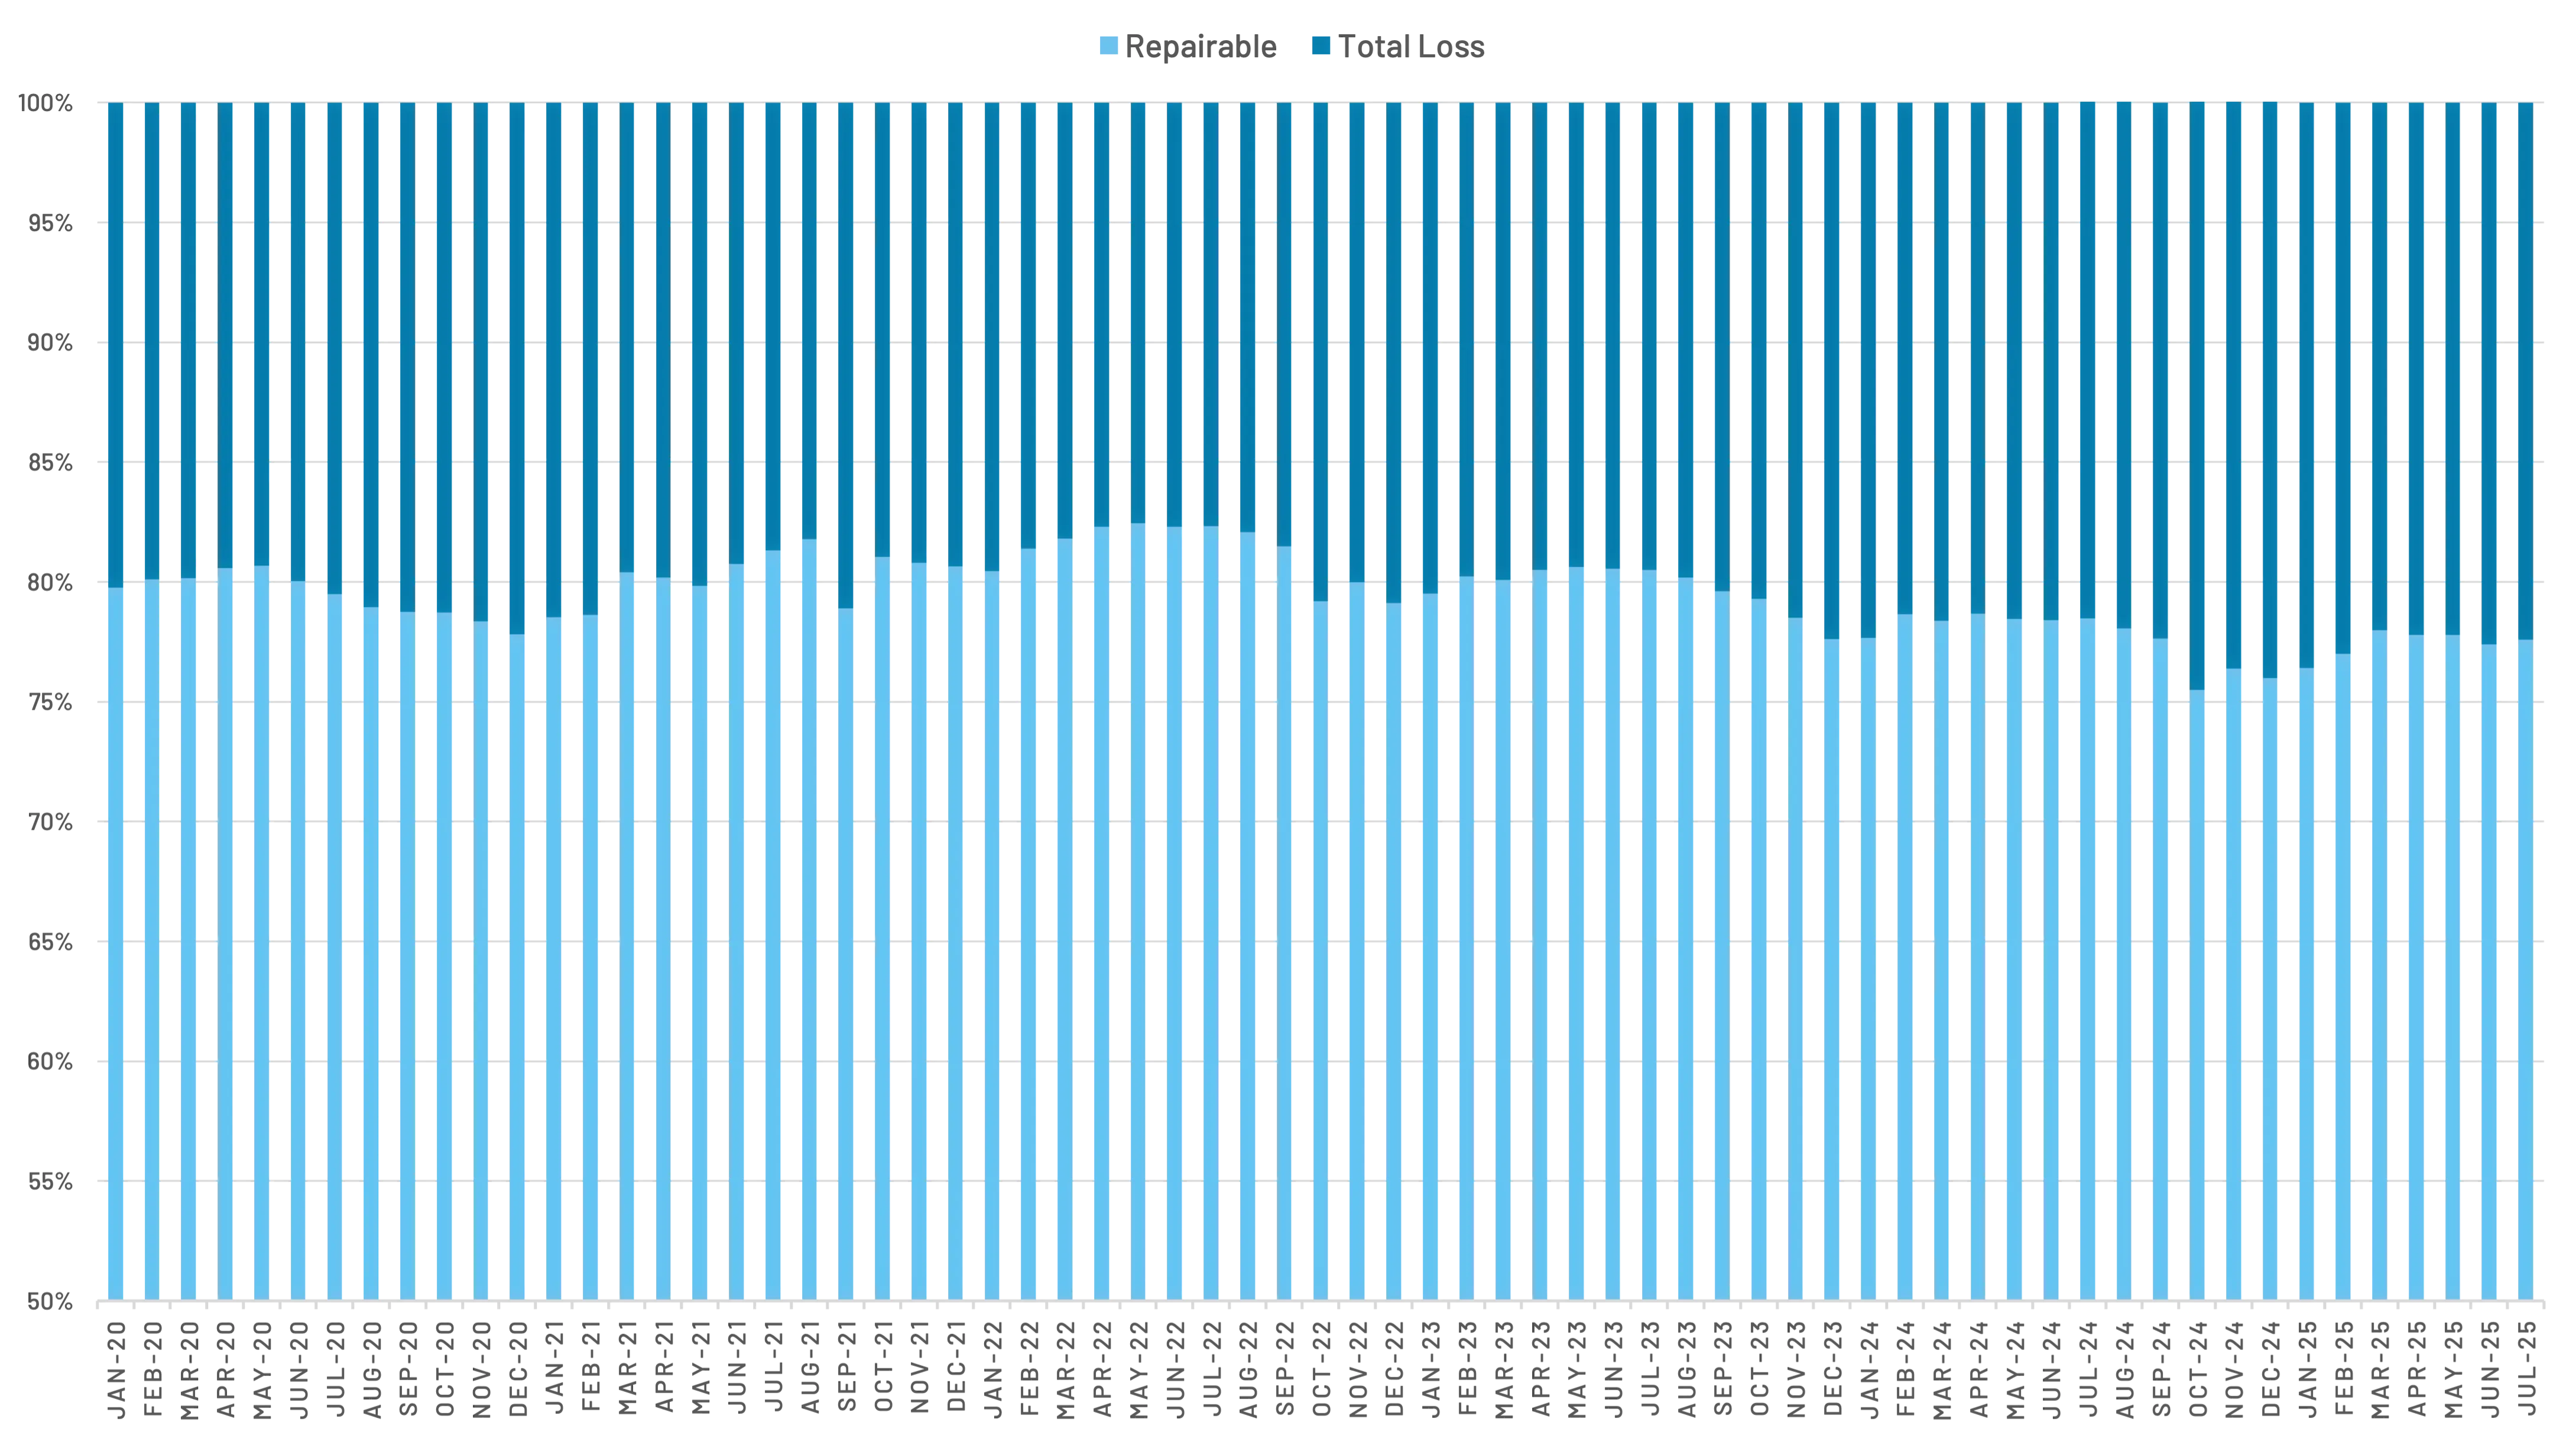
- The Discretionary Nature of Claims: The share of repairable appraisals for damages of $2,000 or less declined from 41.5% in 2019 to just 25.5% through June 2025. (Figure 5) With higher deductibles and the potential for claim filing to affect insurance rates, consumers are simply not filing smaller claims, choosing instead to pay out-of-pocket or live with the damage. This discretionary filing behavior is a direct consequence of financial pressure.
While claim frequency is down, severity has increased. Combined with an aging vehicle parc, rising parts prices, and increasing repair complexity, the average cost of repair continues to climb, muting the bottom-line benefits of lower claim volumes.
The Collision Repair Shop's Reality
Collision repairers are absorbing pressures from many directions:
- Tariff and Cost Impacts: An IMR survey of repair shops in April 2025 found that 38.6% reported operational impacts from tariffs, with cost increases being the most common issue. Larger shops with eight or more bays are disproportionately affected, with 73.7% citing tariff-related cost increases compared to just 16% of small shops. (Figure 6)
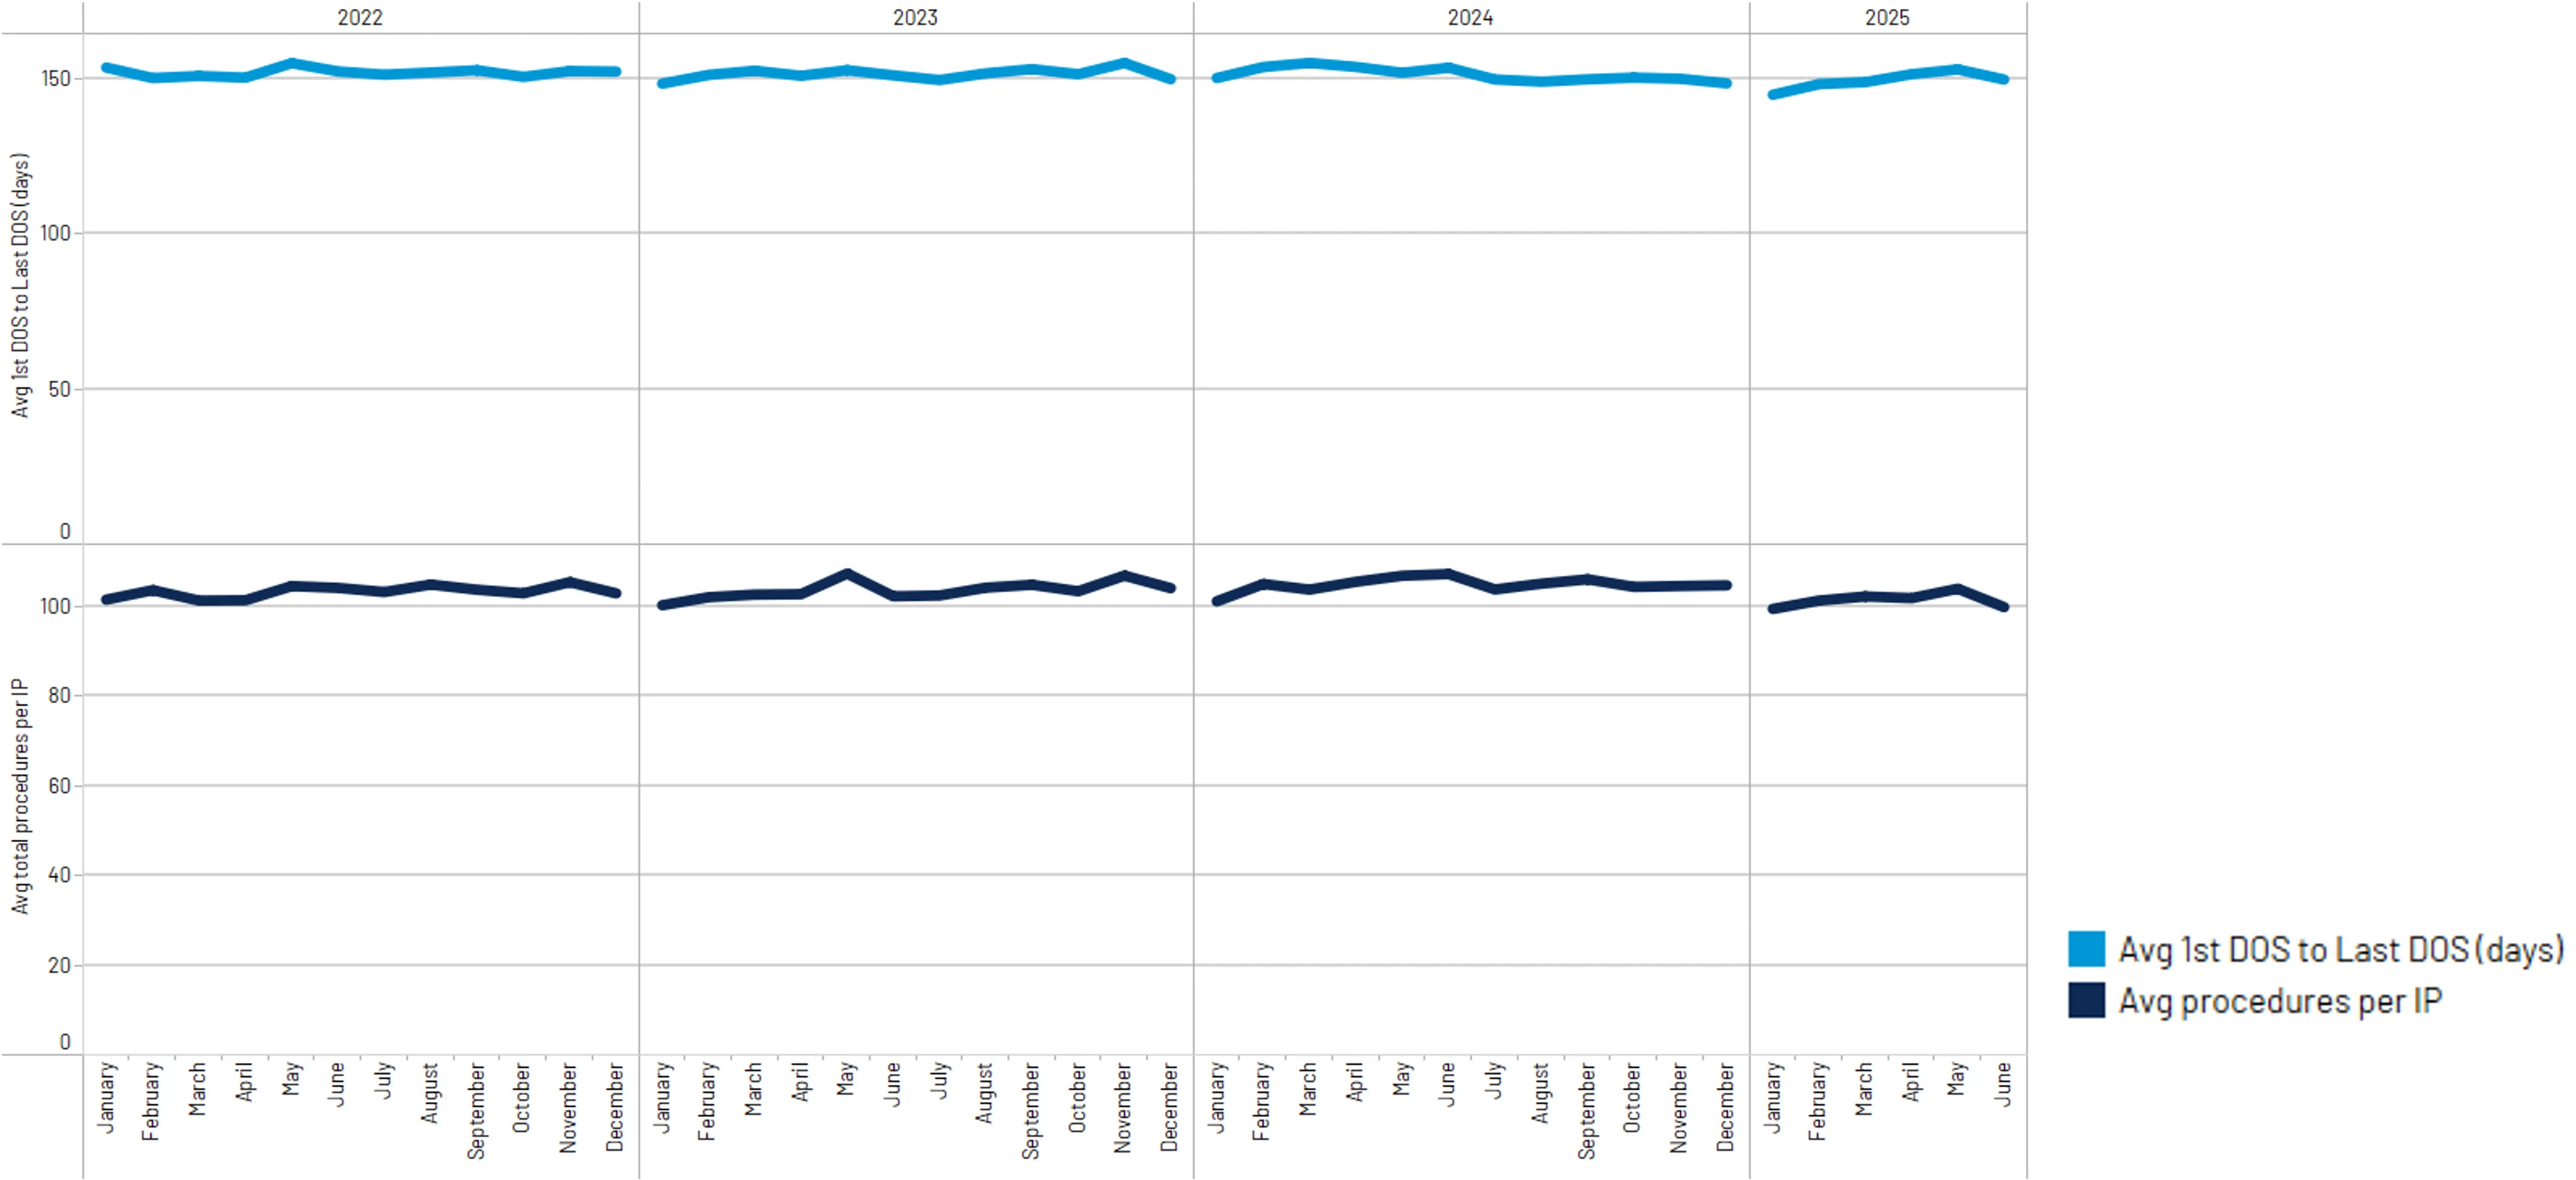
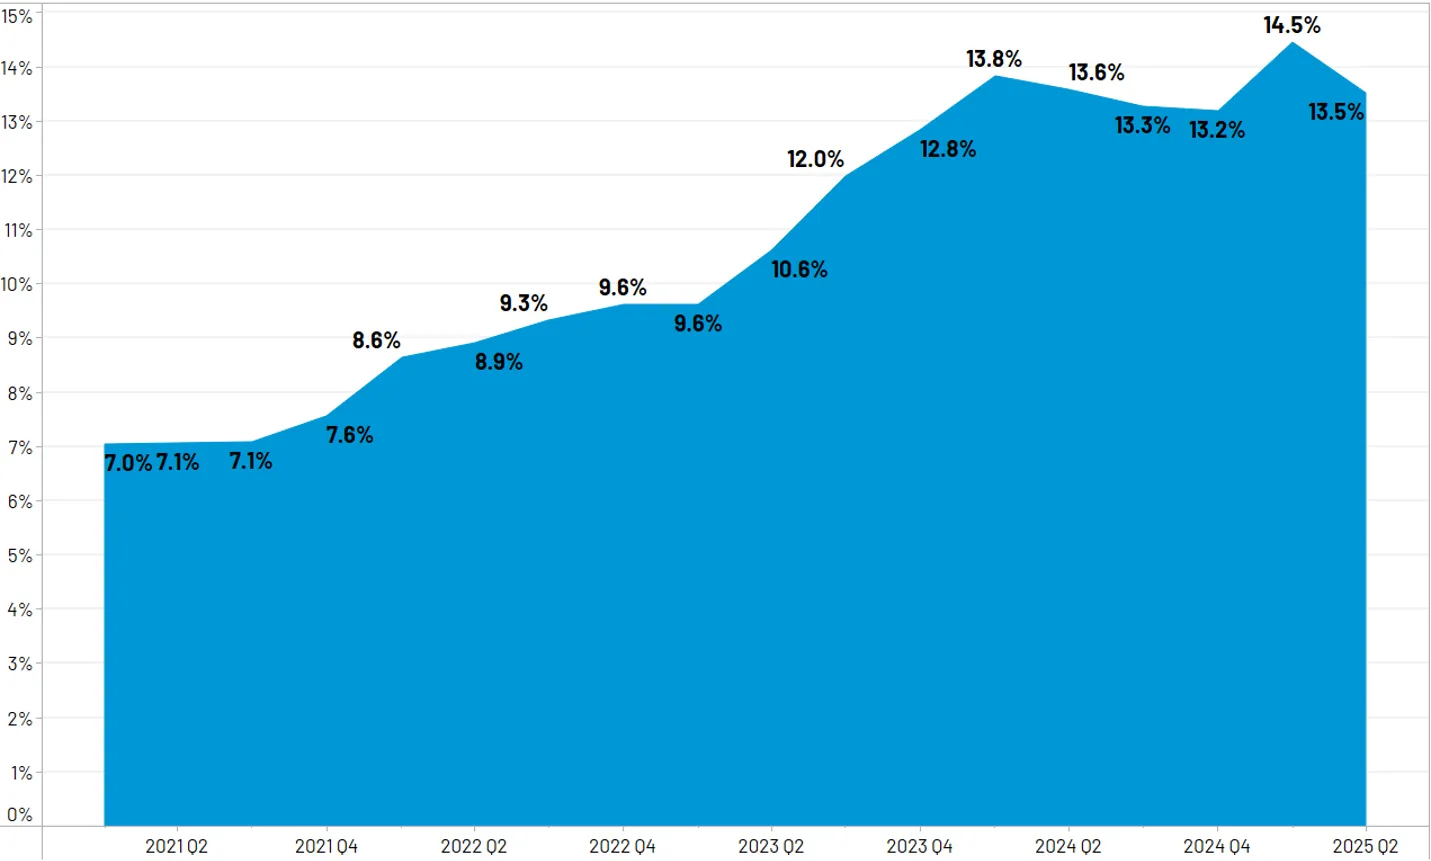
- The Rising Cost of Complexity: Modern vehicles are computers on wheels and repairing them requires significant investment. The proliferation of ADAS has made diagnostic scans and calibrations a routine part of the repair process. In Q1 2025, 86.9% of all repairable DRP appraisals included a diagnostic scan. More significantly, 32.2% included a calibration, a substantial increase from 23.9% in the same quarter of 2024. (Figure 7) Calibrations are not only costly but also add significant time to the repair cycle. CCC data also showed that a DRP repair involving more than one calibration took over 17 days in Q1 2025, on average, from vehicle-in to vehicle-out, compared to 13 days for a repair with no calibrations. DRP repairs with one calibration averaged 15.5 days. (Figure 8) This complexity demands major investments in tooling, with diagnostic equipment ranging from $5,000 to $20,000, plus ongoing maintenance costs.
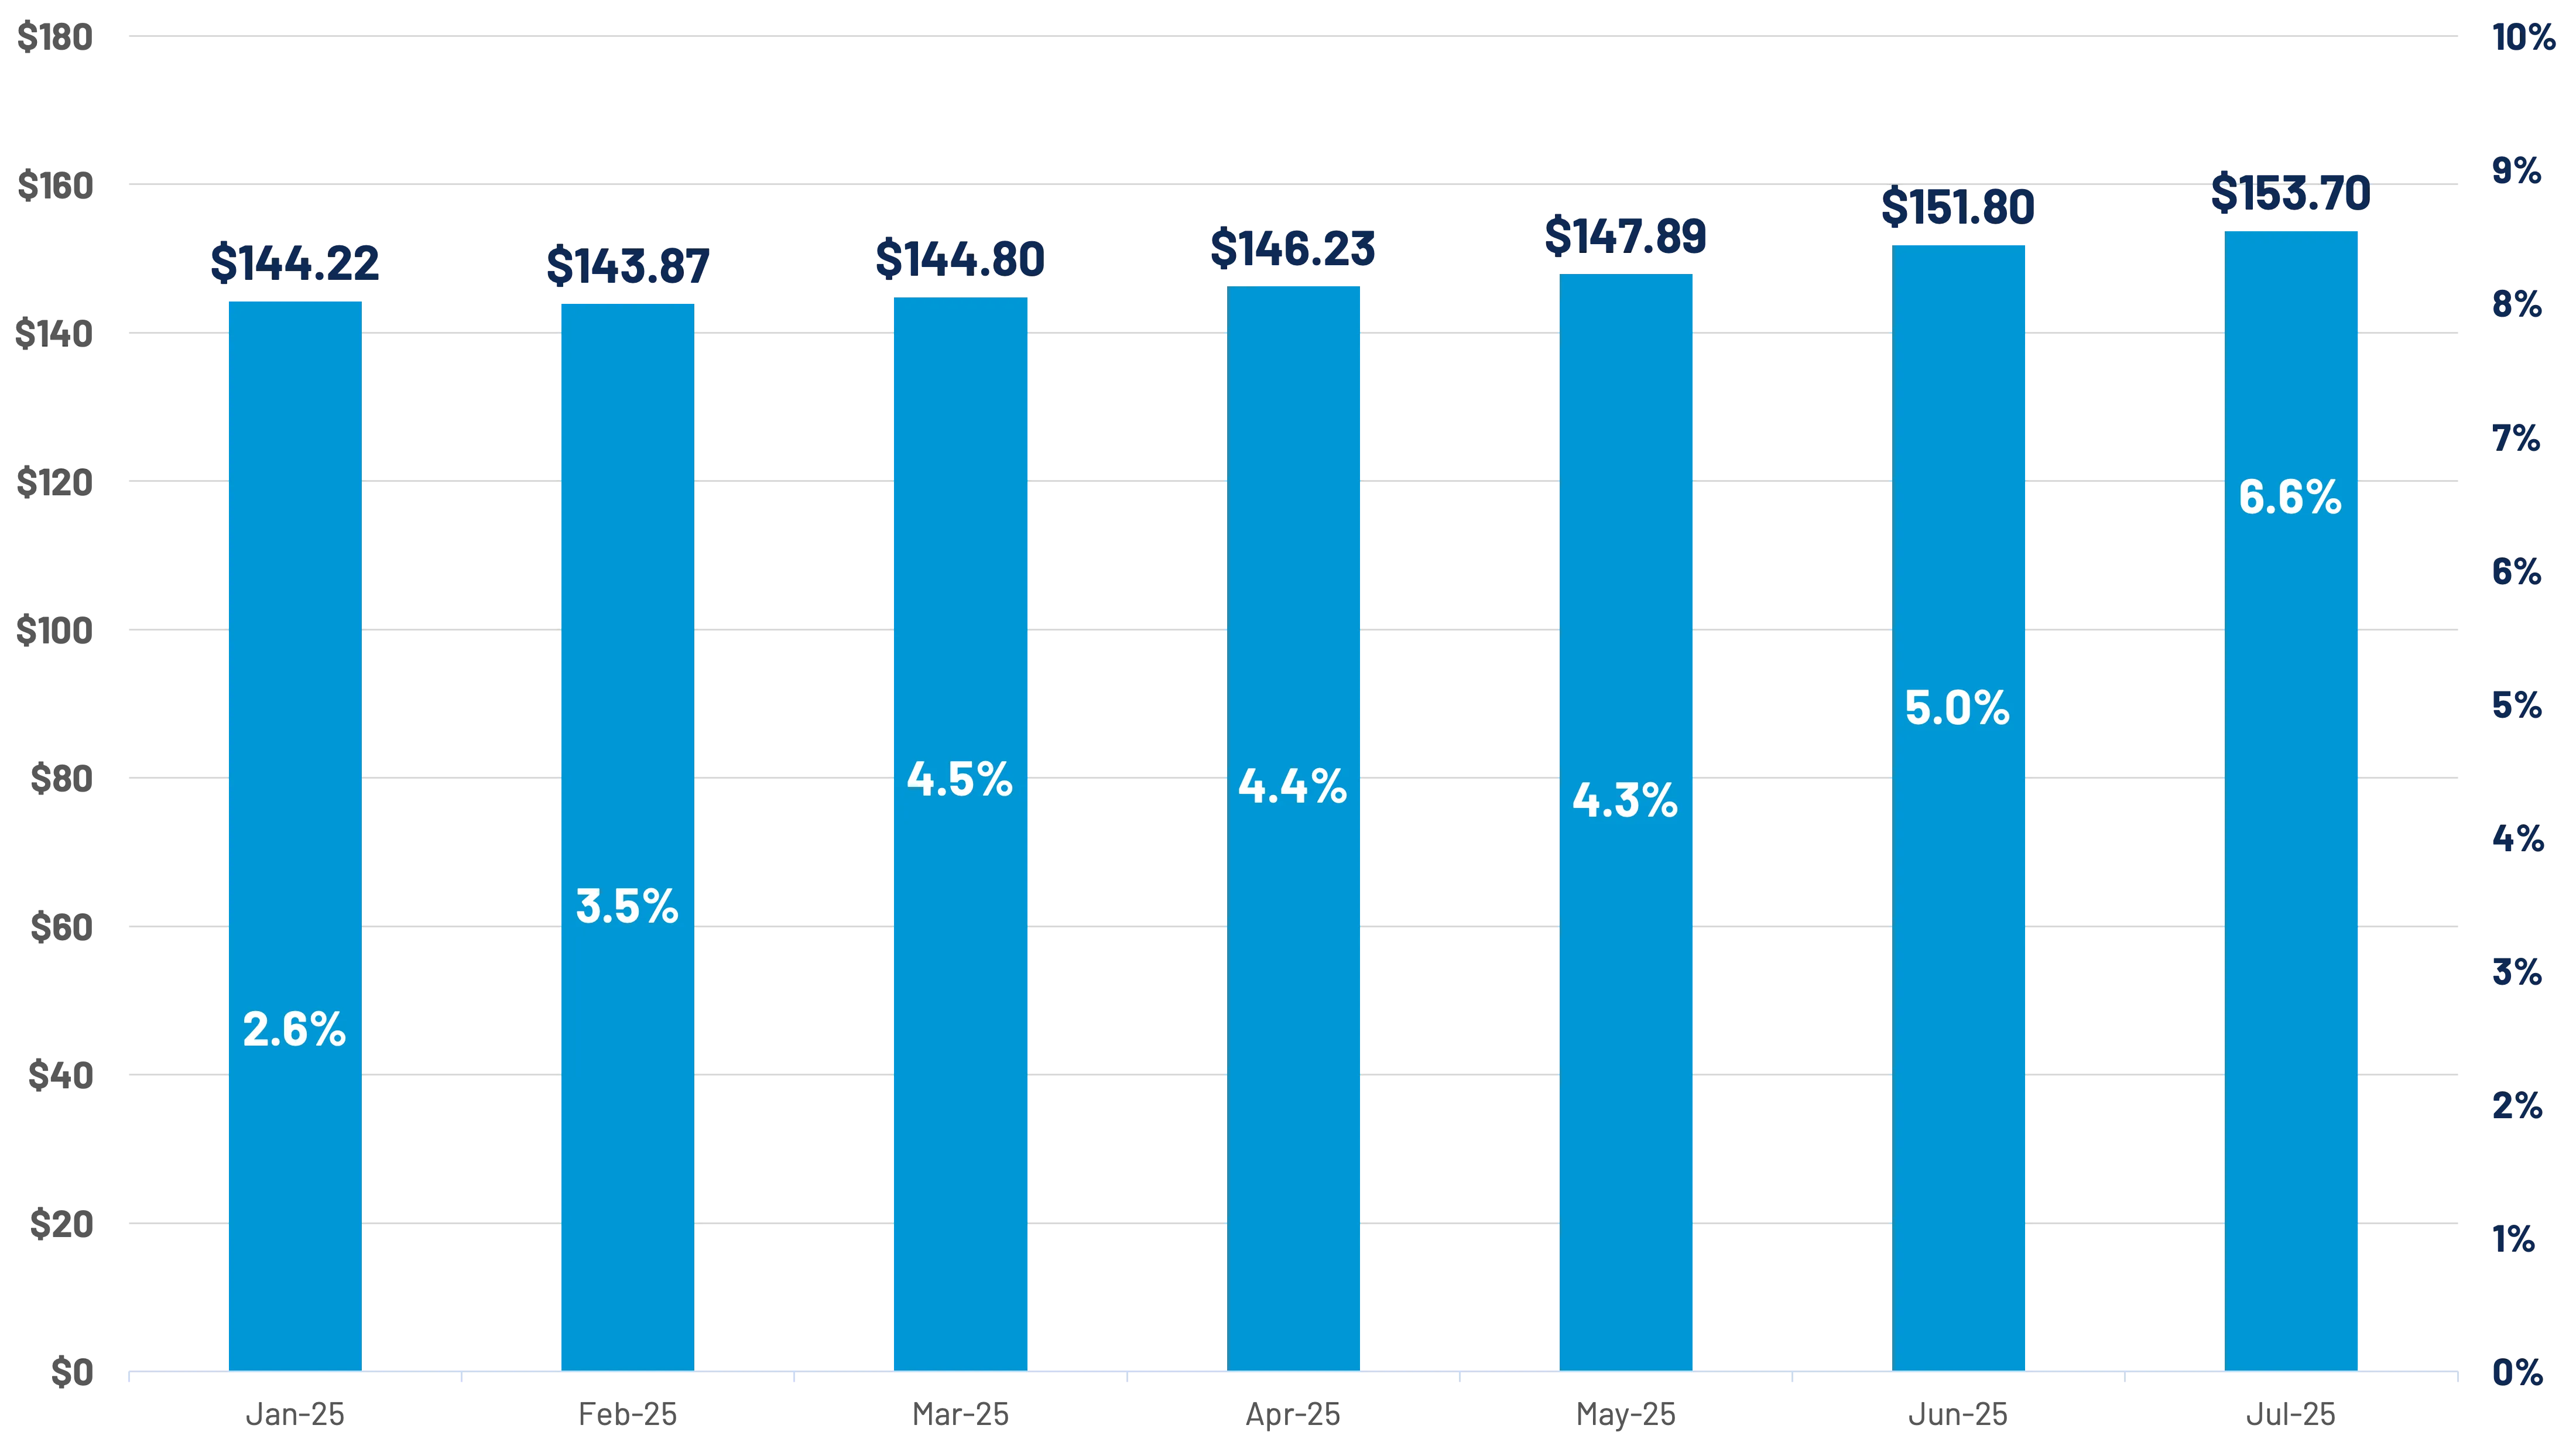
- Parts and Labor Pressures: The average price per part continues its upward march, with a year-over-year increase of 6.6% in June 2025. (Figure 9) This is exacerbated by a weaker U.S. dollar, which makes U.S. salvage vehicles more attractive to international buyers, shrinking the domestic pool of recycled parts and driving up their cost. Compounding these material cost issues is a persistent labor crisis. According to TechForce Foundation's 2024 Supply & Demand Report, new entrant demand for collision repair technicians will reach 75,000 by 2028, with only 30,000 collision repair program graduates lined up to fill the gap.


For repairers, the confluence of these factors – absorbing external costs from tariffs, making heavy capital investments in technology, and struggling to find skilled labor – creates a challenging business environment.

Reinventing the Future with Technology and Transparency
This isn't just another industry rough patch. It's a redesign moment.
The pre-pandemic automotive ecosystem was built on global stability, predictable supply chains, and a relatively linear cost structure, but today, those foundations are fractured. Tariffs have redrawn sourcing maps. Inflation is now embedded into parts, labor, and raw material costs. And rising vehicle complexity has permanently raised the stakes for everyone across the value chain.
In this new environment, volatility is persistent, margins are thinner, and adaptability is the only way forward. The industry won't return to "normal" because "normal" was optimized for a world that no longer exists.
Across the auto industry value chain, reinvention is underway:
- Automakers are reevaluating production strategies, redesigning vehicle platforms to meet domestic content requirements, and shifting product roadmaps from EVs to hybrids in response to evolving consumer demand and policy uncertainty. At the same time, they’re investing in AI, digitizing supply chain management, and expanding collaboration with insurers and repairers through greater data sharing – from vehicle build sheets to calibration requirements – making downstream workflows more efficient and safer.
- Auto carriers are modernizing their claims ecosystems to contend with shifting claim volumes, rising repair and total loss severity, and increasing policyholder price sensitivity. Many are leaning into AI-powered tools and support, predictive analytics, and automated workflows to improve speed, consistency, and transparency across the policy and claims lifecycle.
- Collision repairers are navigating rising costs, labor shortages, and unprecedented vehicle complexity. Investments in diagnostics, calibrations, and workforce training are no longer optional – they're essential for profitability and DRP performance. Shops are adapting through intelligent scheduling, investing in guided repair planning, and leaning on trusted partners to deliver a seamless experience to customers.
What comes next isn't restoration – it's reinvention. The opportunity lies in connecting the ecosystem more deeply than ever before.
Adopting AI and data sharing as the foundation of a new operating model means shifting from fragmented, manual workflows to orchestrated, intelligent ecosystems. Success depends on breaking down silos, embedding intelligence into every touchpoint, and designing processes that flex with volatility rather than fight it.
Equally important is the need for transparency. At a time when consumers are feeling financial pressure, being open about why costs are rising builds trust. Whether it’s insurers explaining premium increases, automakers clarifying repair complexity, or shops outlining parts and labor realities, each stakeholder has an opportunity to instill confidence by making the claims and repair journey more understandable and human.
In a world where no two claims journeys – or vehicles – are alike, resilience will come not from any one player, but from the way the automotive ecosystem works together.


APD Industry Data
Paid Claim Trends
Paid claim frequency for collision and comprehensive (both first party coverages) continue to trend down slowly. Underlying drivers of frequency – paid count and exposure units – both continue to decline despite the overall growth within the car parc. Liability (property damage) paid frequency remains stable.
Through June 2025, miles driven was +1.6% relative to 2019 and +0.8% versus prior year. Don’t let these seemingly small numbers fool you. In 2024, the U.S. averaged over 273 billion miles driven per month. A 0.8% increase year-over-year is over 12 billion additional miles driven. (Figure 1)

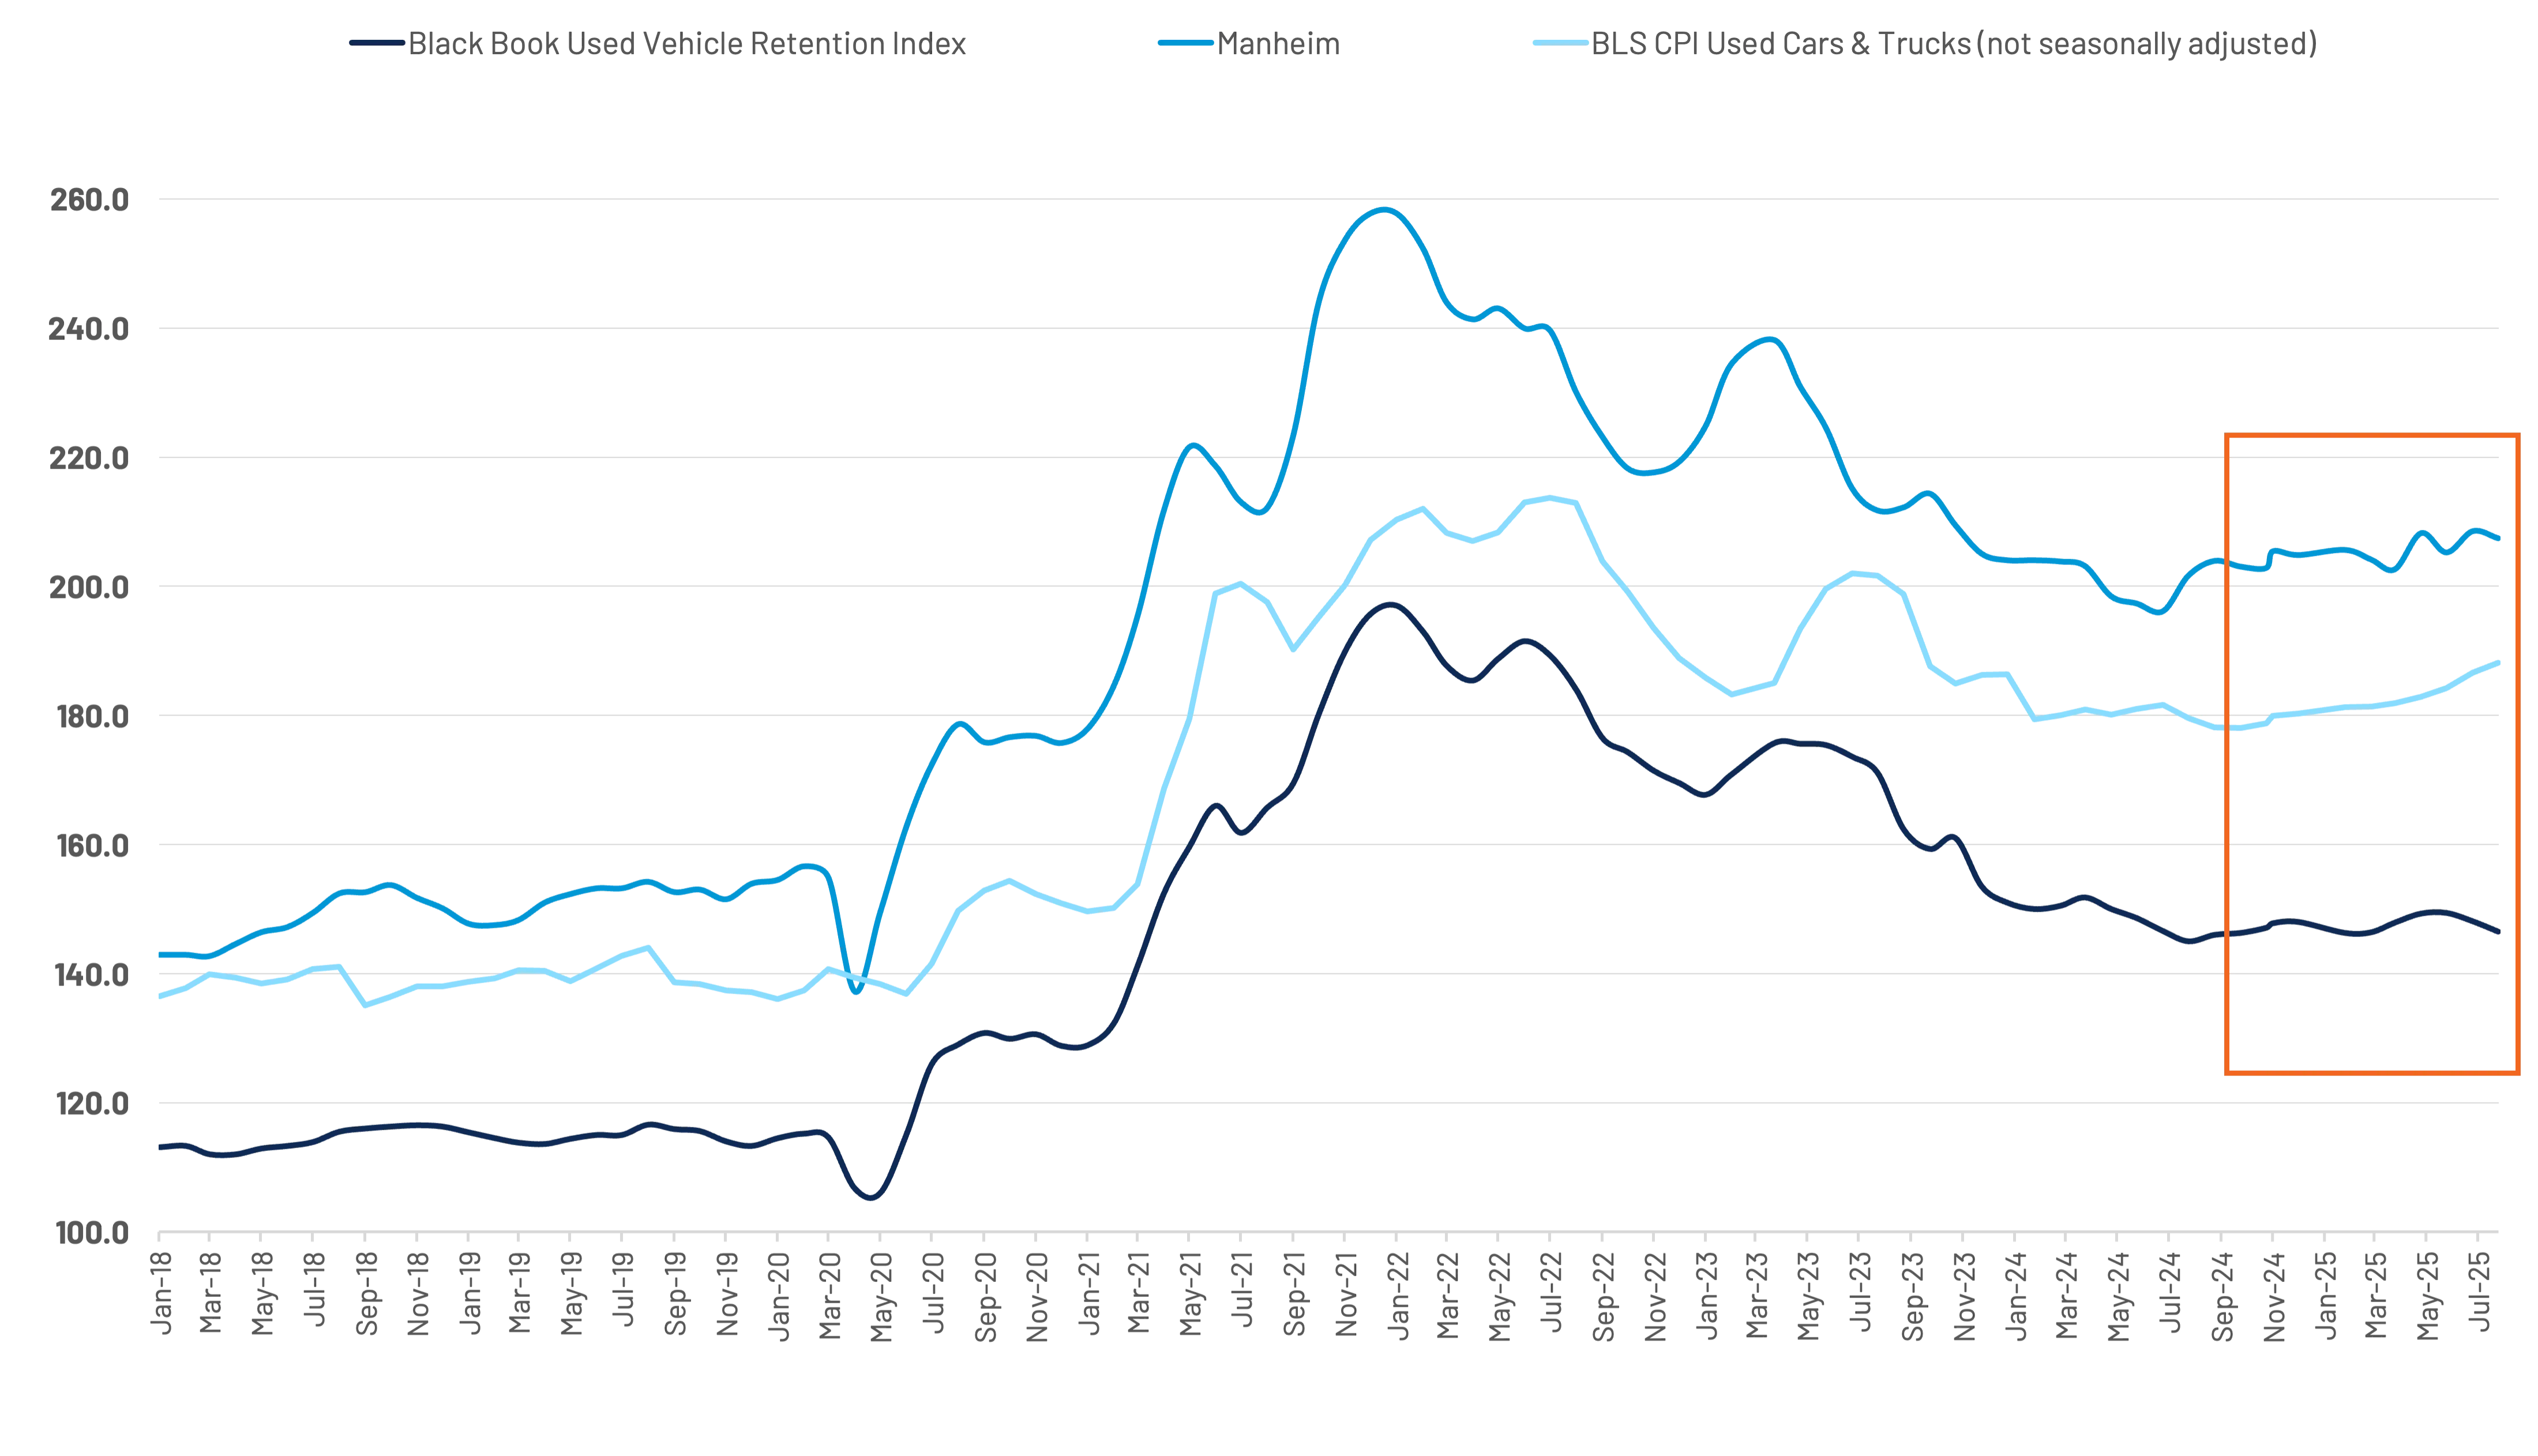
Wholesale used vehicle values continue to increase in 2025 for wholesale used vehicles. Retail prices, reflected in the BLS CPI for used vehicles are also trending higher after hitting a low point at the end of Q3 2024. Supply and demand dynamics, including price and interest rates continue to be areas of focus. (Figure 2)
Total losses continue to represent a larger share of claims. Contributing factors, such as declining vehicle values, aging car parc, and a declining share of lower dollar claims being reported, continue to shift the claims mix. (Figure 3)
The share of claims flagged total loss was a record in 2024 – based on CCC's historical trends. Total losses continue to trend higher in 2025, despite gradual increases in used vehicle values. Factors, such as a decline in lower-dollar claim filings and vehicle age mix, continue to exacerbate total loss volumes.
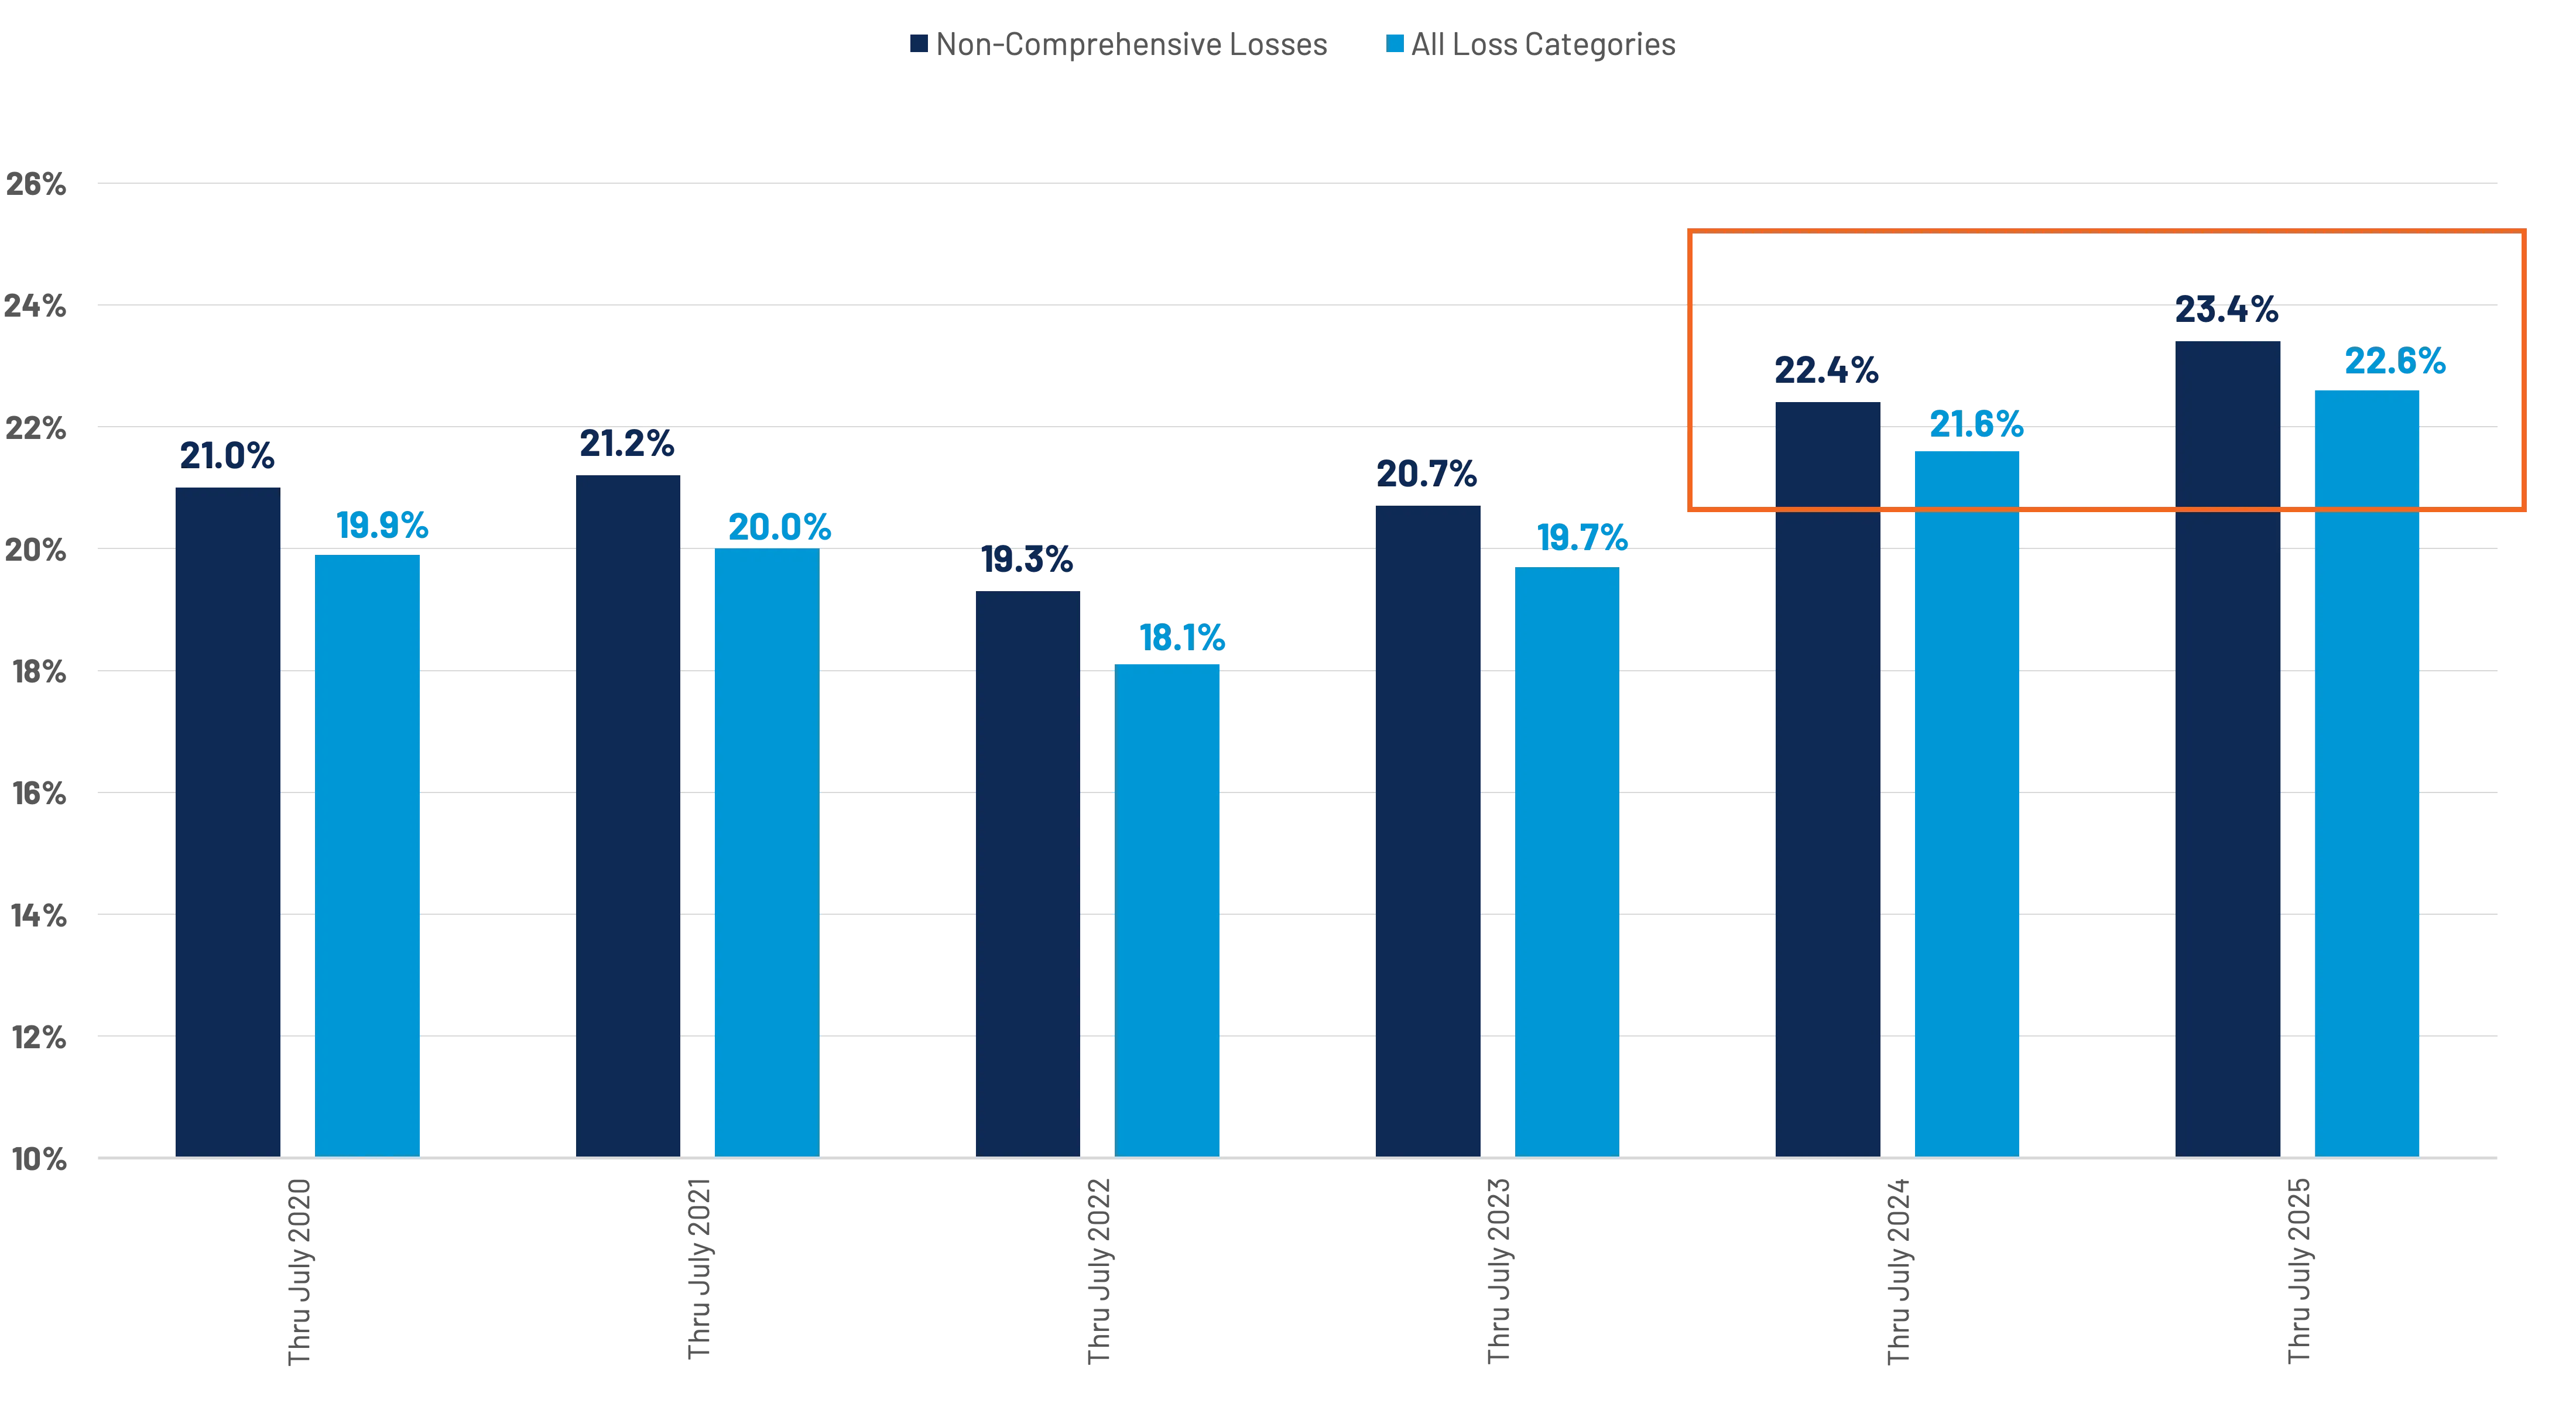
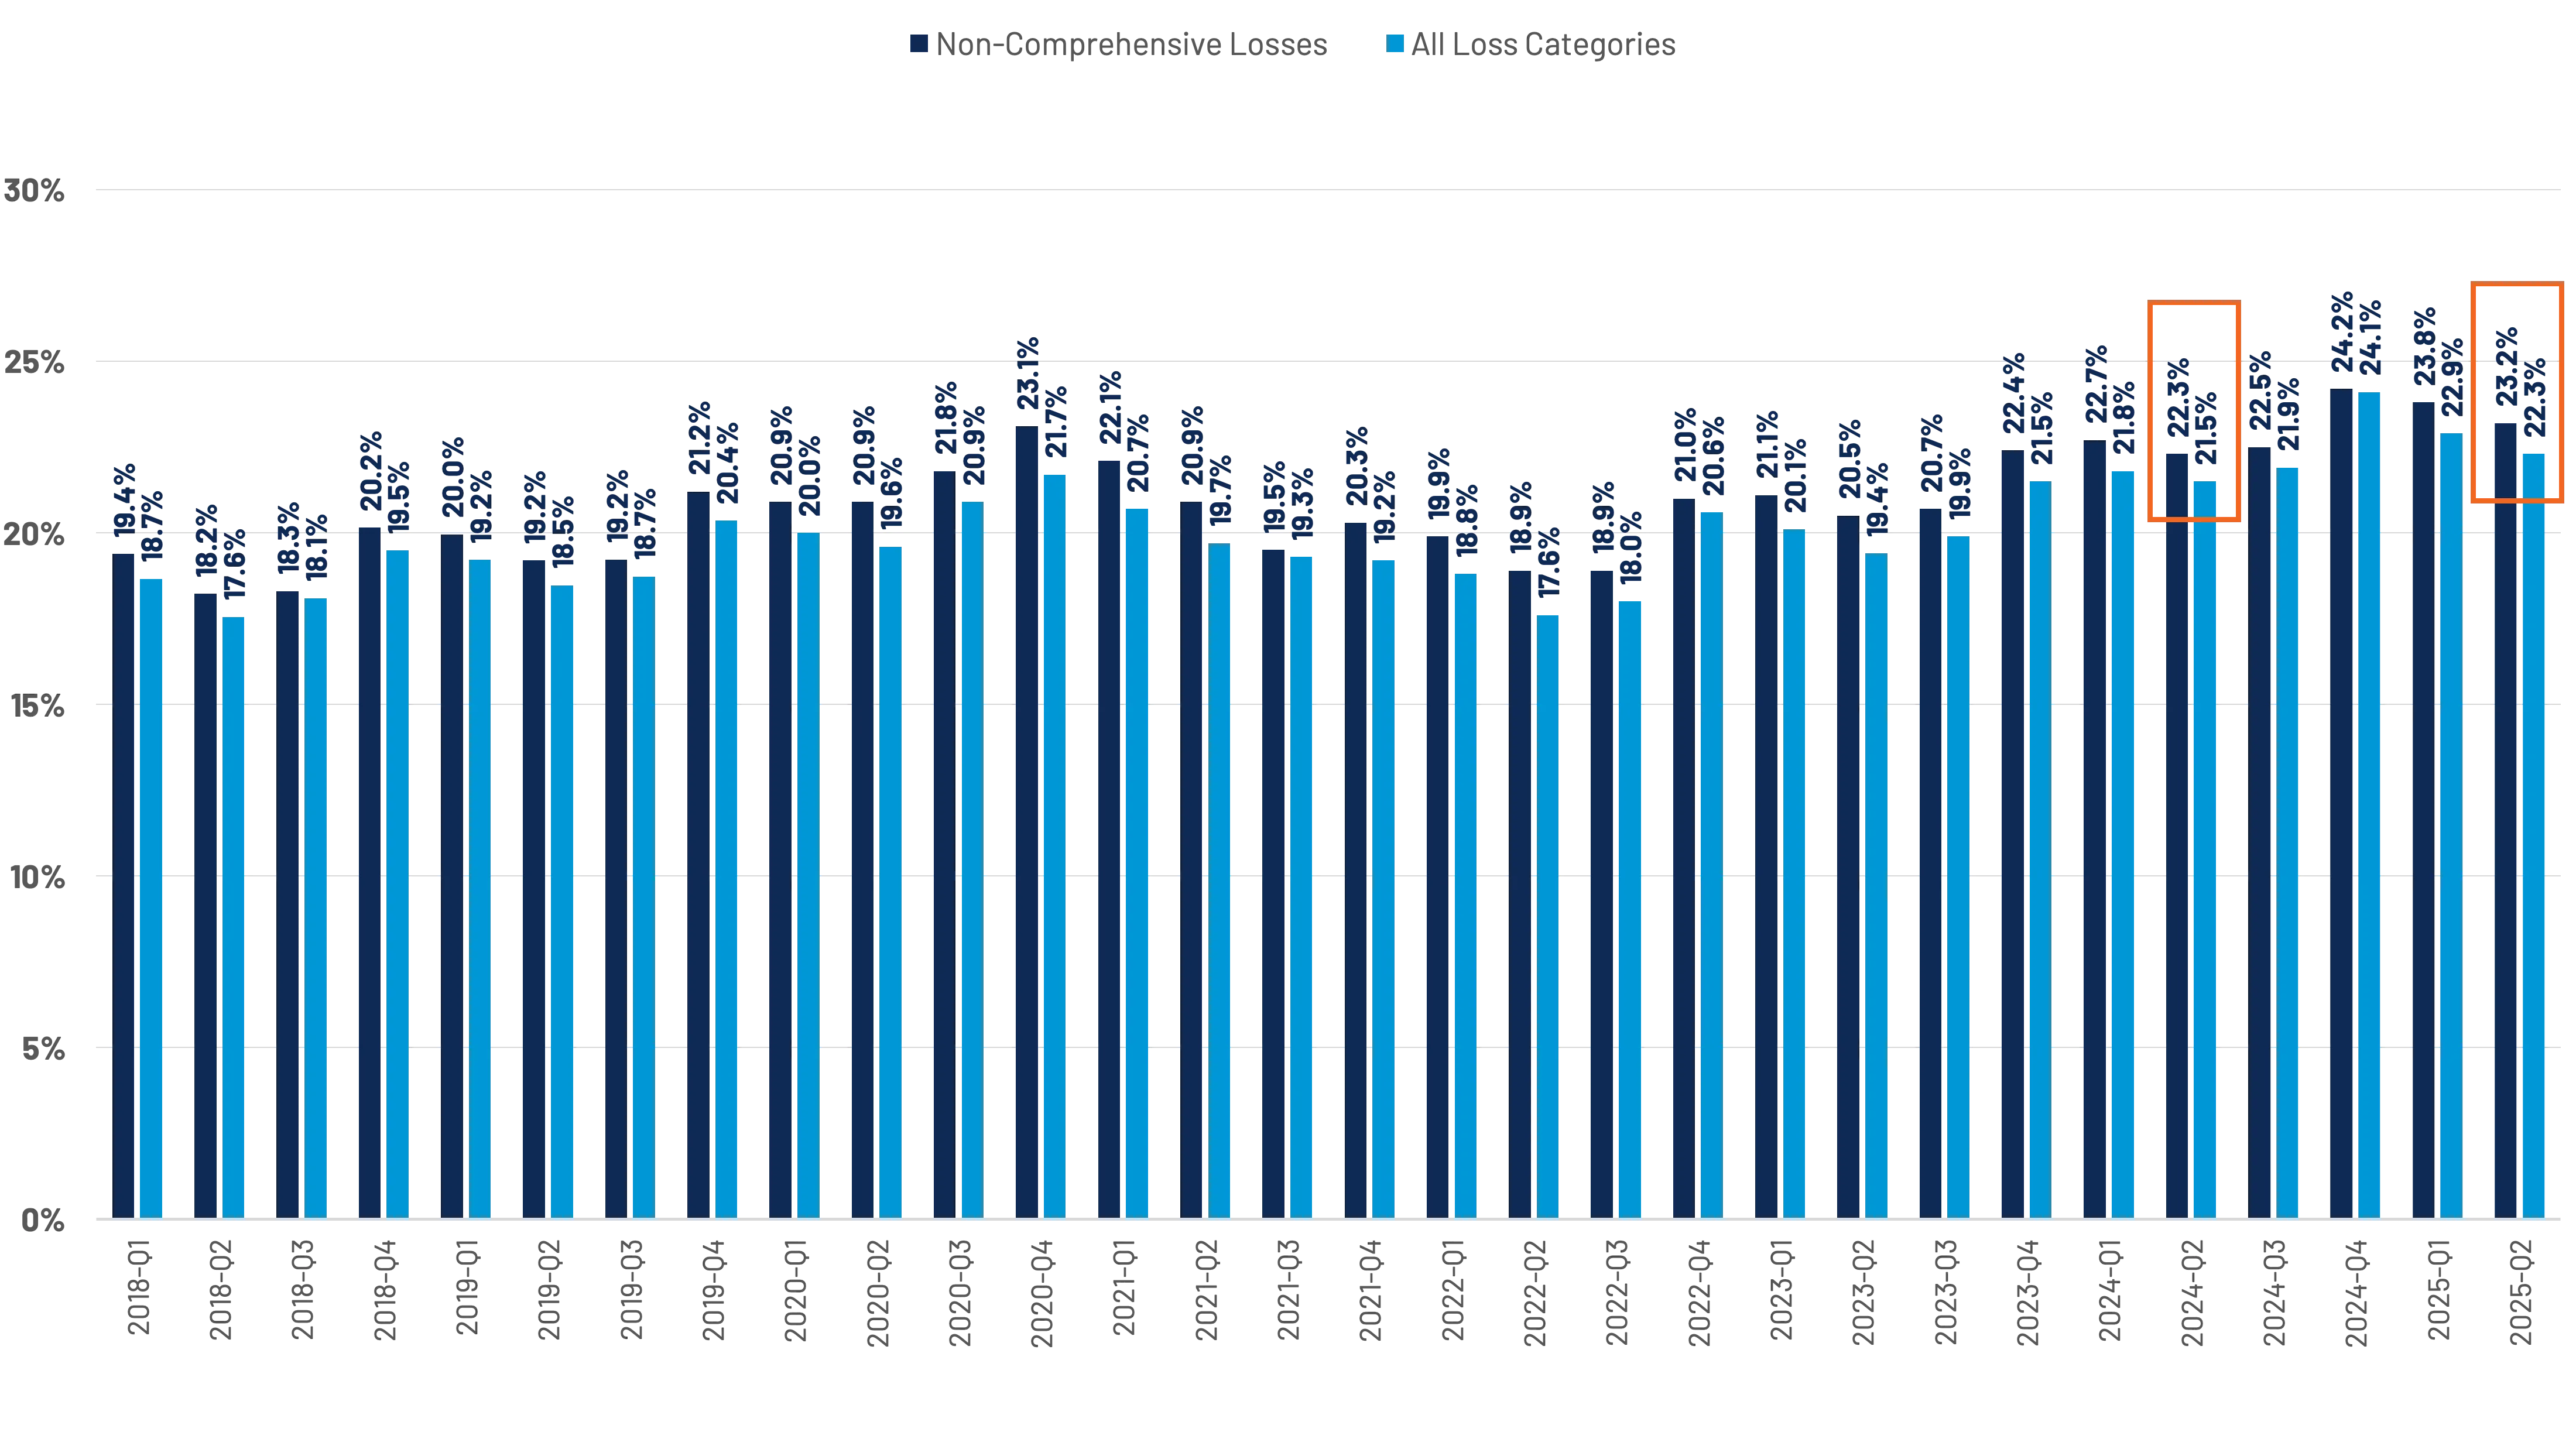
Second quarter results indicate a 0.8-point increase in the share of total losses year-over-year, while the overall share has increased by one full percentage point. (Figures 4 and 5)
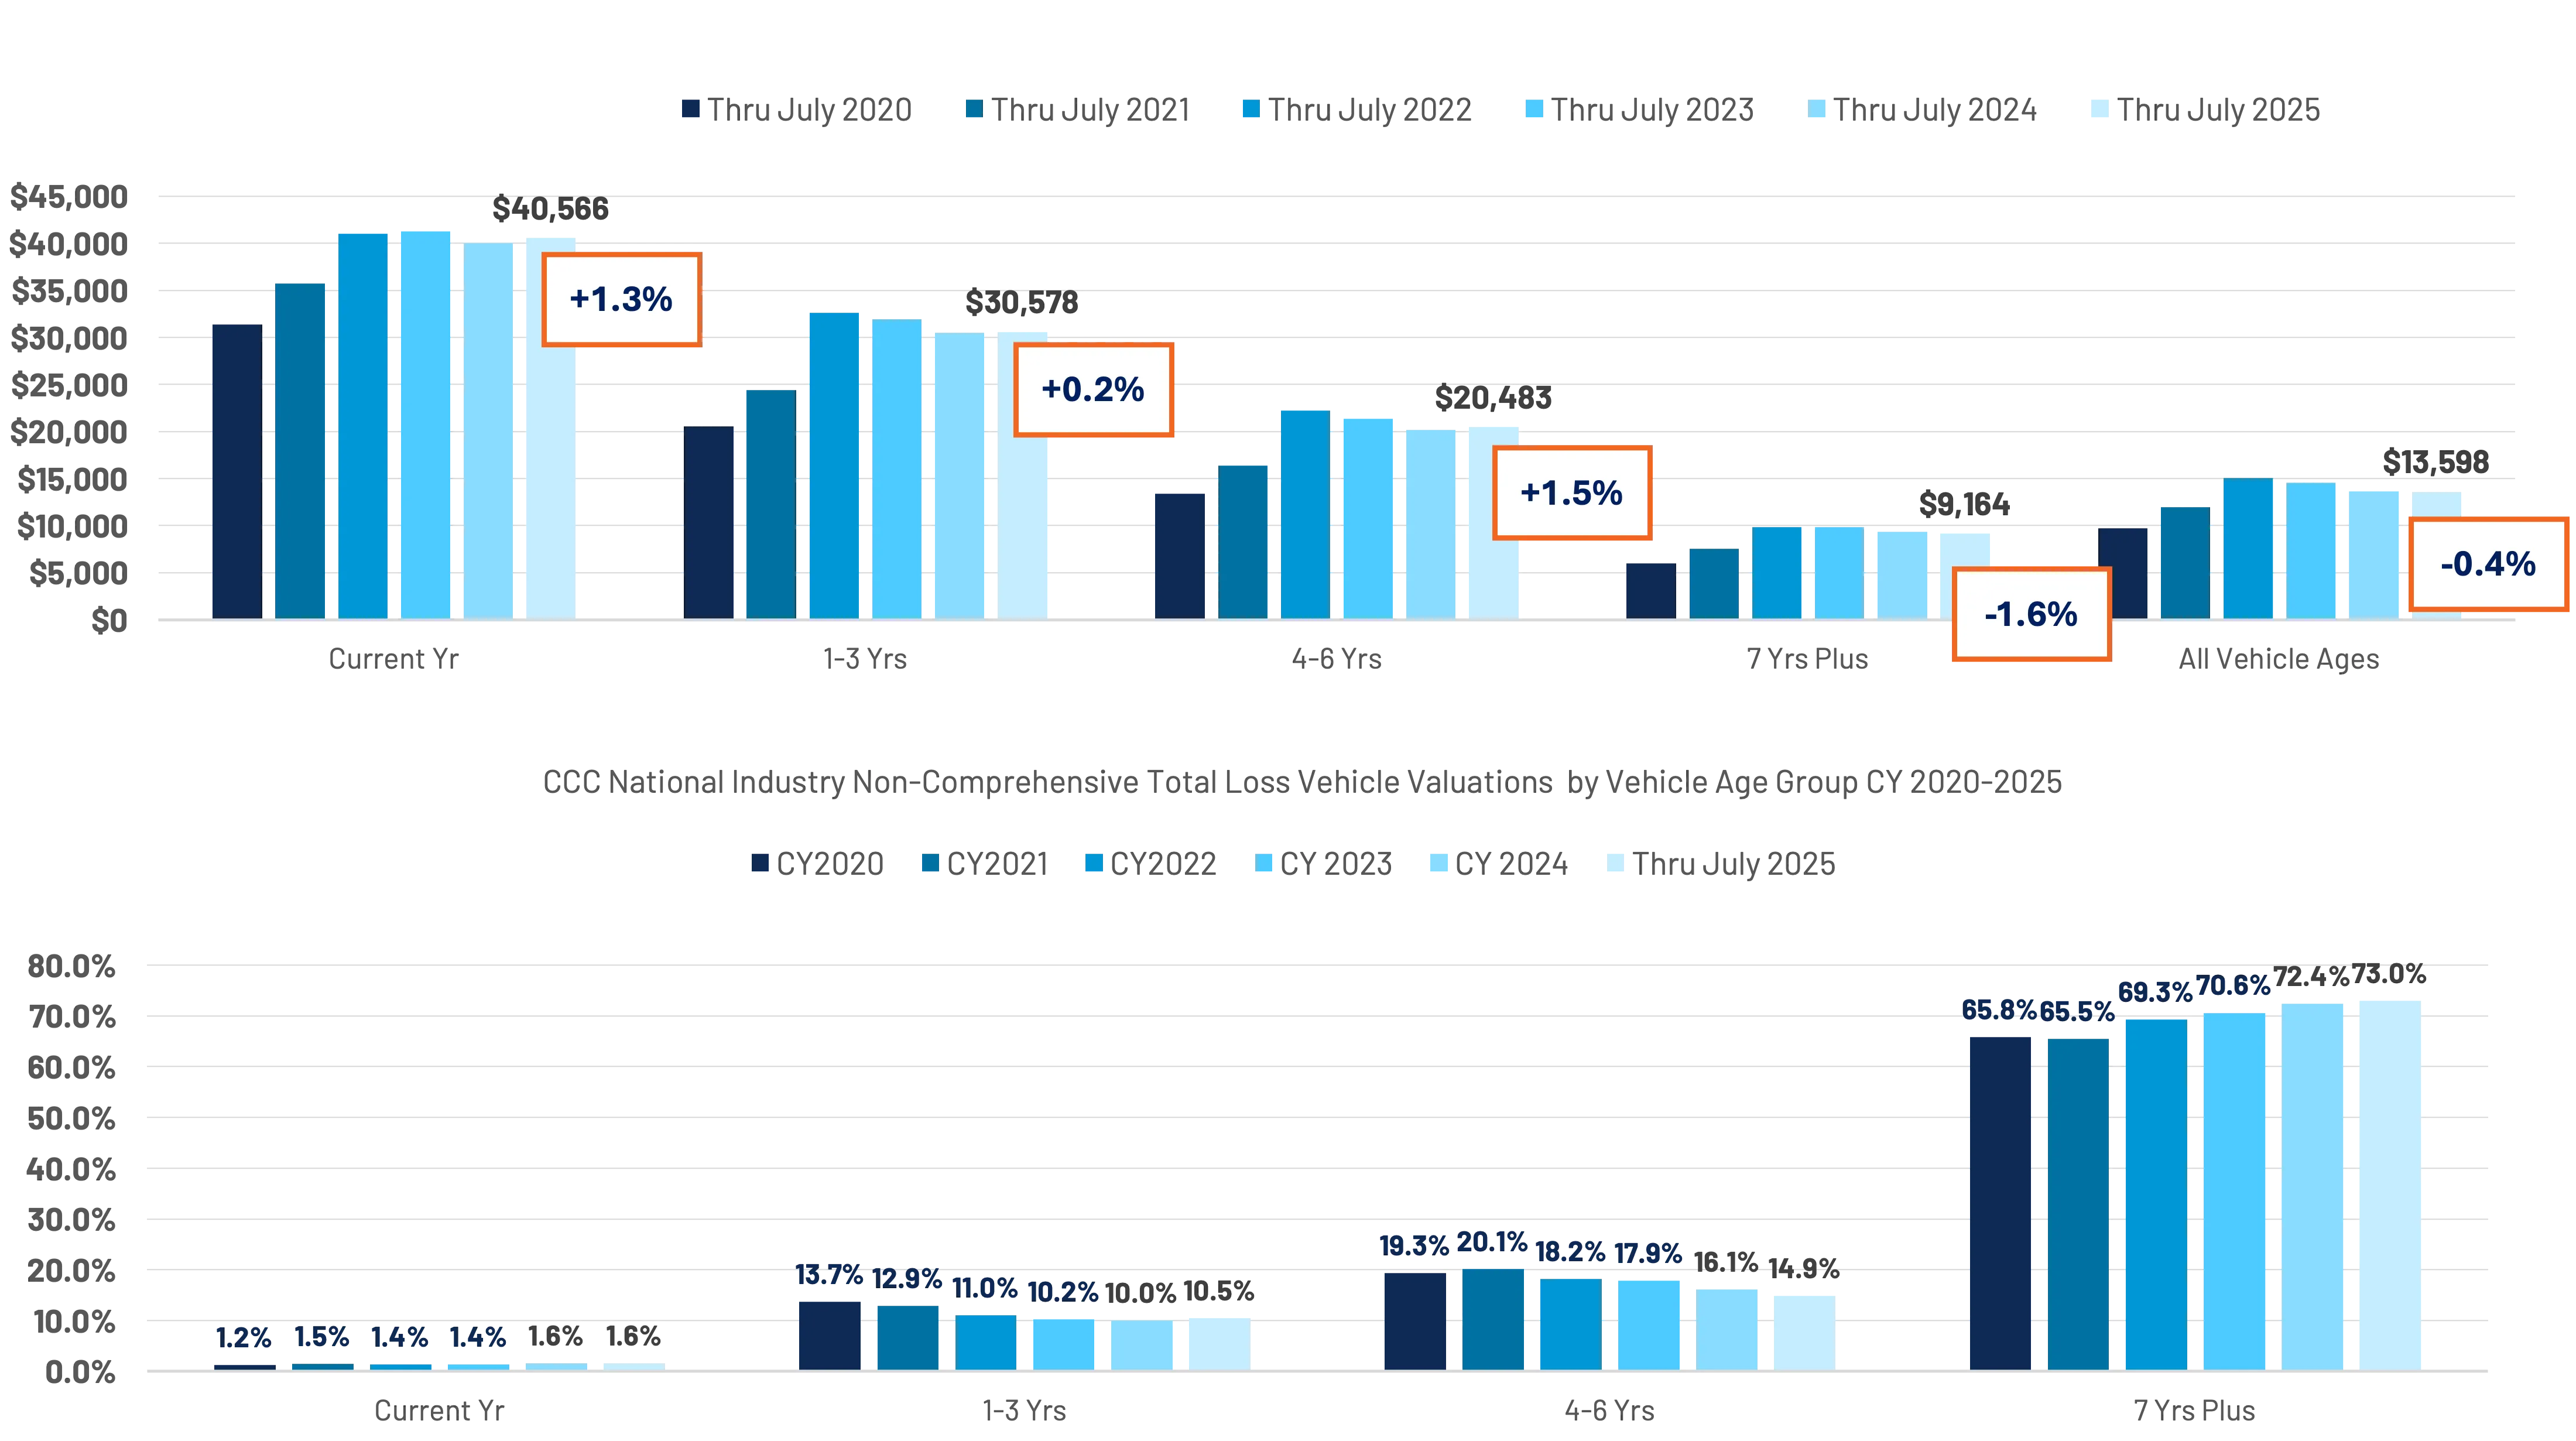
The age mix of non-comprehensive valuations is highly representative of the vehicle age mix within the U.S. car parc. Older vehicles continue to represent a large share of the vehicle pool, while we see less representation from newer vehicles, a reflection of decreased new vehicle sales since 2020. S&P Global reported that the average age of U.S. light vehicles has increased to 12.8 years – 14.5 years for passenger cars and 11.9 years for light trucks.
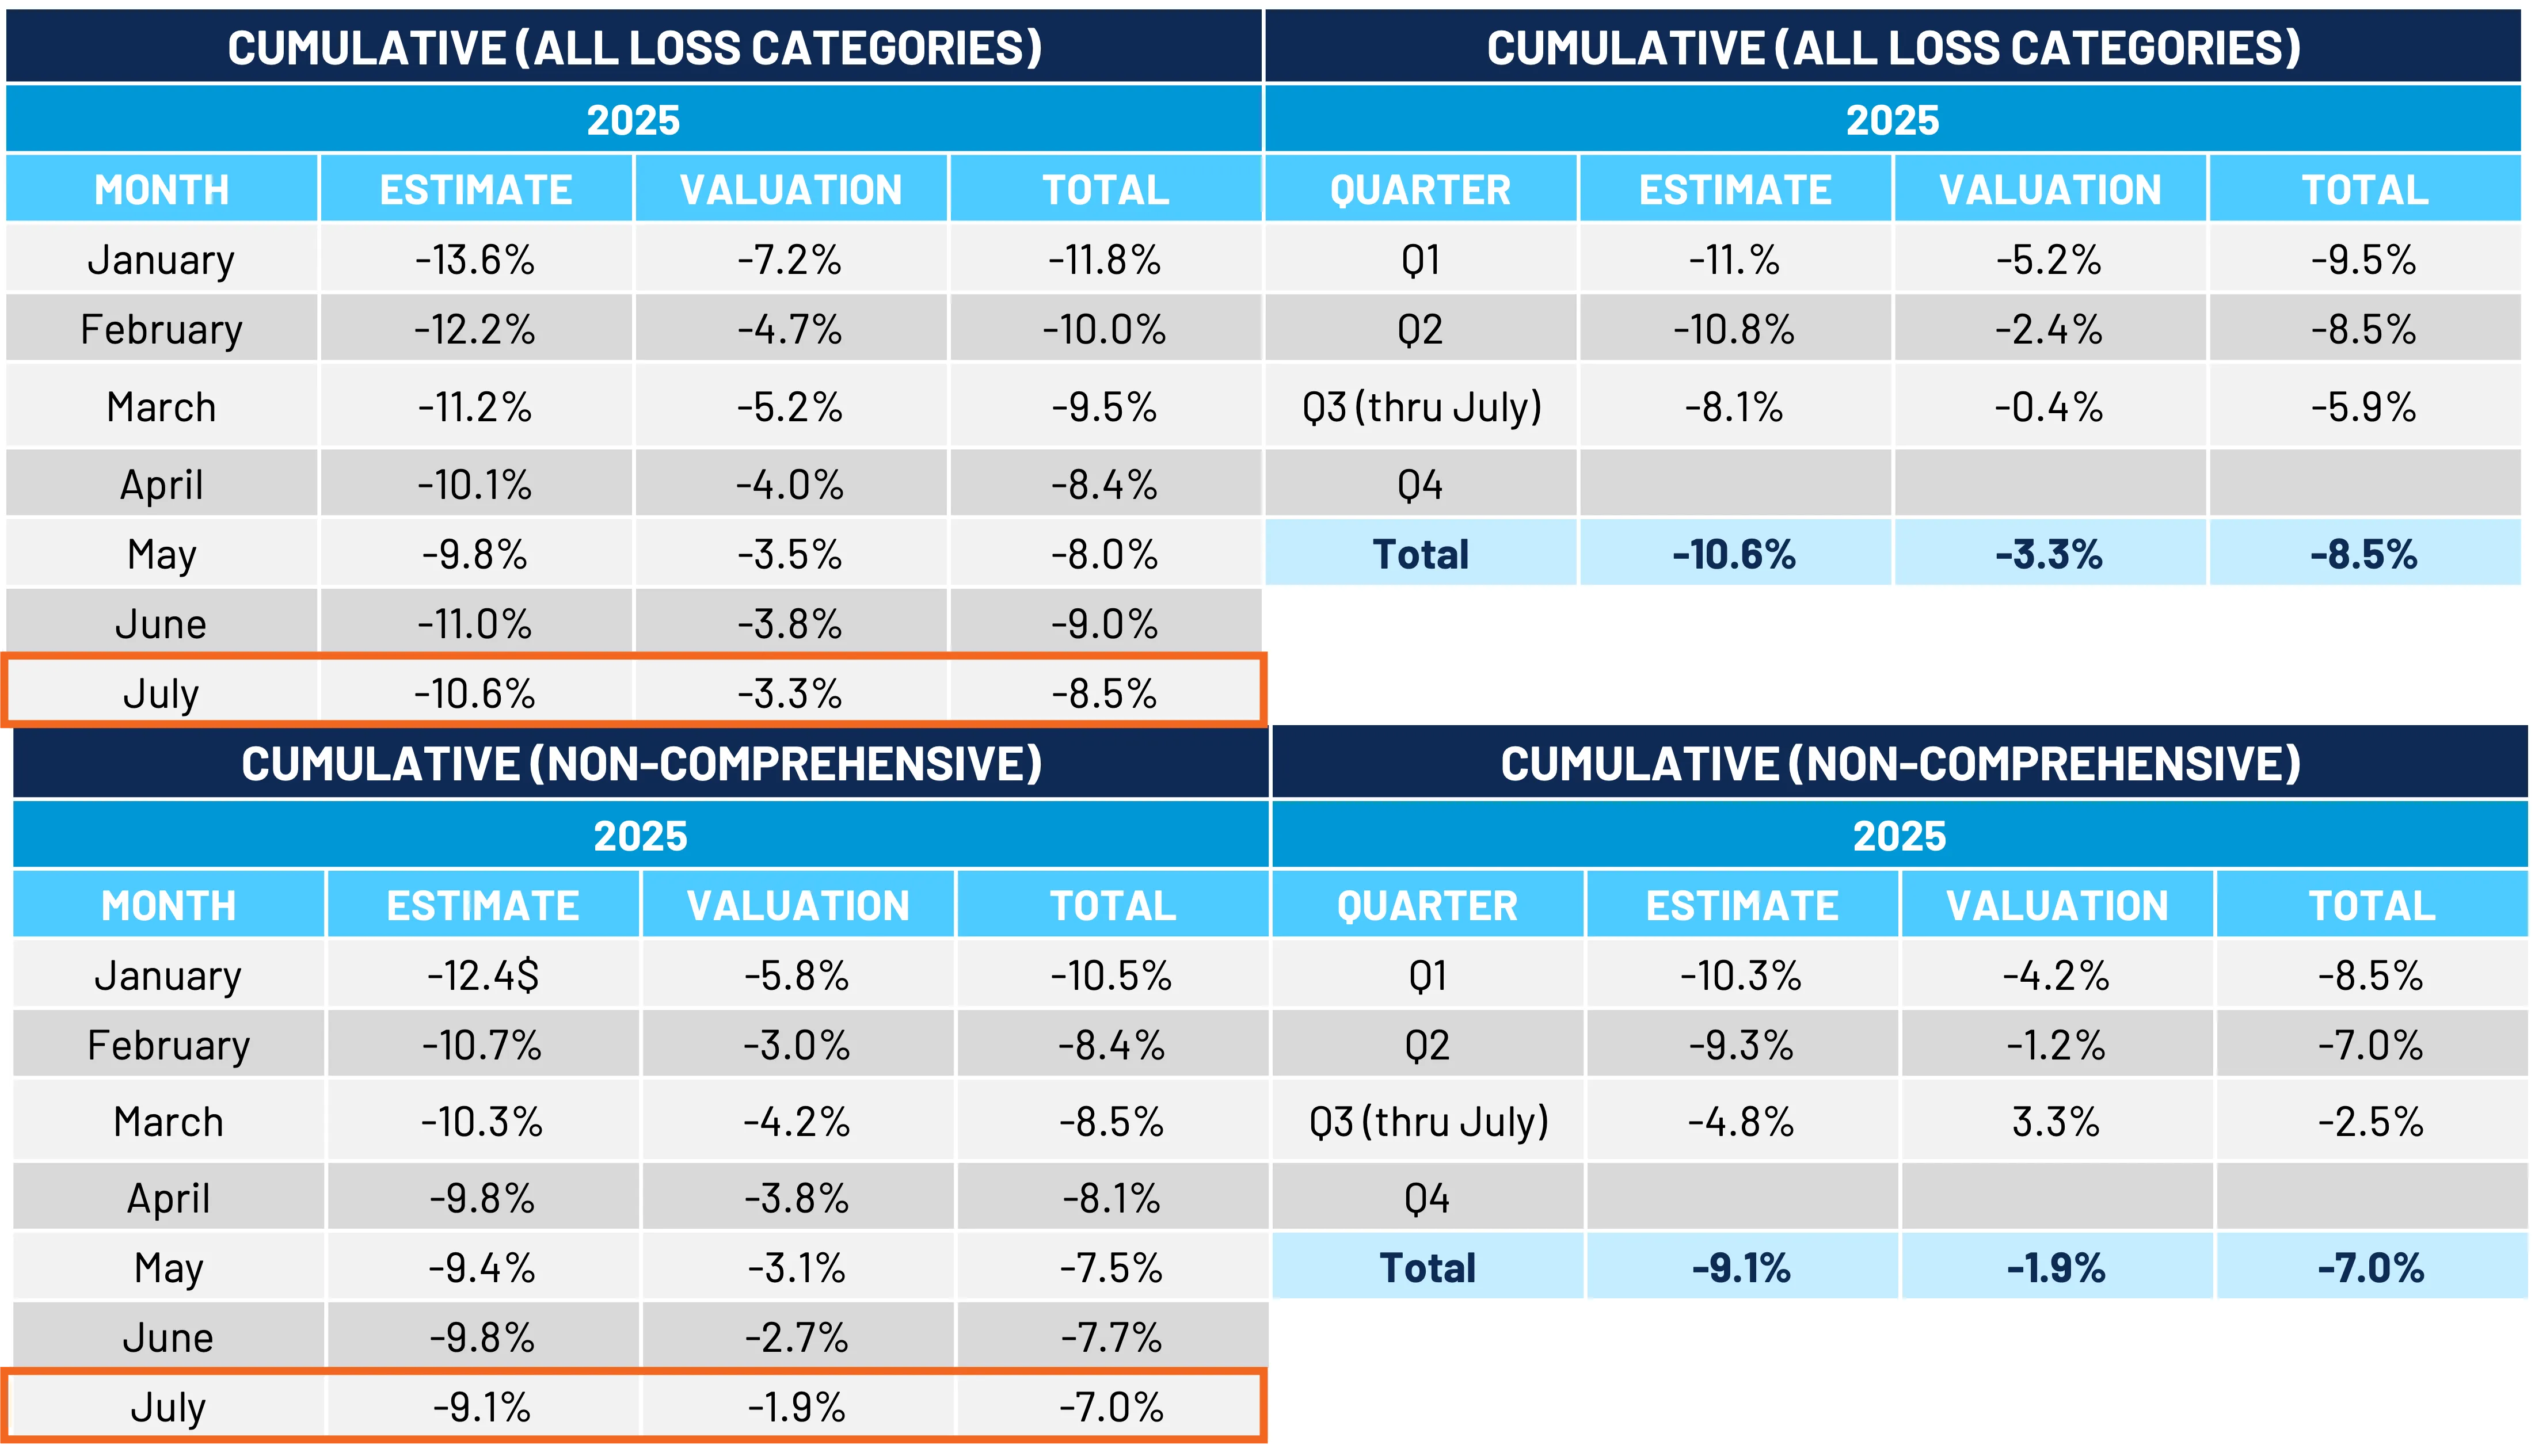
Average adjusted vehicle values (AAVV) on non-comprehensive valuations were –0.4% year-over-year through July. AAVV was -6.2% through July in 2024. While the trend remains negative overall, vehicles 6 years or newer are now trending positive year-over-year in AAVV. AAVV is biased due to the large share of vehicles 7 years or older (73%), which remain down -1.6% YoY. AAVVs are +40% relative to 2020 (through July). (Figure 6)
Per NICB, over one million vehicles were stolen in 2022 and 2023. In 2024, thefts declined 16.7% year-over-year to 850,708. Following a slight reprieve, the latter part of 2024 began to see an increased share of total losses because of theft. In their most recent report, NICB reported that vehicle thefts in the first half of 2025 were down 23% (334,114 vs. 435,754), sustaining the national trend of decreased thefts going back to early 2024.
Despite the decline, the market still seems ripe for morale hazard and fraud given the state of auto finance – where almost 3% of auto loans slipped into serious delinquency and over 26% of new vehicle loans are under water by an average amount of almost $7,000 (Q2 2025). (Figure 7)
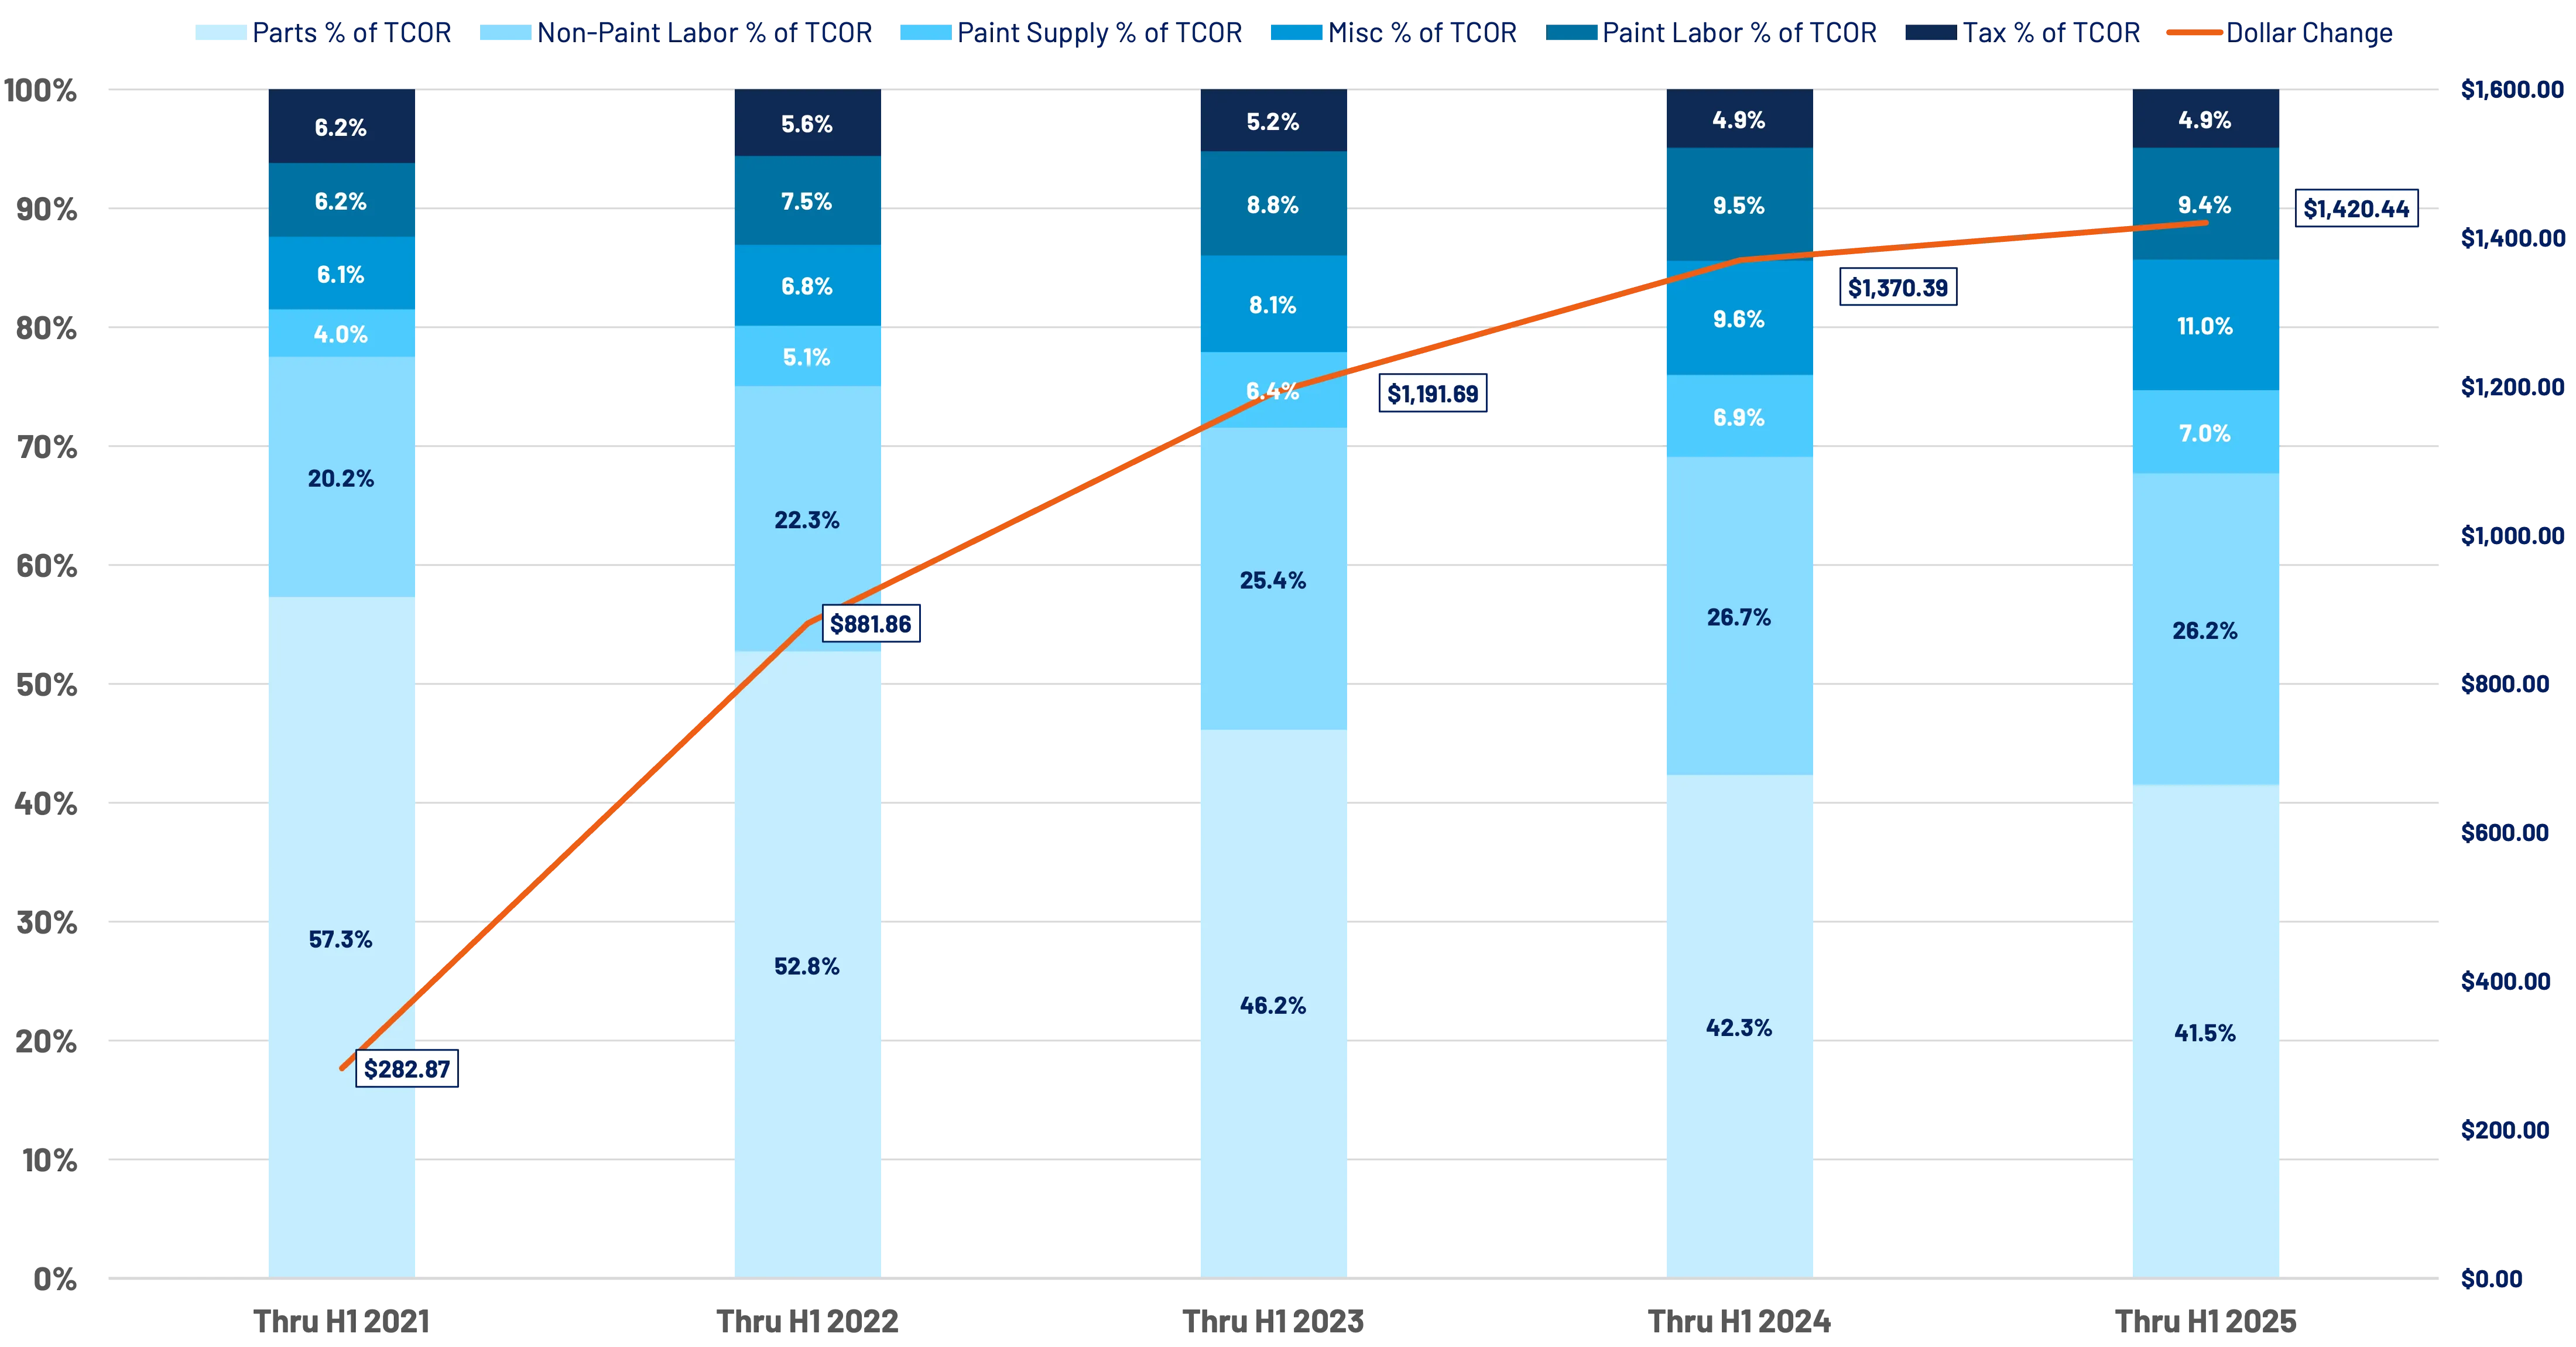
Total Cost of Repair Trends
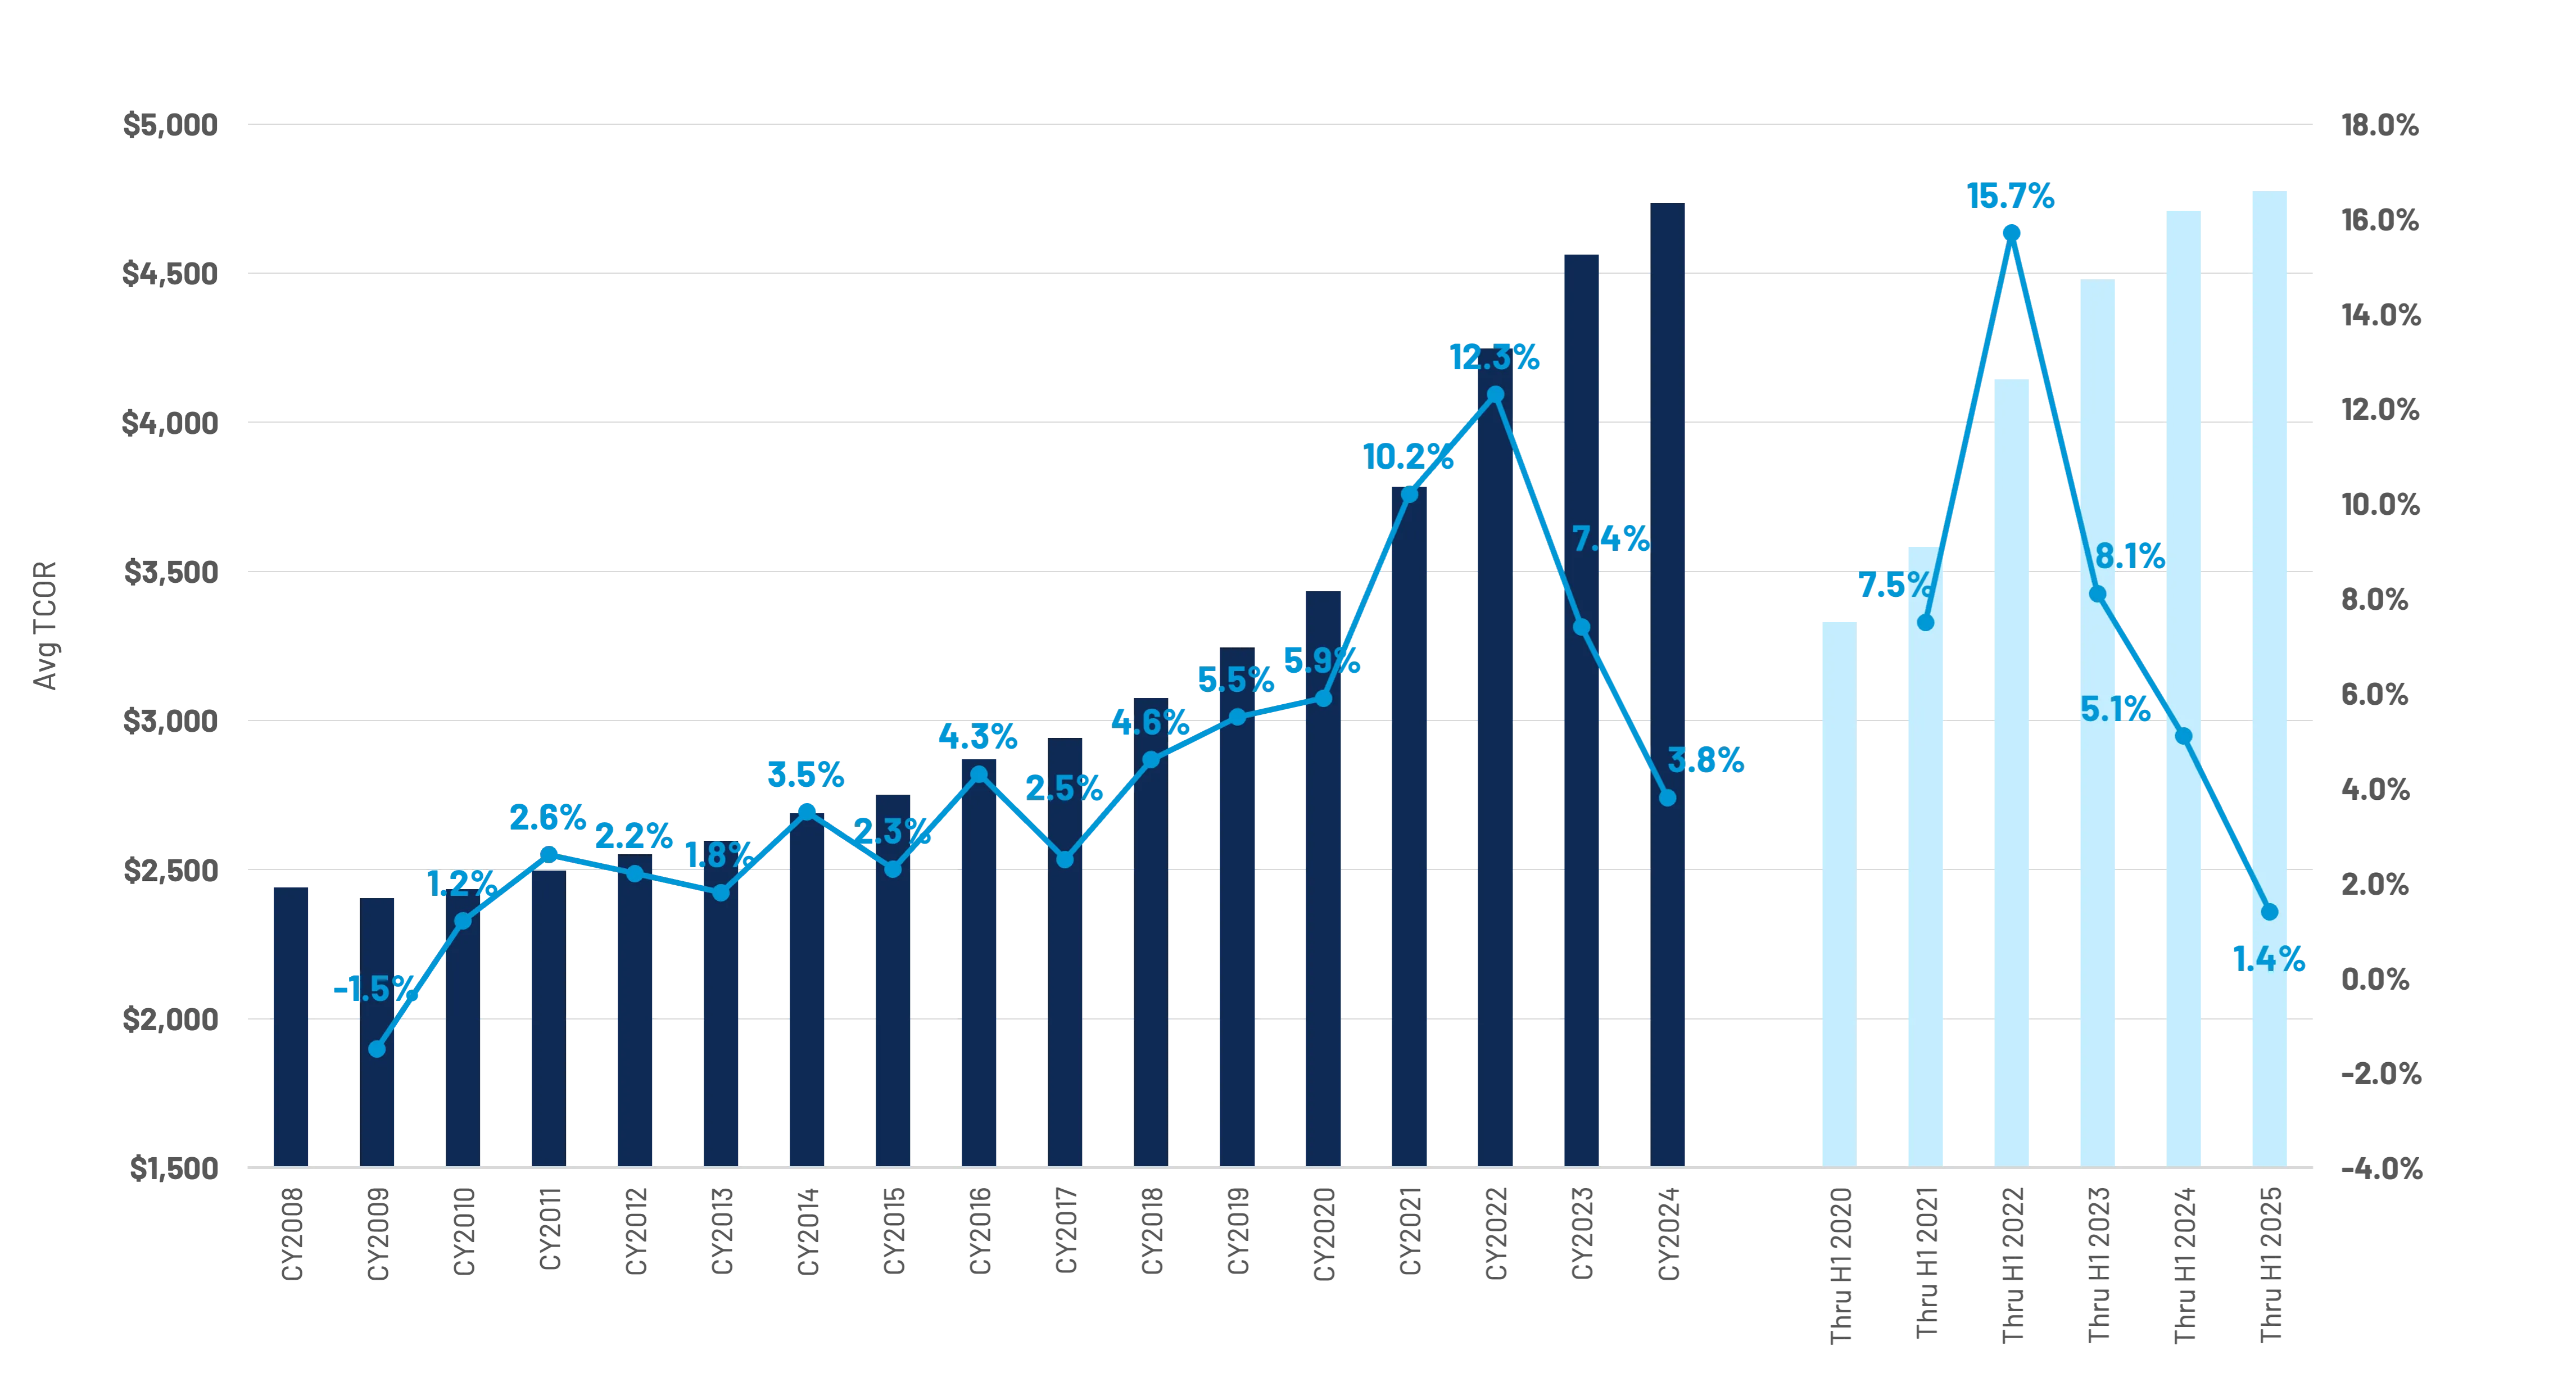
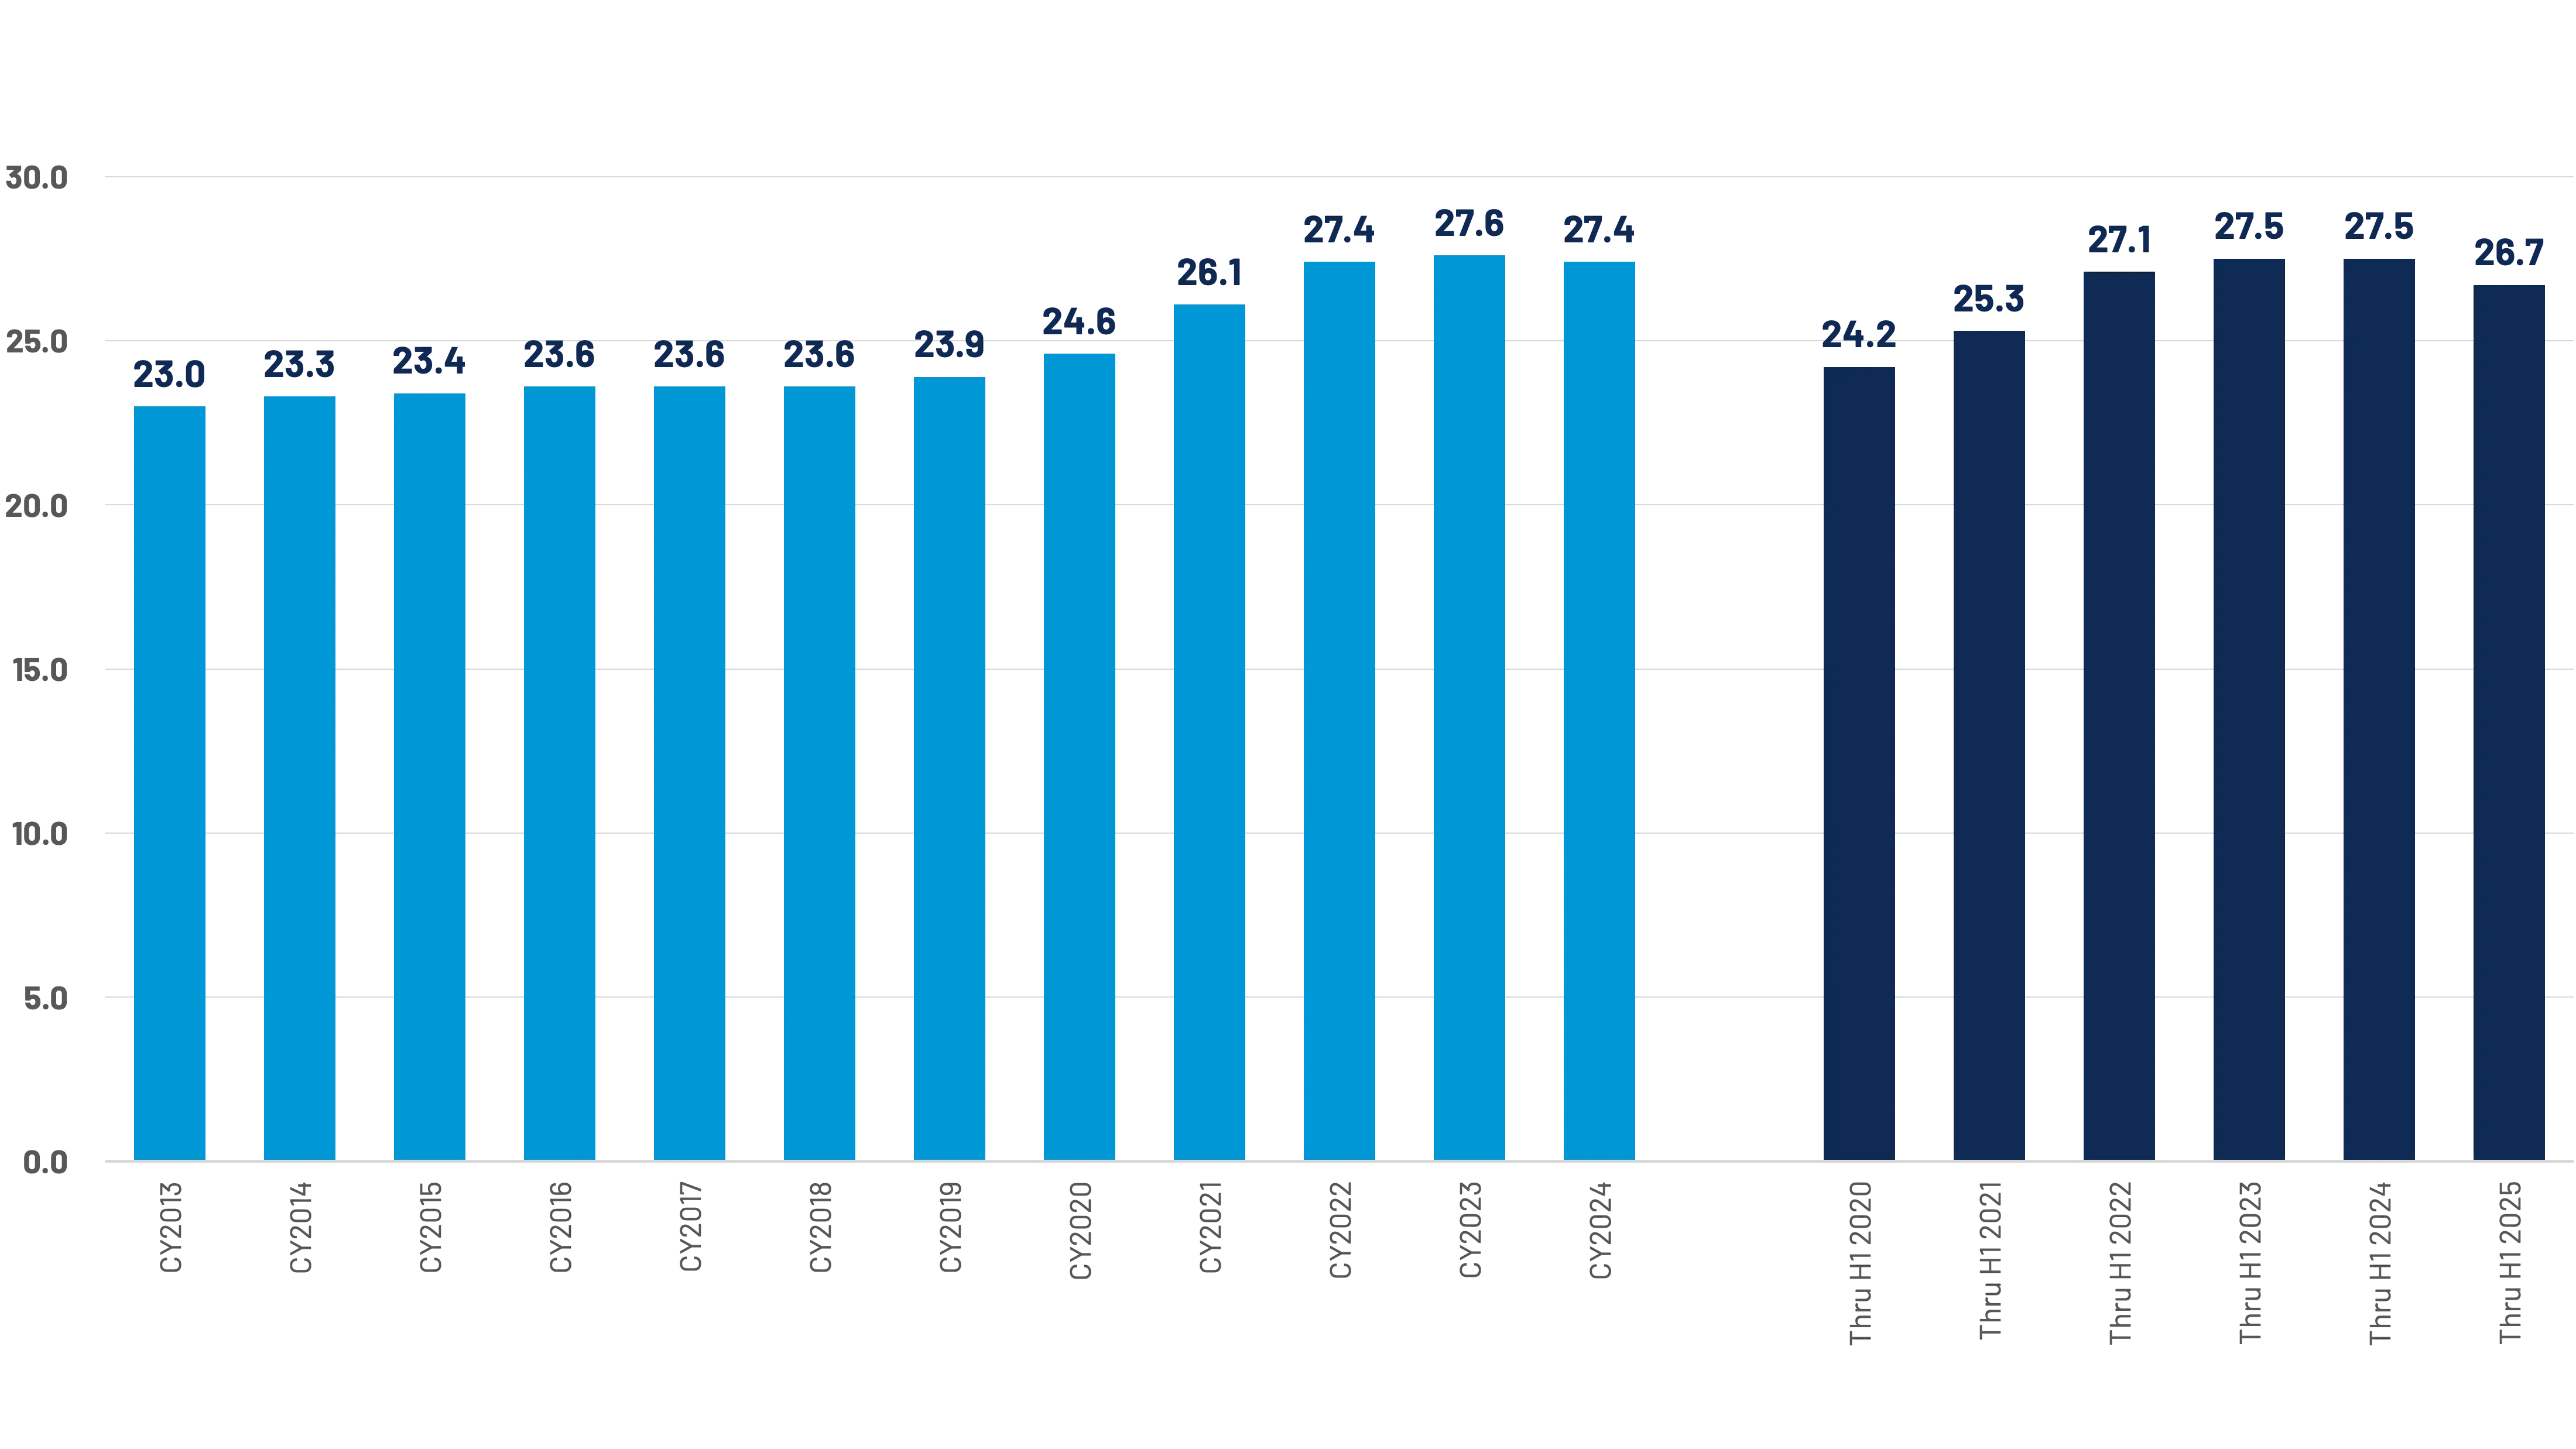
The average total cost of repair (TCOR) finished 2024 between at over $4,730, or +3.8% year-over-year. This is the lowest increase since 2017. Through the first half of 2025, average total repair costs are +1.4% year-over-year.
Increases in repair costs have been mitigated by a slight decline year-over-year in the number of parts and labor hours per repair, and the increase in total losses. However, there are a variety of underlying factors which continue to put upward pressure of repair costs, including labor rates, part prices, and diagnostics. (Figure 8)
Part dollar contributions to repair cost increases continue to shrink relative to labor and miscellaneous costs – which often include diagnostics. (Figure 9)
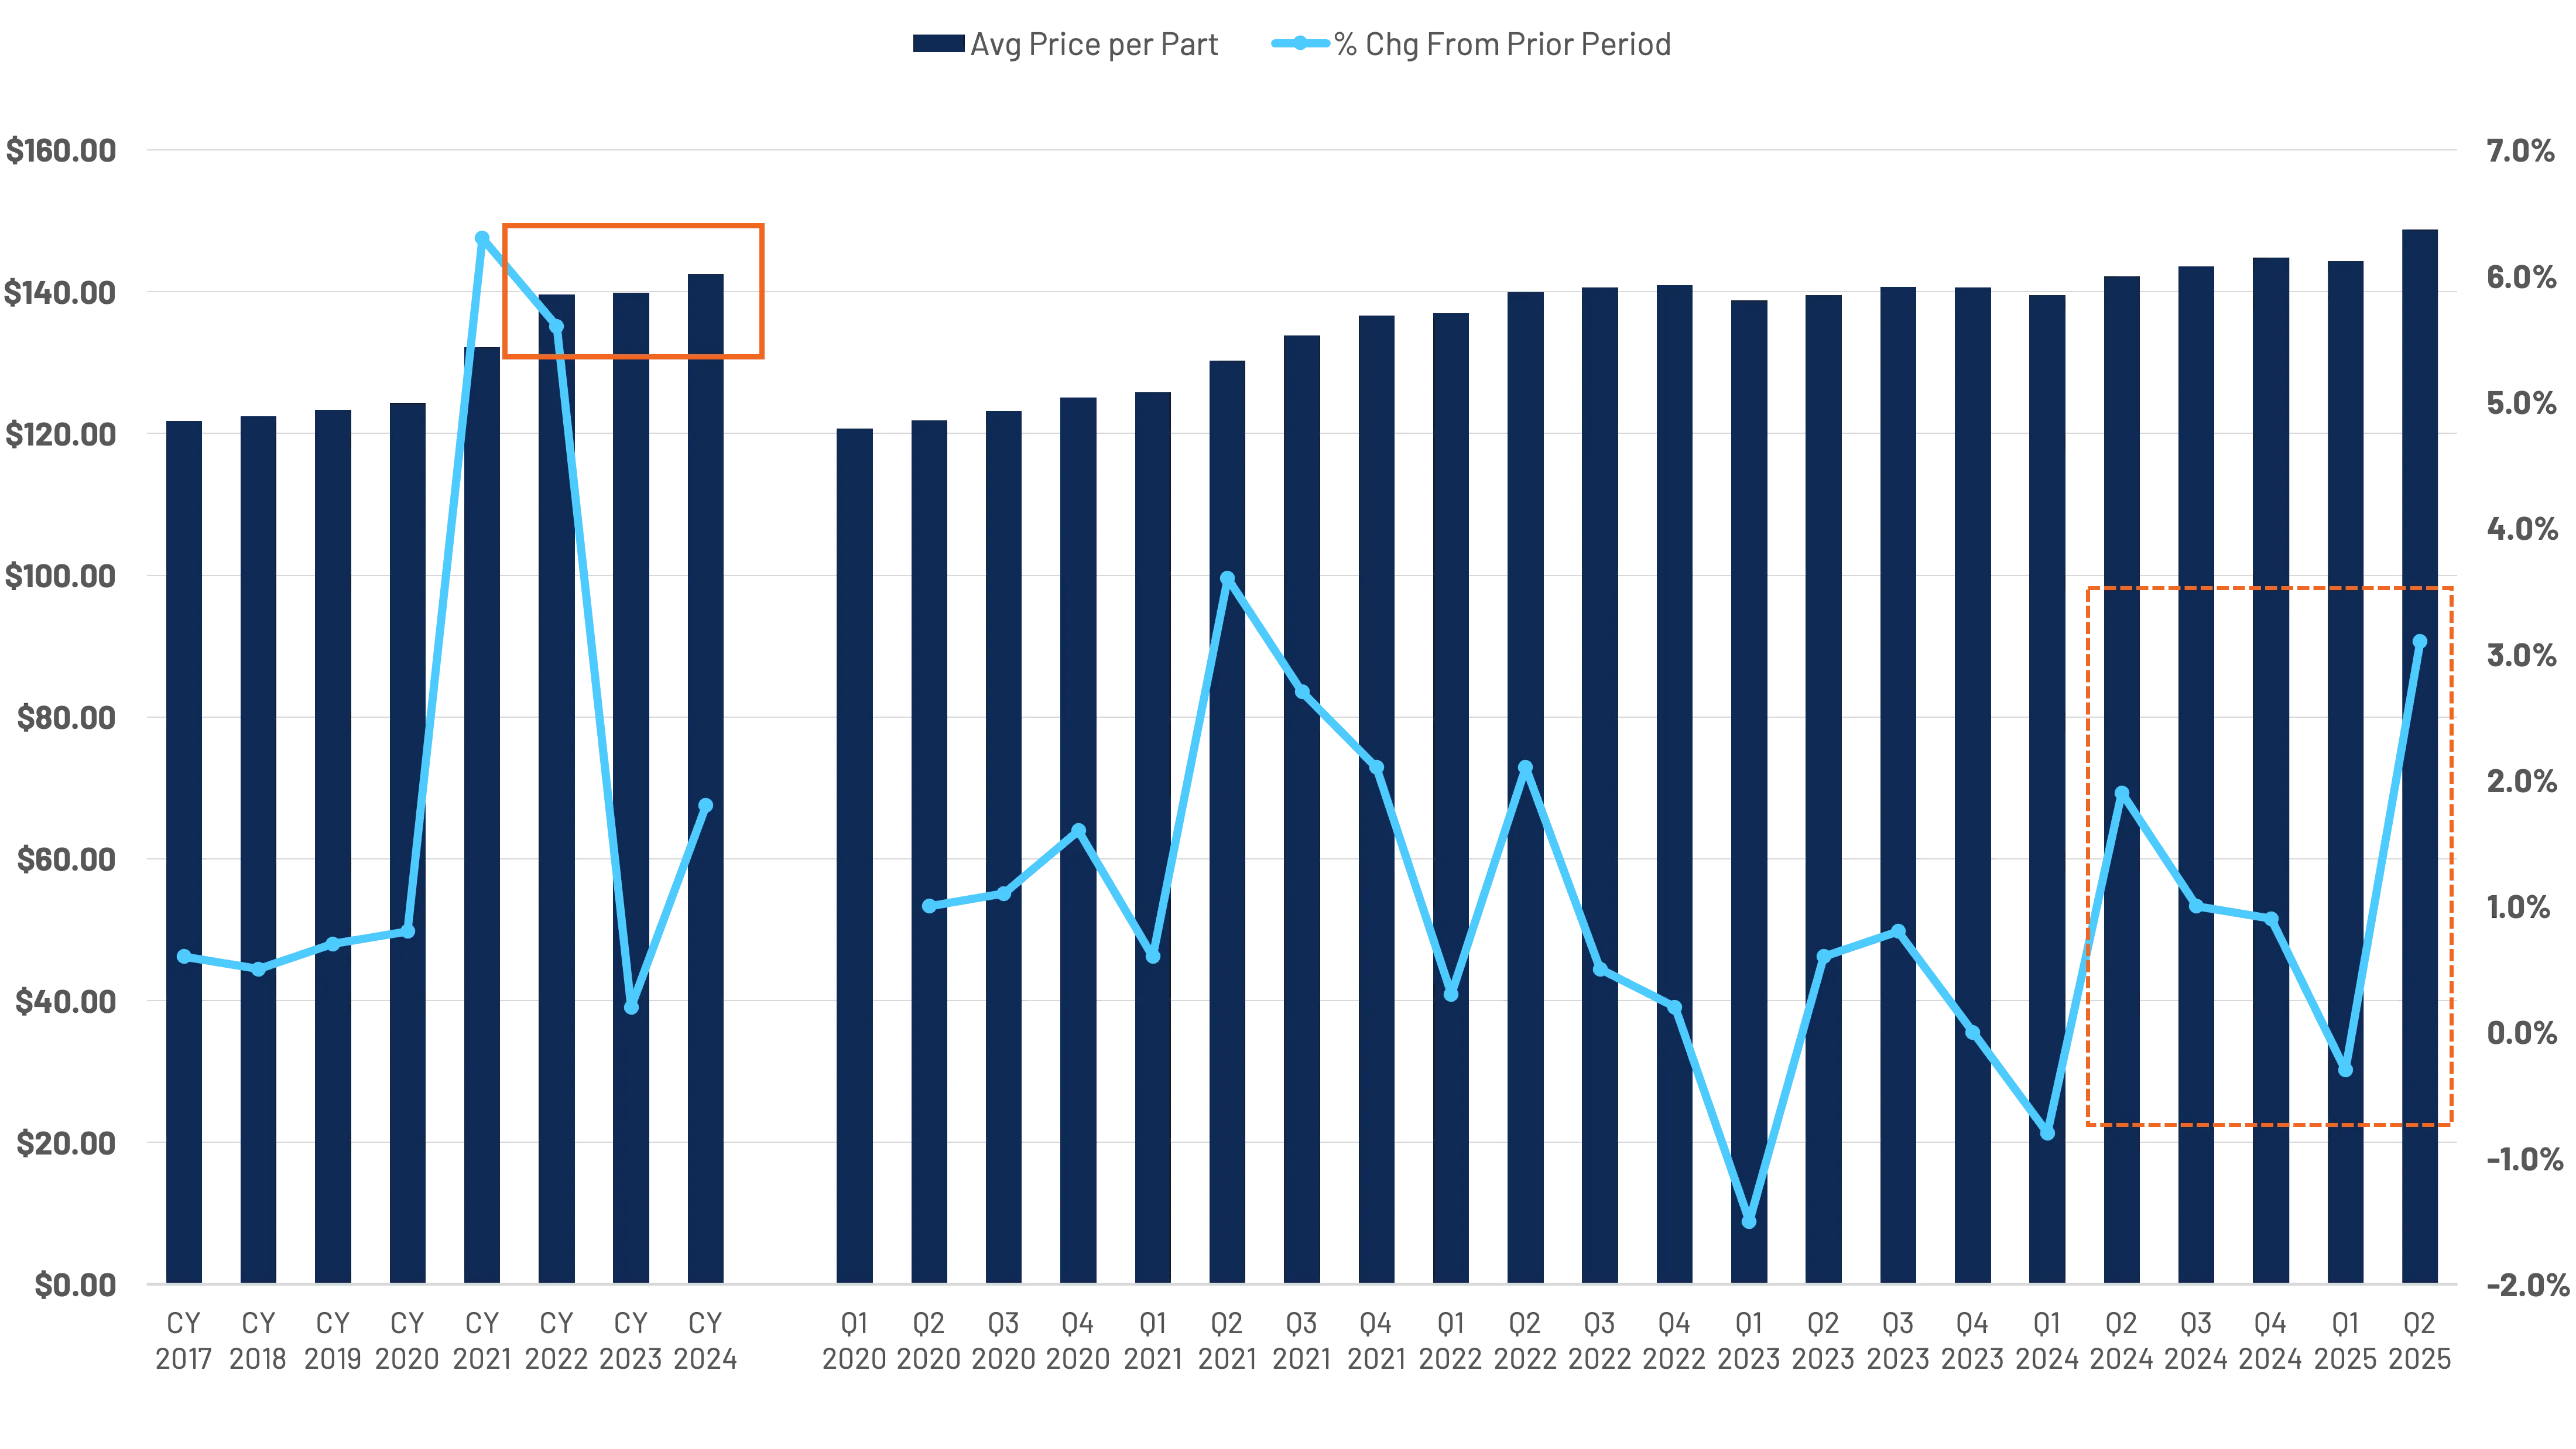
Average part prices had been relatively flat between 2022 and 2023. However, prices did begin to show signs of inflation beginning in Q2 2024. While less evident in the early months of 2025, March-May results indicate a year-over-year increase of 4.4%.
Though still developing, June (+5.0%) and July (+6.6%) results indicate increased acceleration of part prices as pre-tariff supplies dwindle, and pricing reflects the effect of tariffs. (Figure 10)
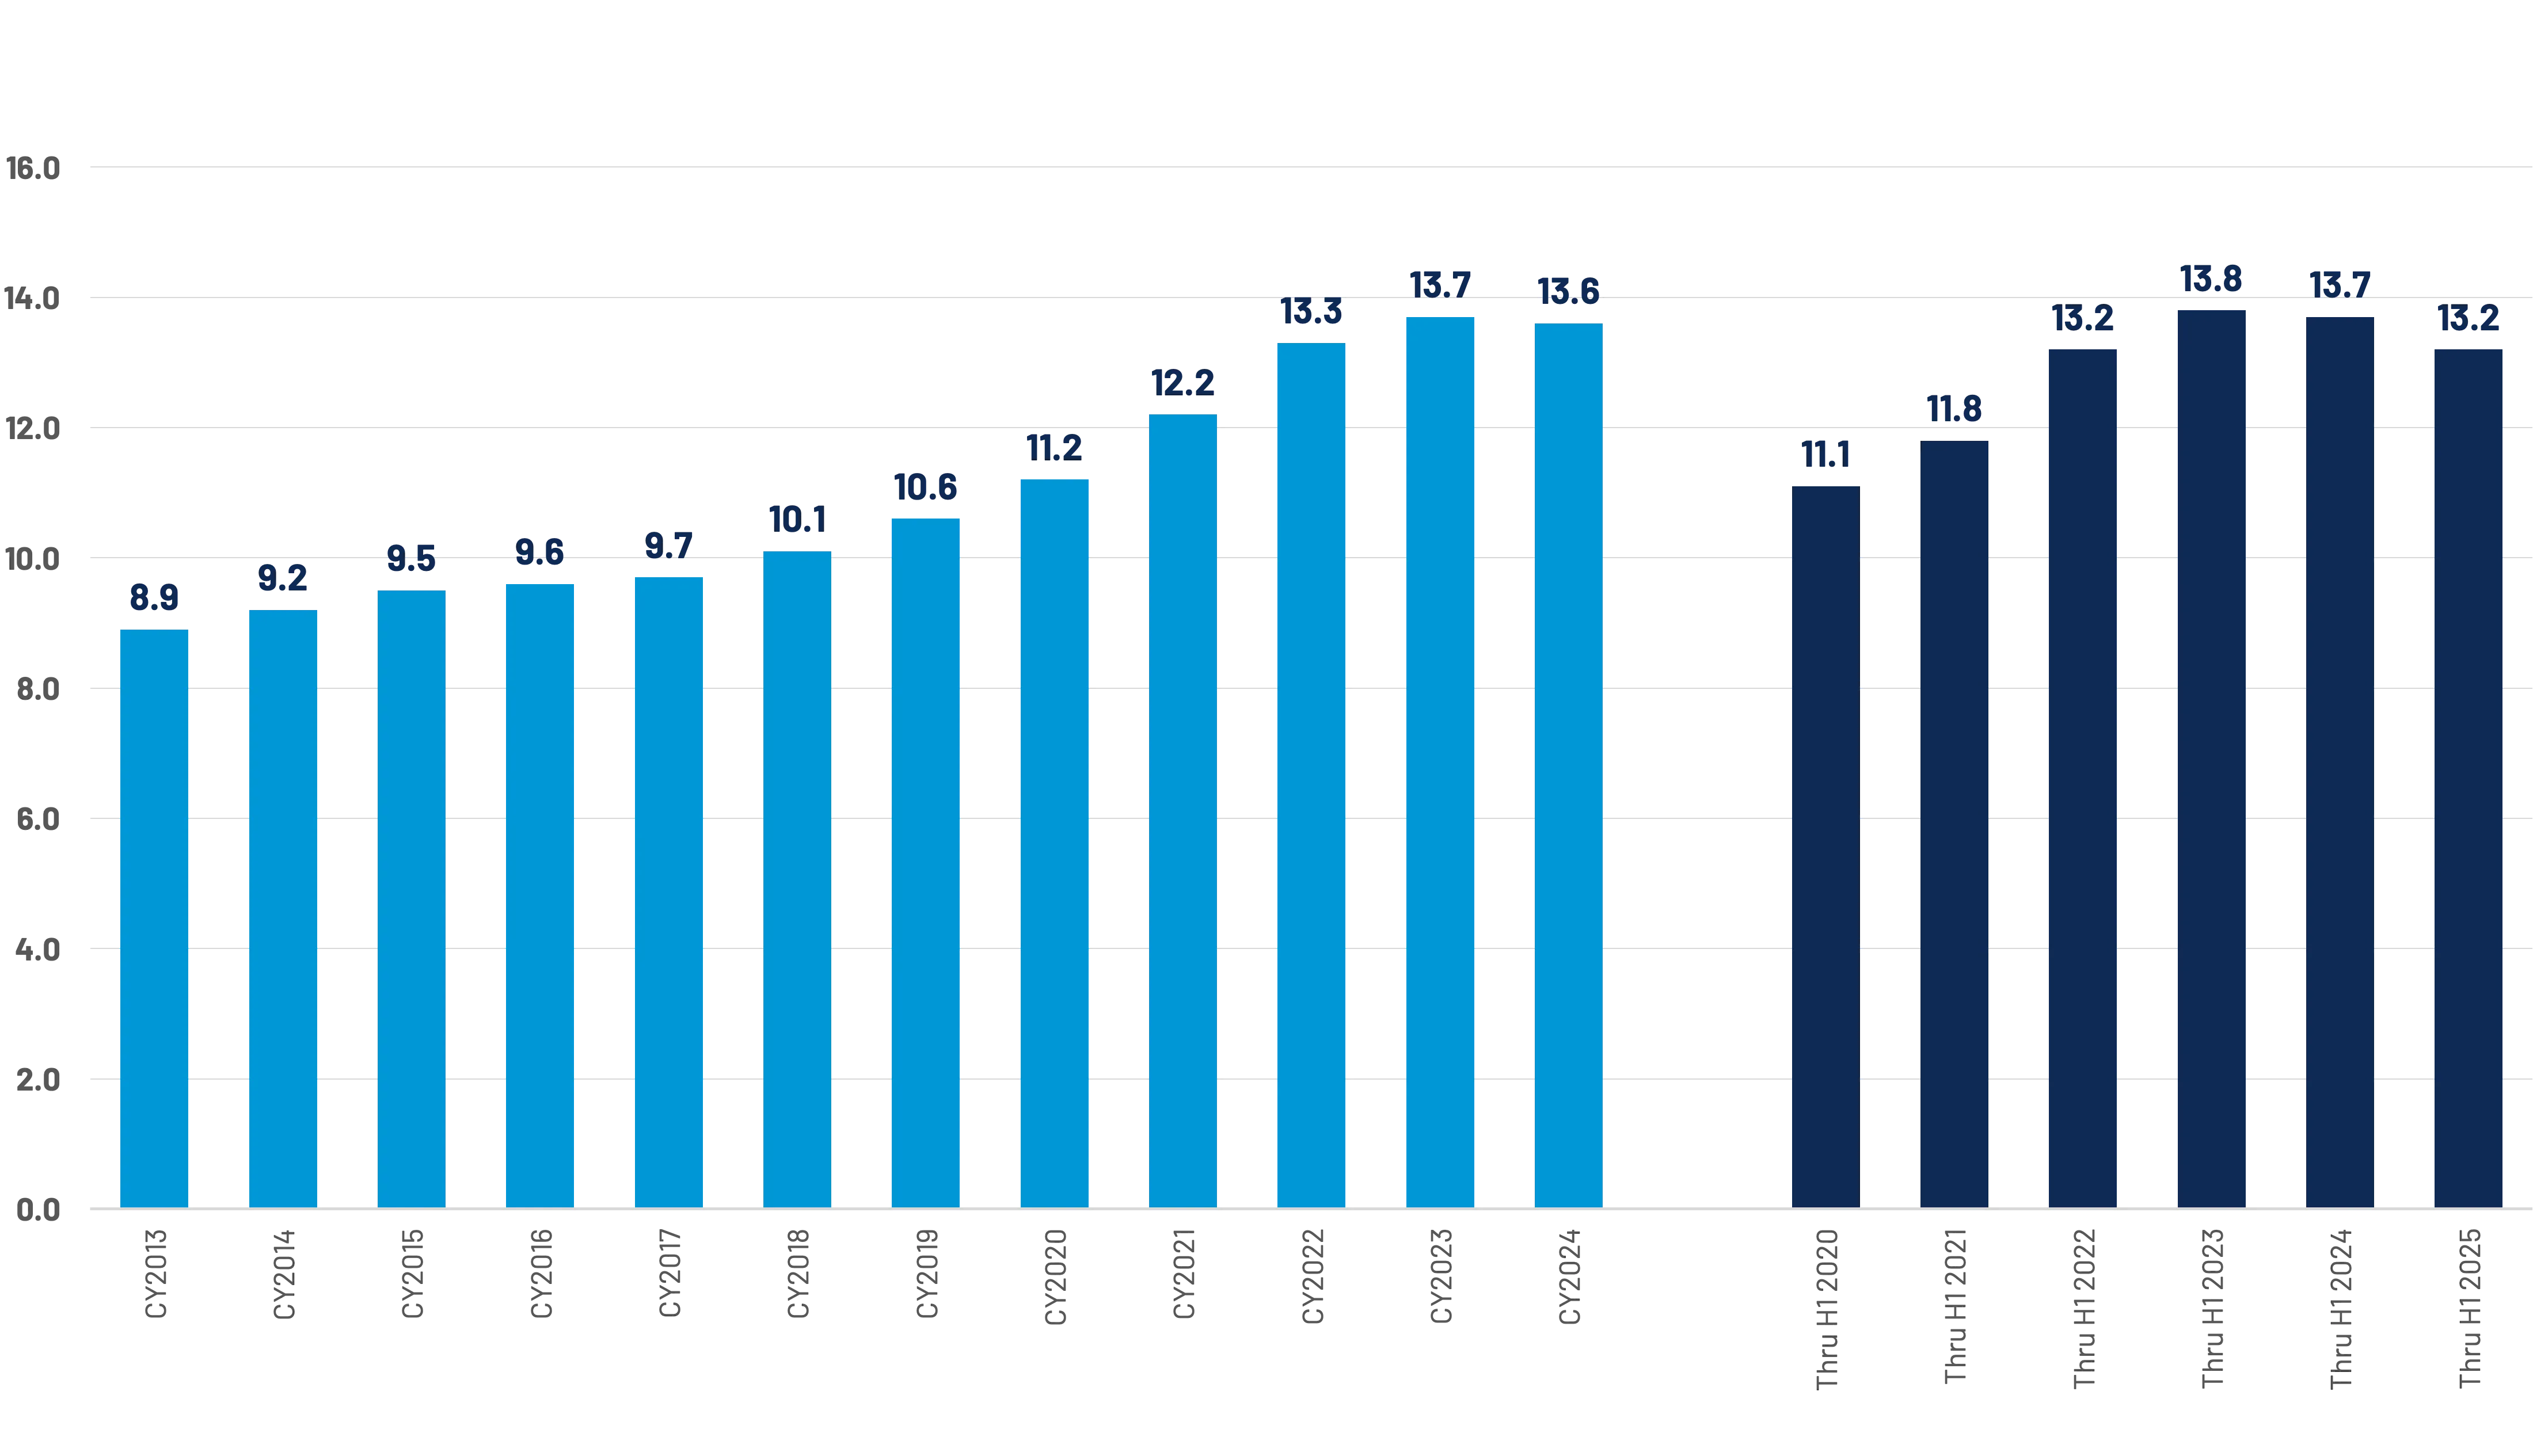
Industry part utilization was down slightly in 2024 at 13.6 parts per repair estimate. Initial results through H1 indicate a further decline in the average number of parts per repair – down ~0.5 parts per repair. This result could still be developing (supplements, etc.). Much of this could be attributed to repairable age mix and increased total losses. (Figure 11)
Like part volume, average labor hours saw a slight decline in 2024. Initial results for H1 indicate a notable decline in the average number of labor hours per repair – down ~0.8 hours per repair, though this result, could still be developing (supplements, etc.). This, too, could be attributed to repairable age mix and increased total losses. (Figure 12)
Labor rates – as reported to CCC through insurance claims, etc. – continue to be a major driver of year-over-year repair cost increases. H1 2025 saw a 3.1% increase relative to H1 2024. Like the 4.5% average increase in 2024, this reflects a slowing rate of increase. 2023 was +7.5% year-over-year. Average labor rate increases continue to near the inflation rate. (Figure 13)

As we discussed previously, ADAS features continue to proliferate. This is reflected in the continued increase in appraisals that include diagnostic operations - namely, scans and calibrations. The share of DRP appraisals that included a scan reached nearly 87% in Q1 2025, while calibrations trended towards 32%.
The inclusion of calibrations is accelerating at a rate similar to what we saw with scans in recent years and implies a continued increase in repair costs. While over 91% of scans are included in the initial DRP estimates, the majority of calibrations appear on supplements, requiring additional review and approval time while vehicles are in the process of being repaired. (Figure 14)
Shop Productivity Trends
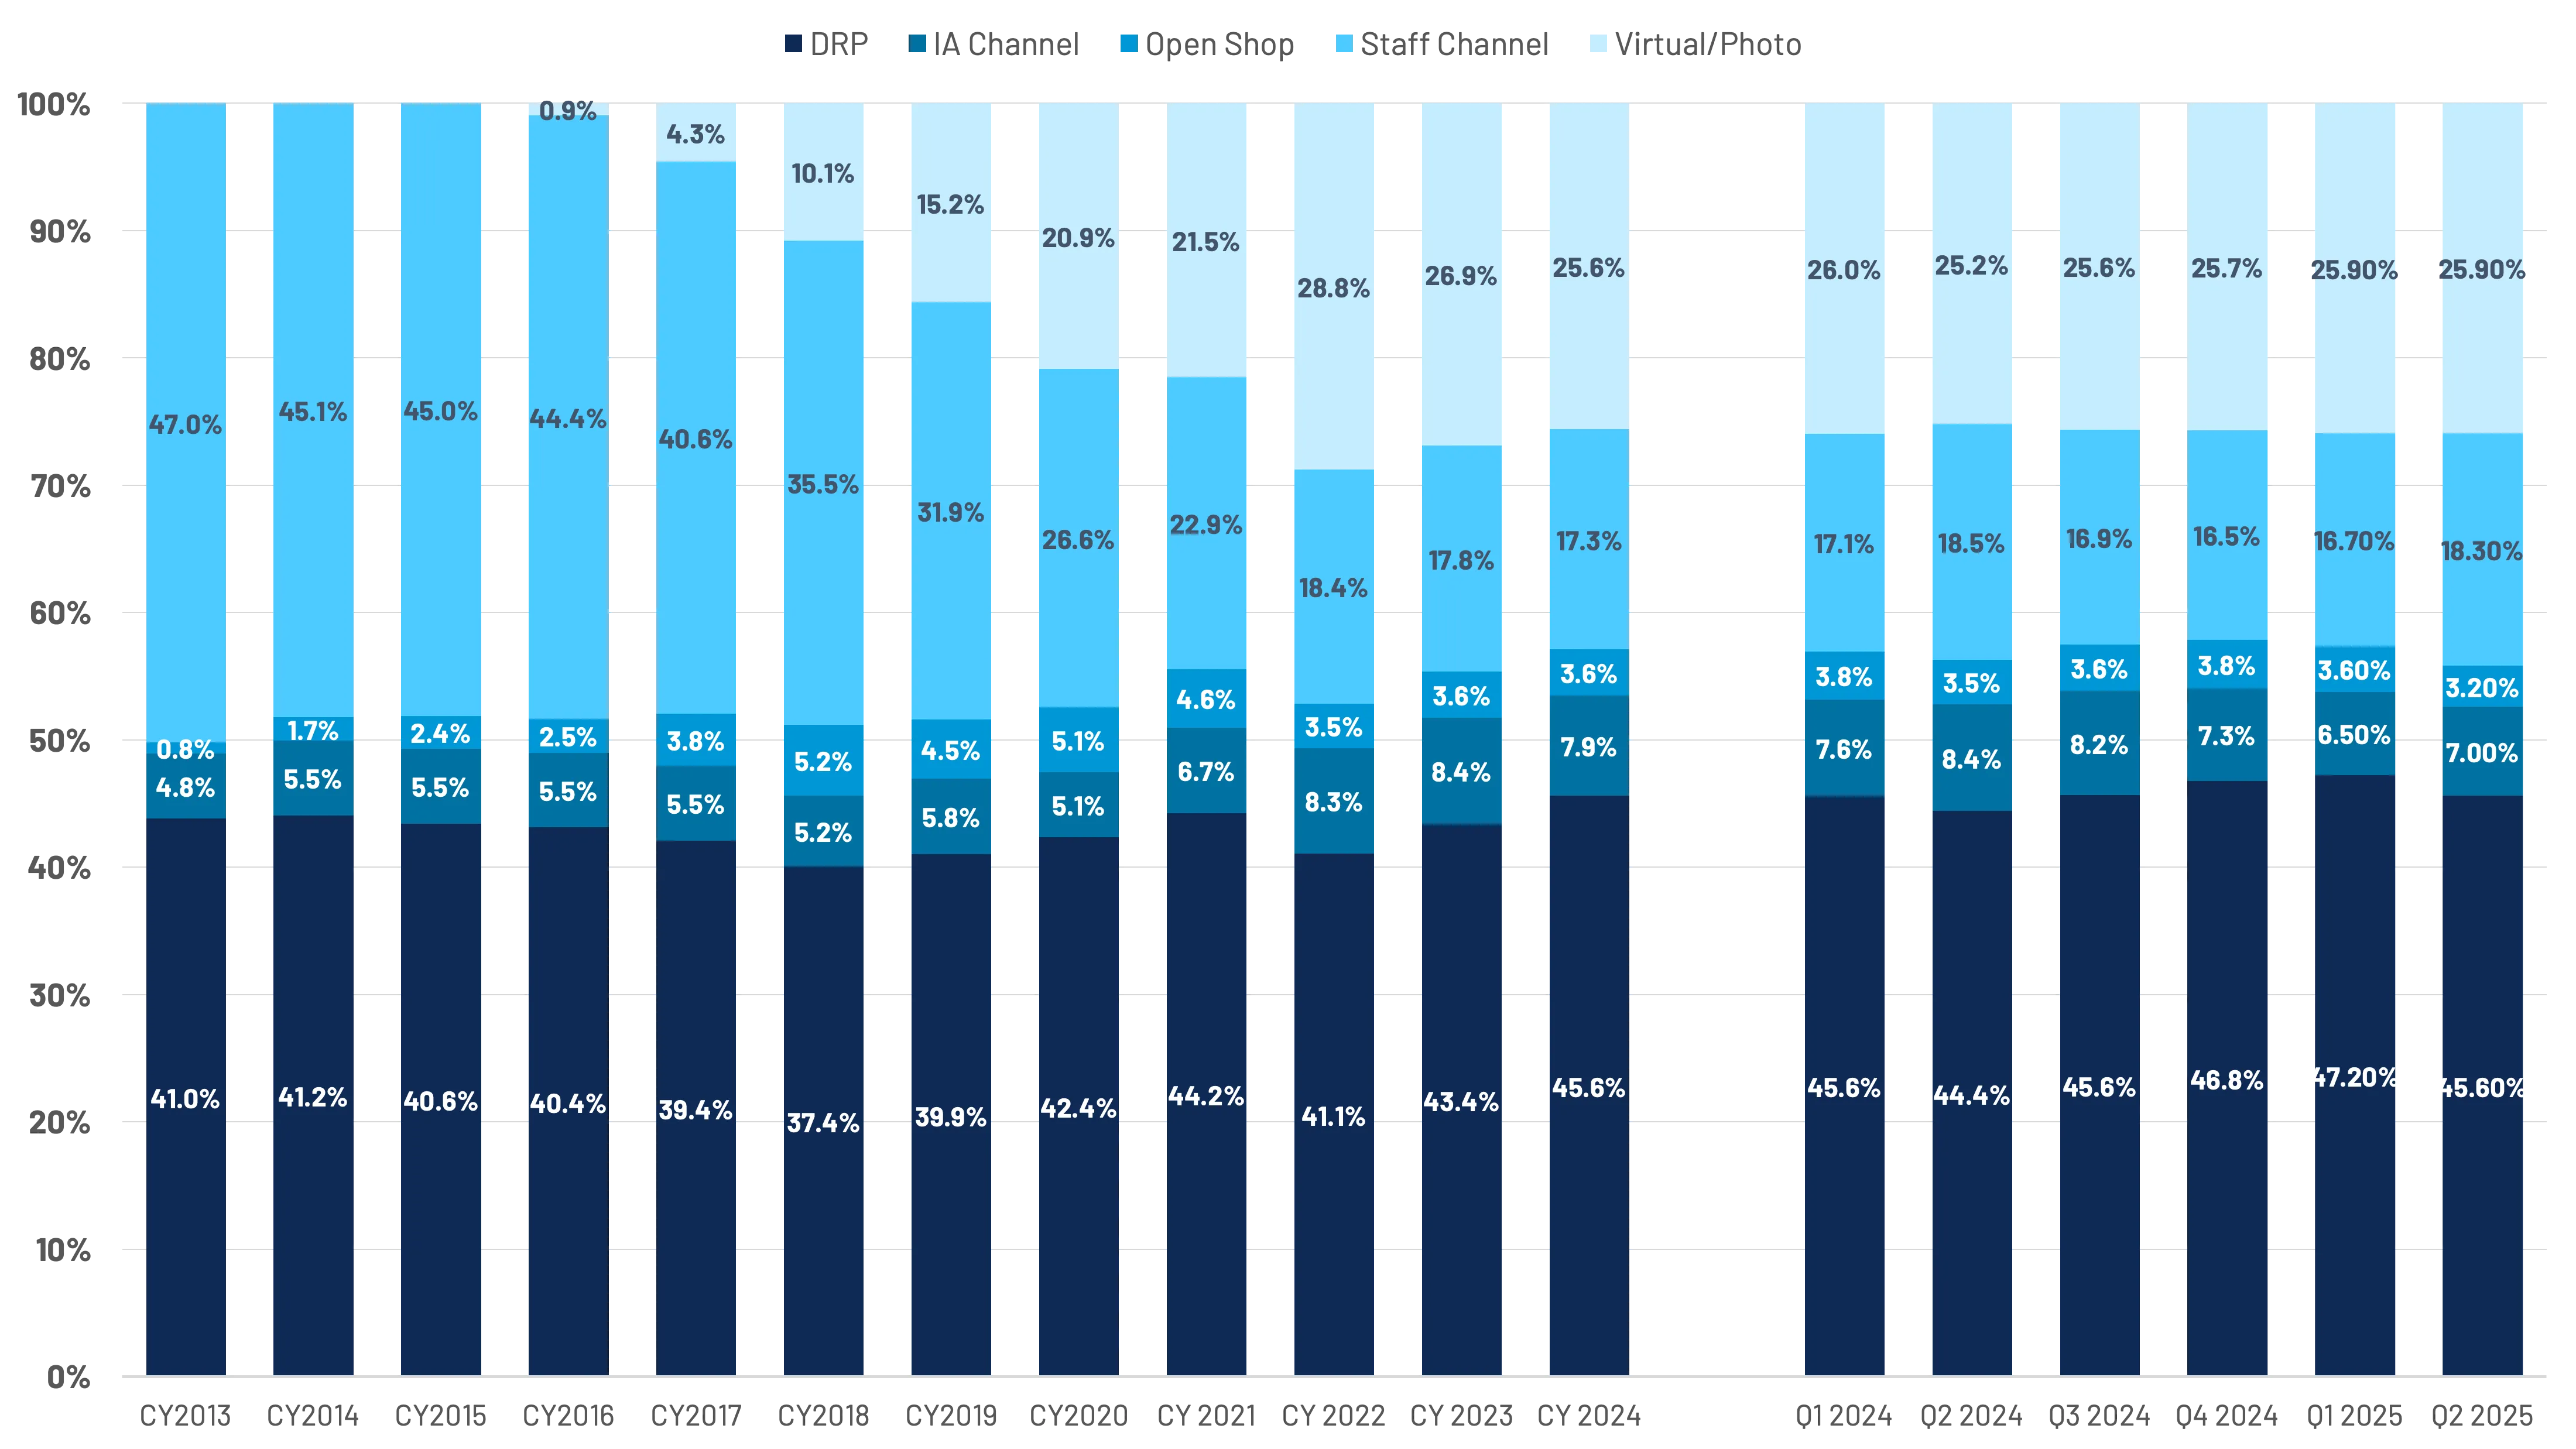
Method of inspection trends reflect a continued reliance upon direct repair programs to complete appraisals on behalf of insurance carriers. Carriers continue to evolve their mix of inspection solutions to meet the needs of their clients and long-term staffing and operations objectives. An increased total loss propensity adds additional pressure in getting vehicles to the right place – a shop or salvage yard – the first time. (Figure 15)
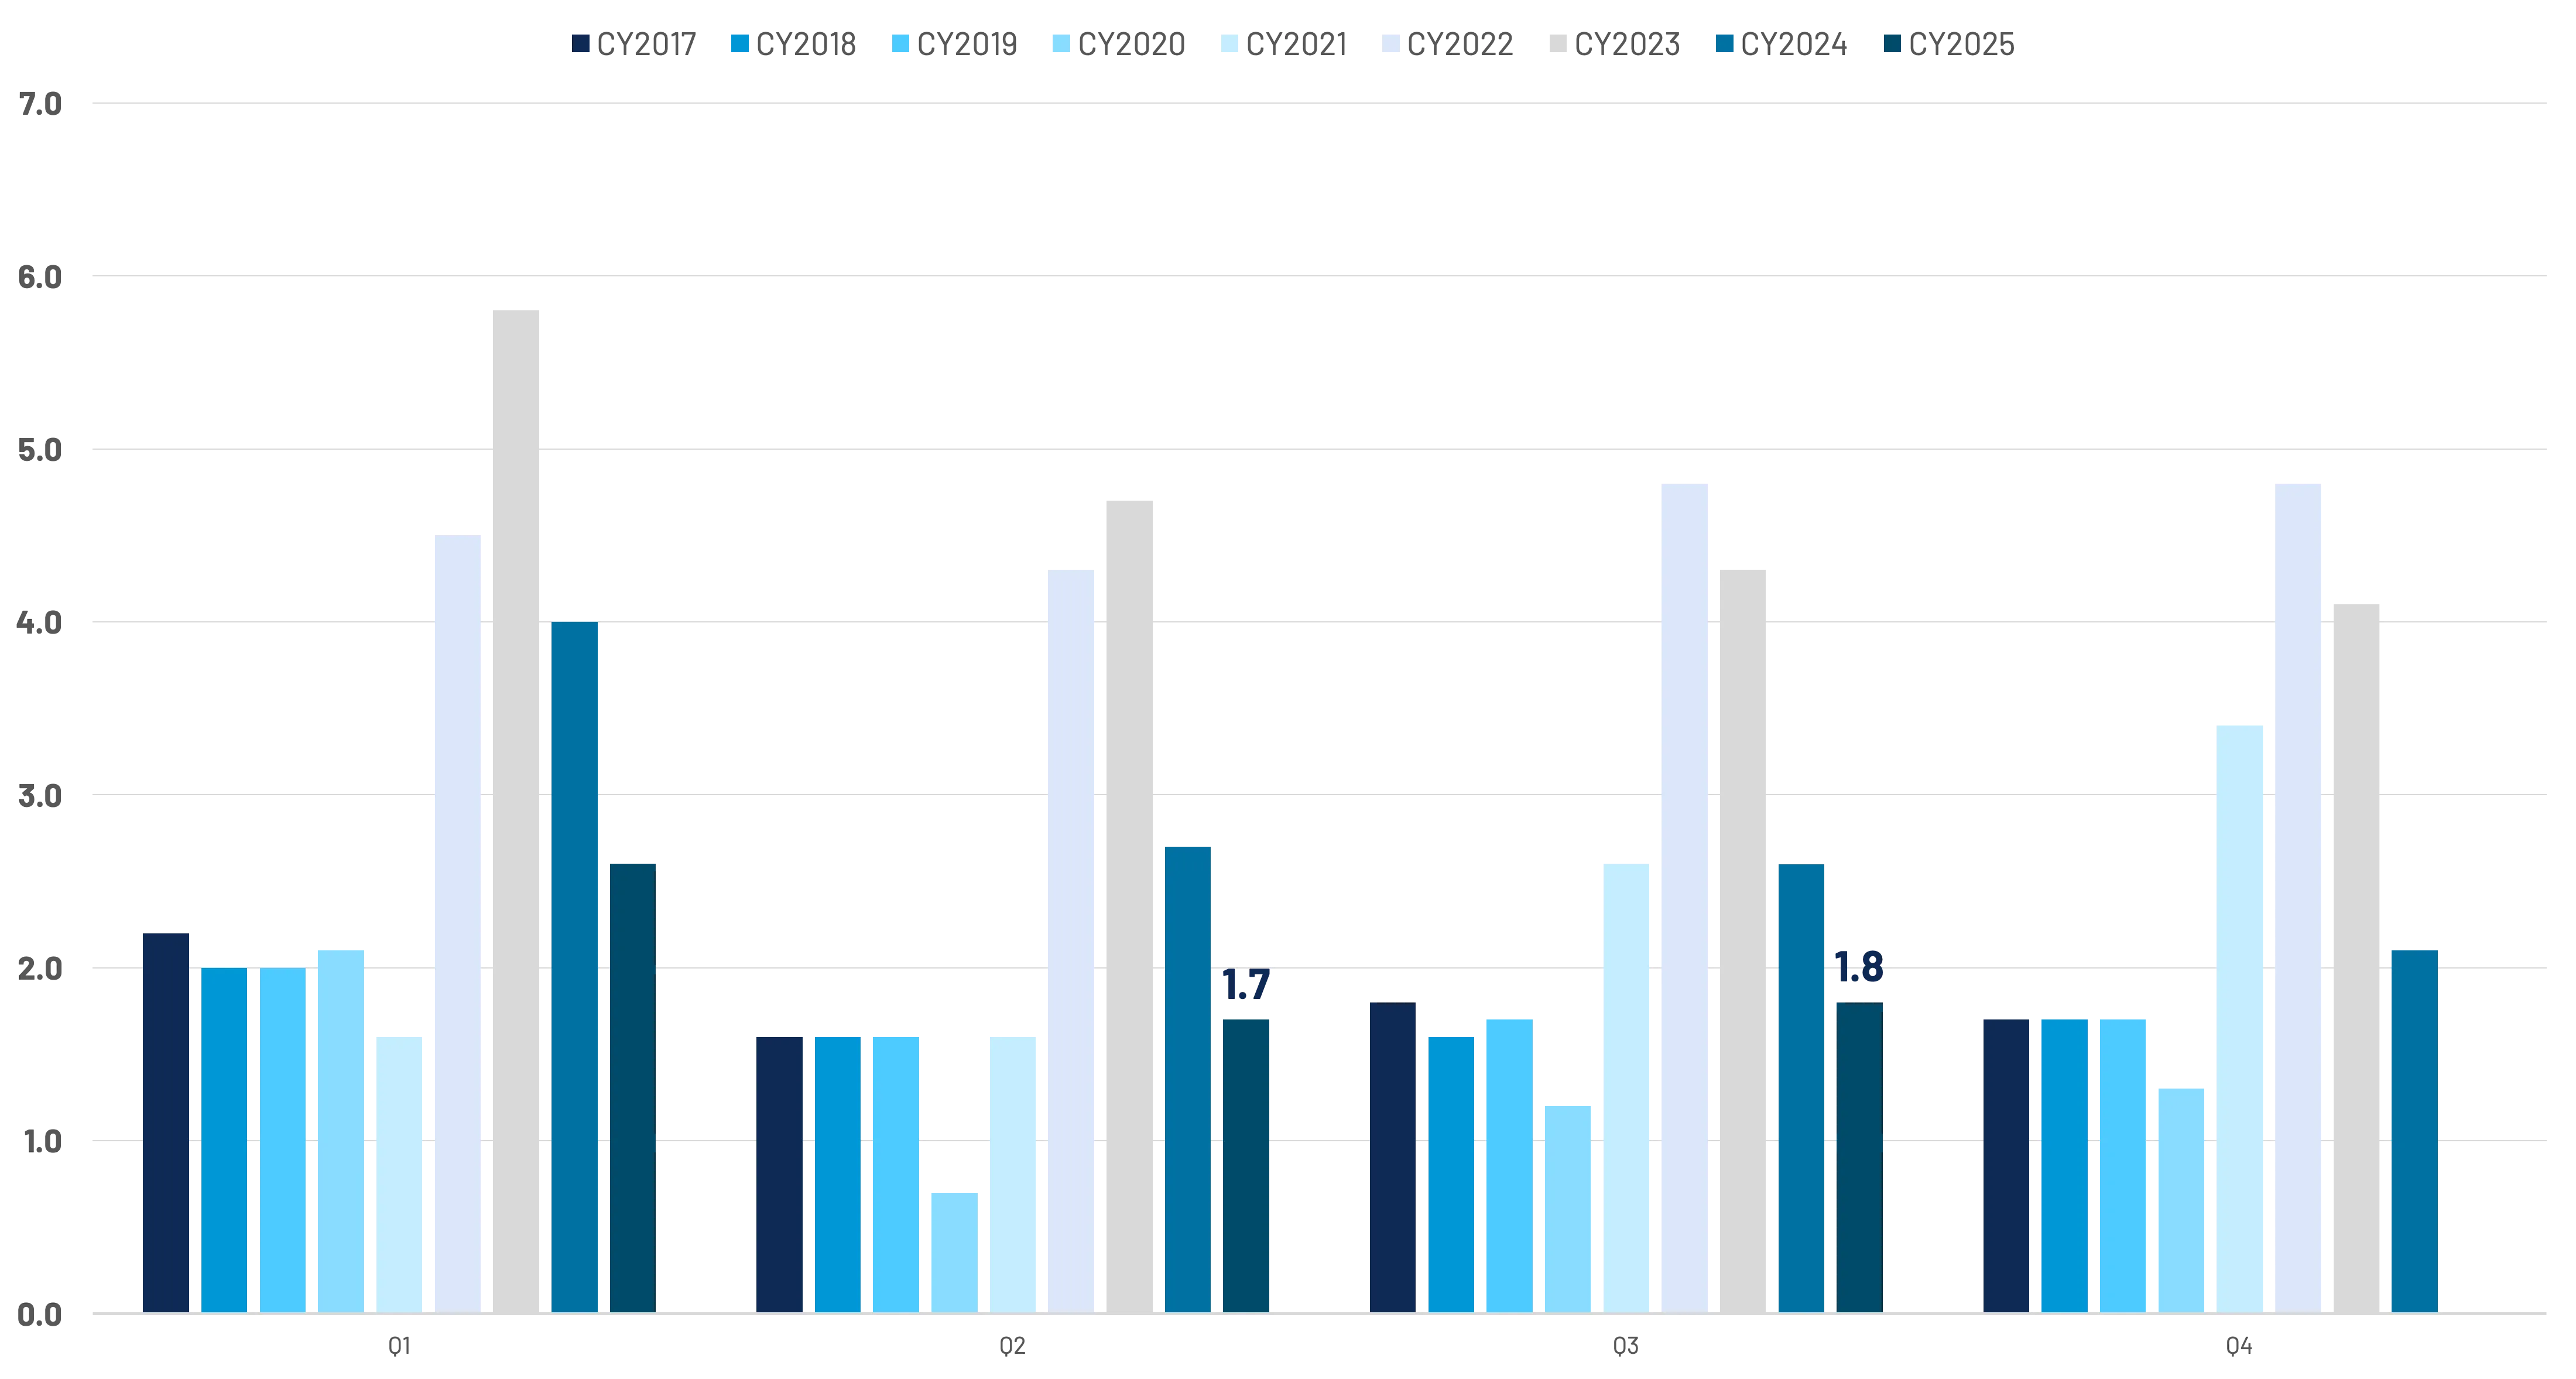
Shop backlogs continue to improve on a year-over-year basis. Where we saw more heavier hit vehicles being repaired in 2022 and 2023, decreased vehicle values has increased total loss frequency, accounting, at least in part, to improved cycle times. Claims volumes, which remain down year-over-year, are also contributing to improved backlogs. However, recent Crash Network reporting indicates that production employees are exceeding typical hours per week, a sign that renewed hiring could be on the horizon. (Figure 16)
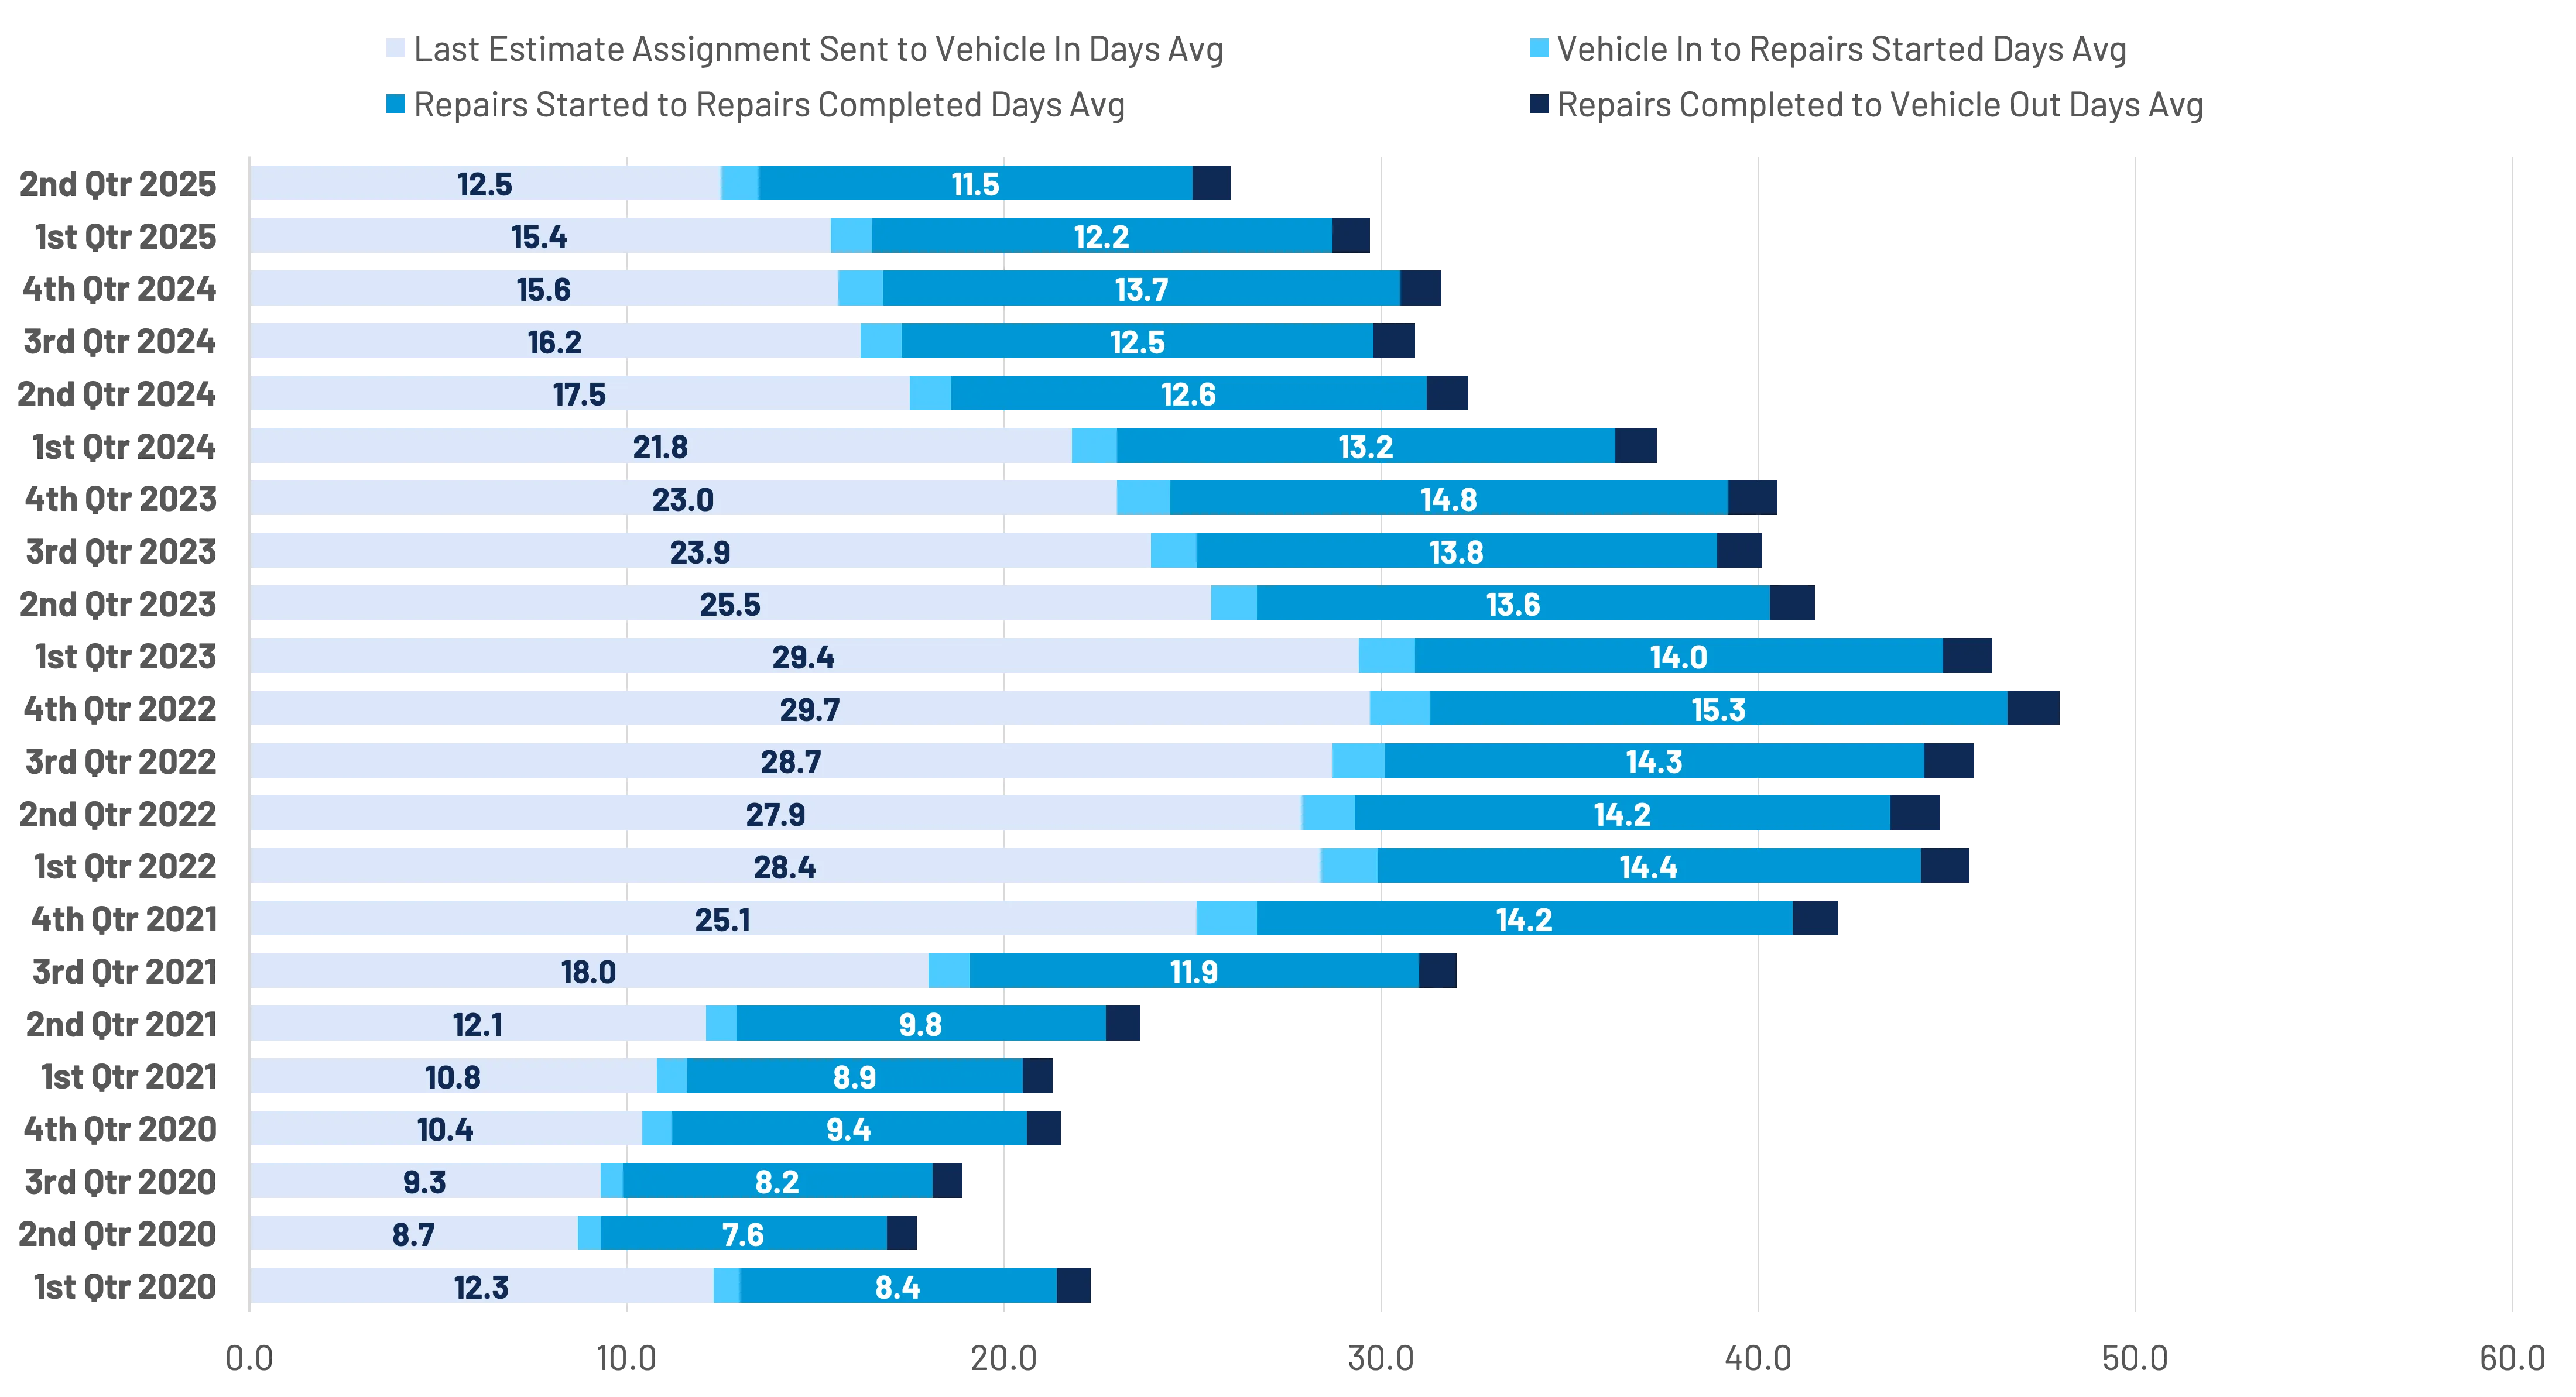
Improved backlogs and increased total losses are also reflected in improved cycle times. The average time between last estimate assignment sent and vehicle in (to the shop) are almost half of the days required in Q1 2023. Overall repair days remain down ~2 days in total from their peak yet remain up by 4-5 days relative to 2020. Factors such as increased supplement handling and technician shortages could be contributing to elongated repair times. (Figure 17)
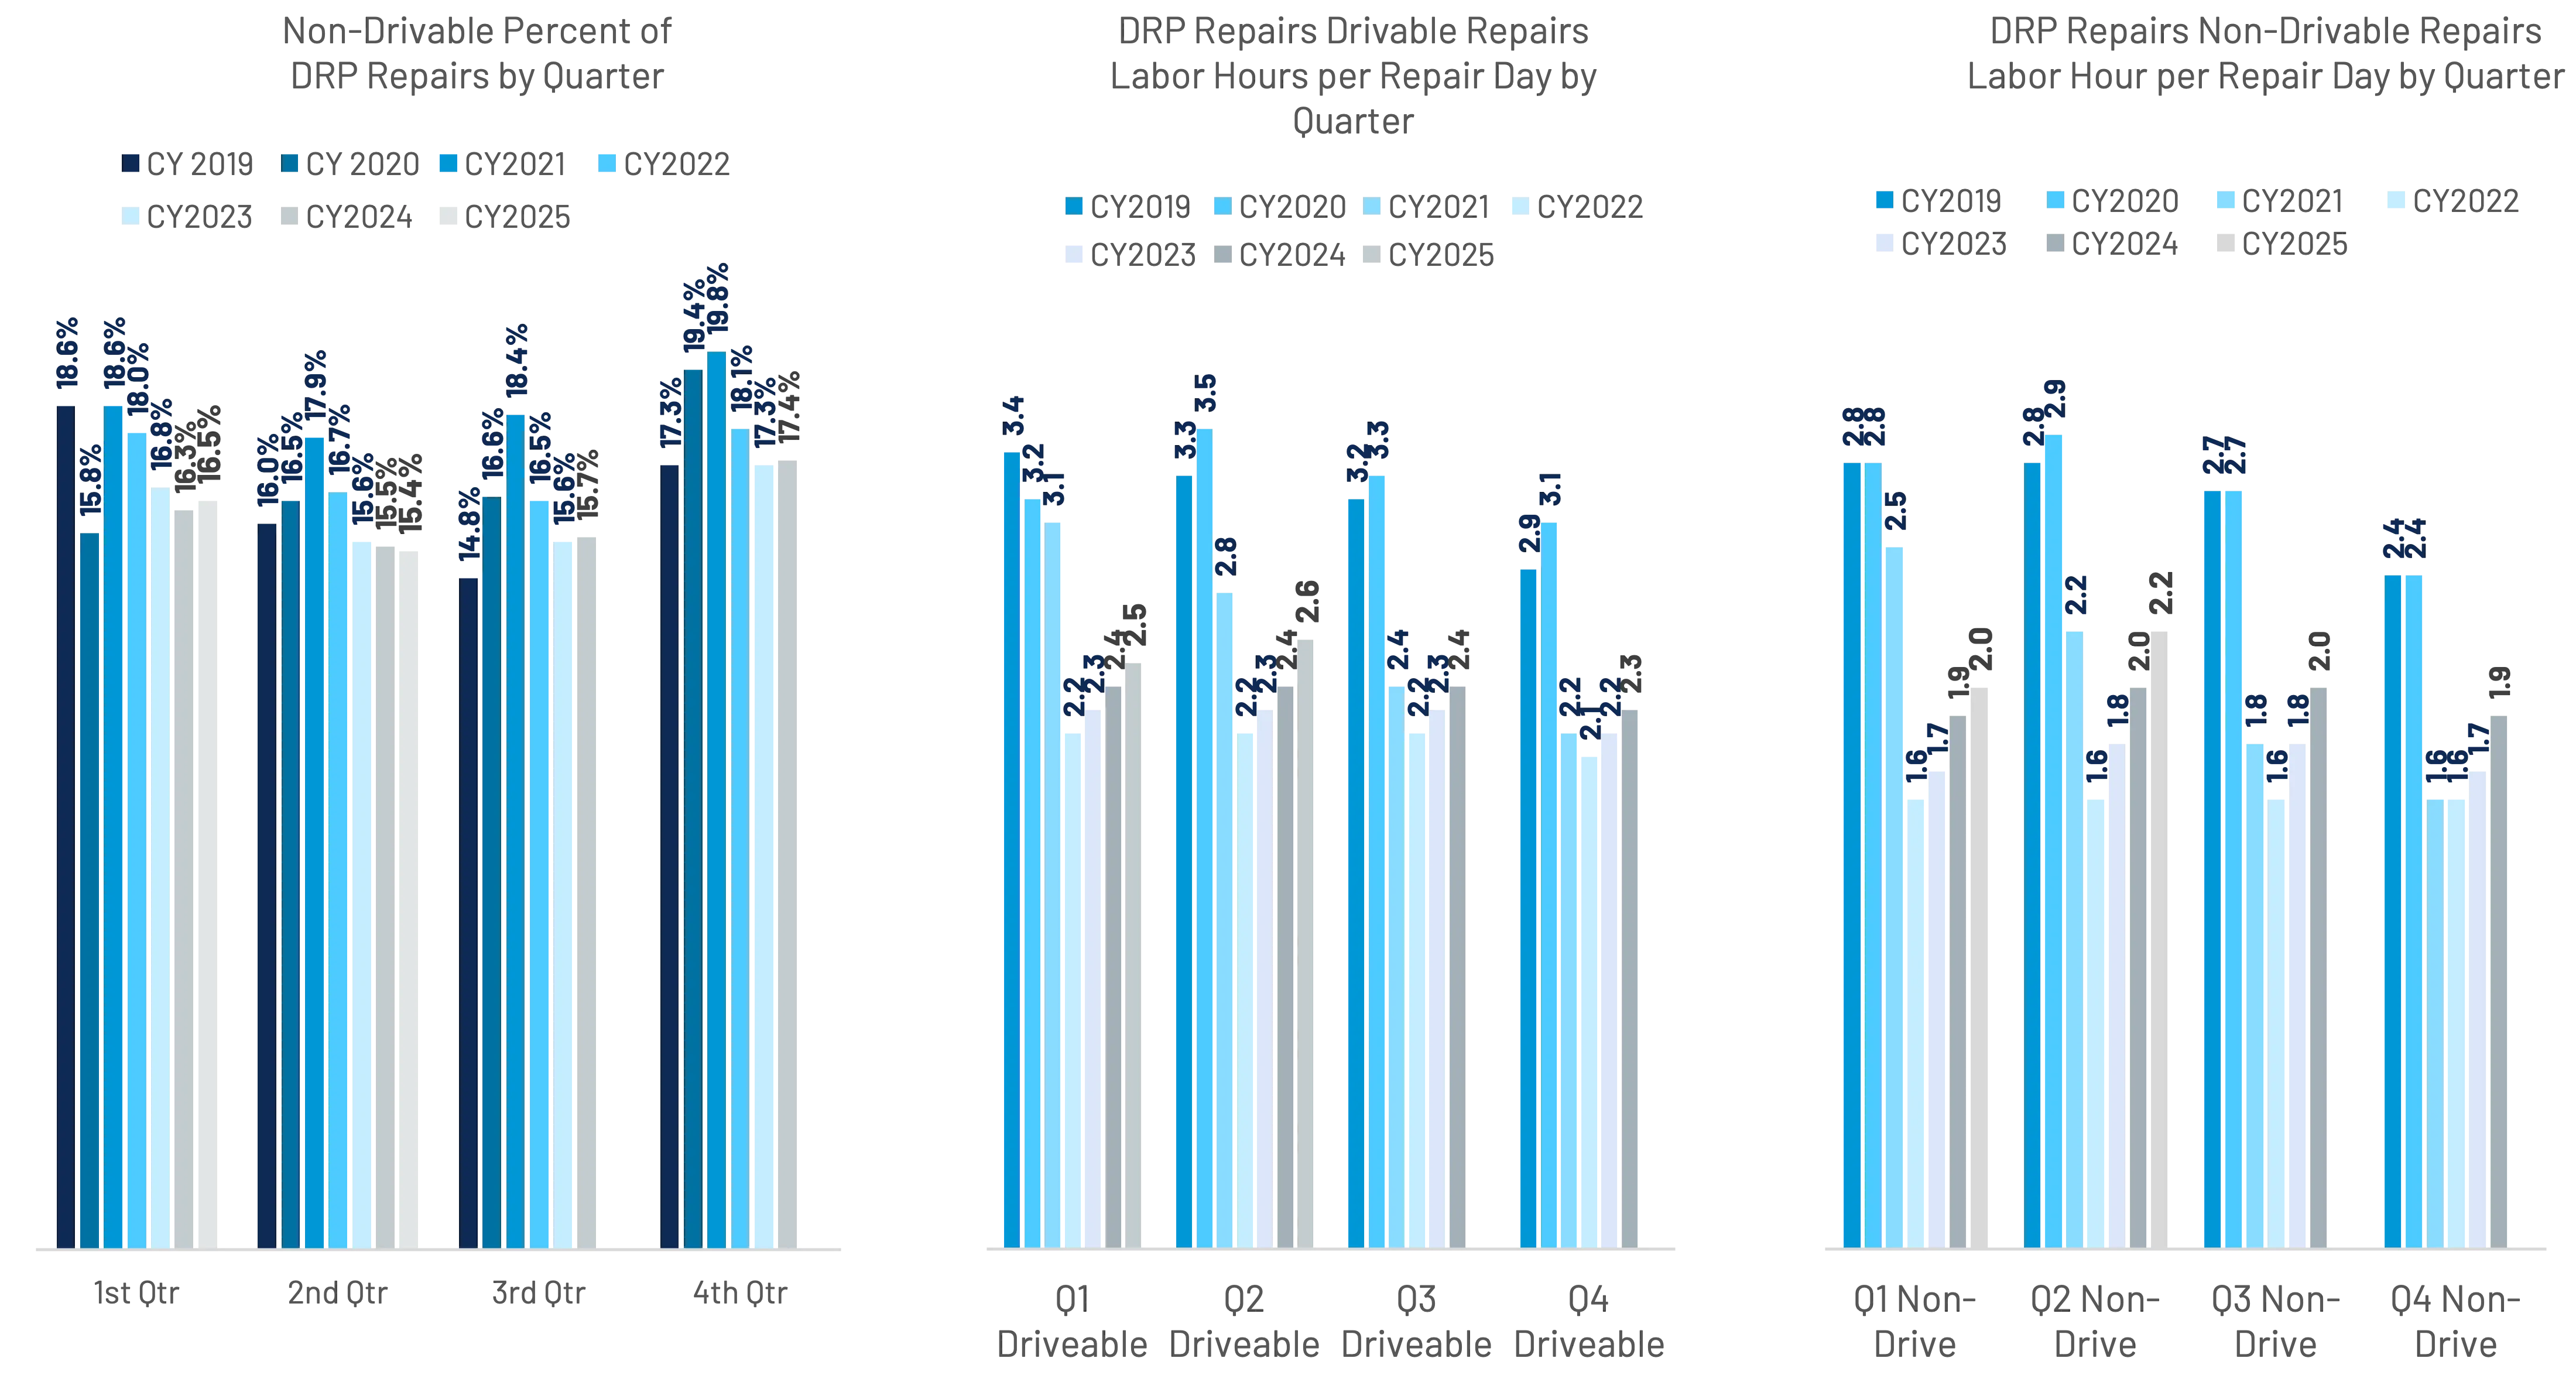
The share of non-driveable repairable claims were down one-tenth of a percent YoY in Q2 2025. Daily productivity – measured by labor hours per repair day, indicated modest, yet noticeable improvements year-over-year, especially with non-driveable vehicles. Given the increased propensity for repairs to include supplements, productivity improvements will likely rely upon improved communication and process efficiency between shops and insurance carriers. (Figure 18)

Casualty Industry Data
Executive Summary
As of H1 2025, we are also observing notable cost increases on durable medical equipment, supplies, and pharmacy/drugs within first party billing, which may be an early indicator of preemptive tariff-related price hikes. Emerging treatments such as PRP (platelet-rich plasma therapy) and ESWT (extracorporeal shock wave therapy) continue to increase rapidly in frequency and therapy from localized epicenters of California and Florida, respectively.
Third Party Trends
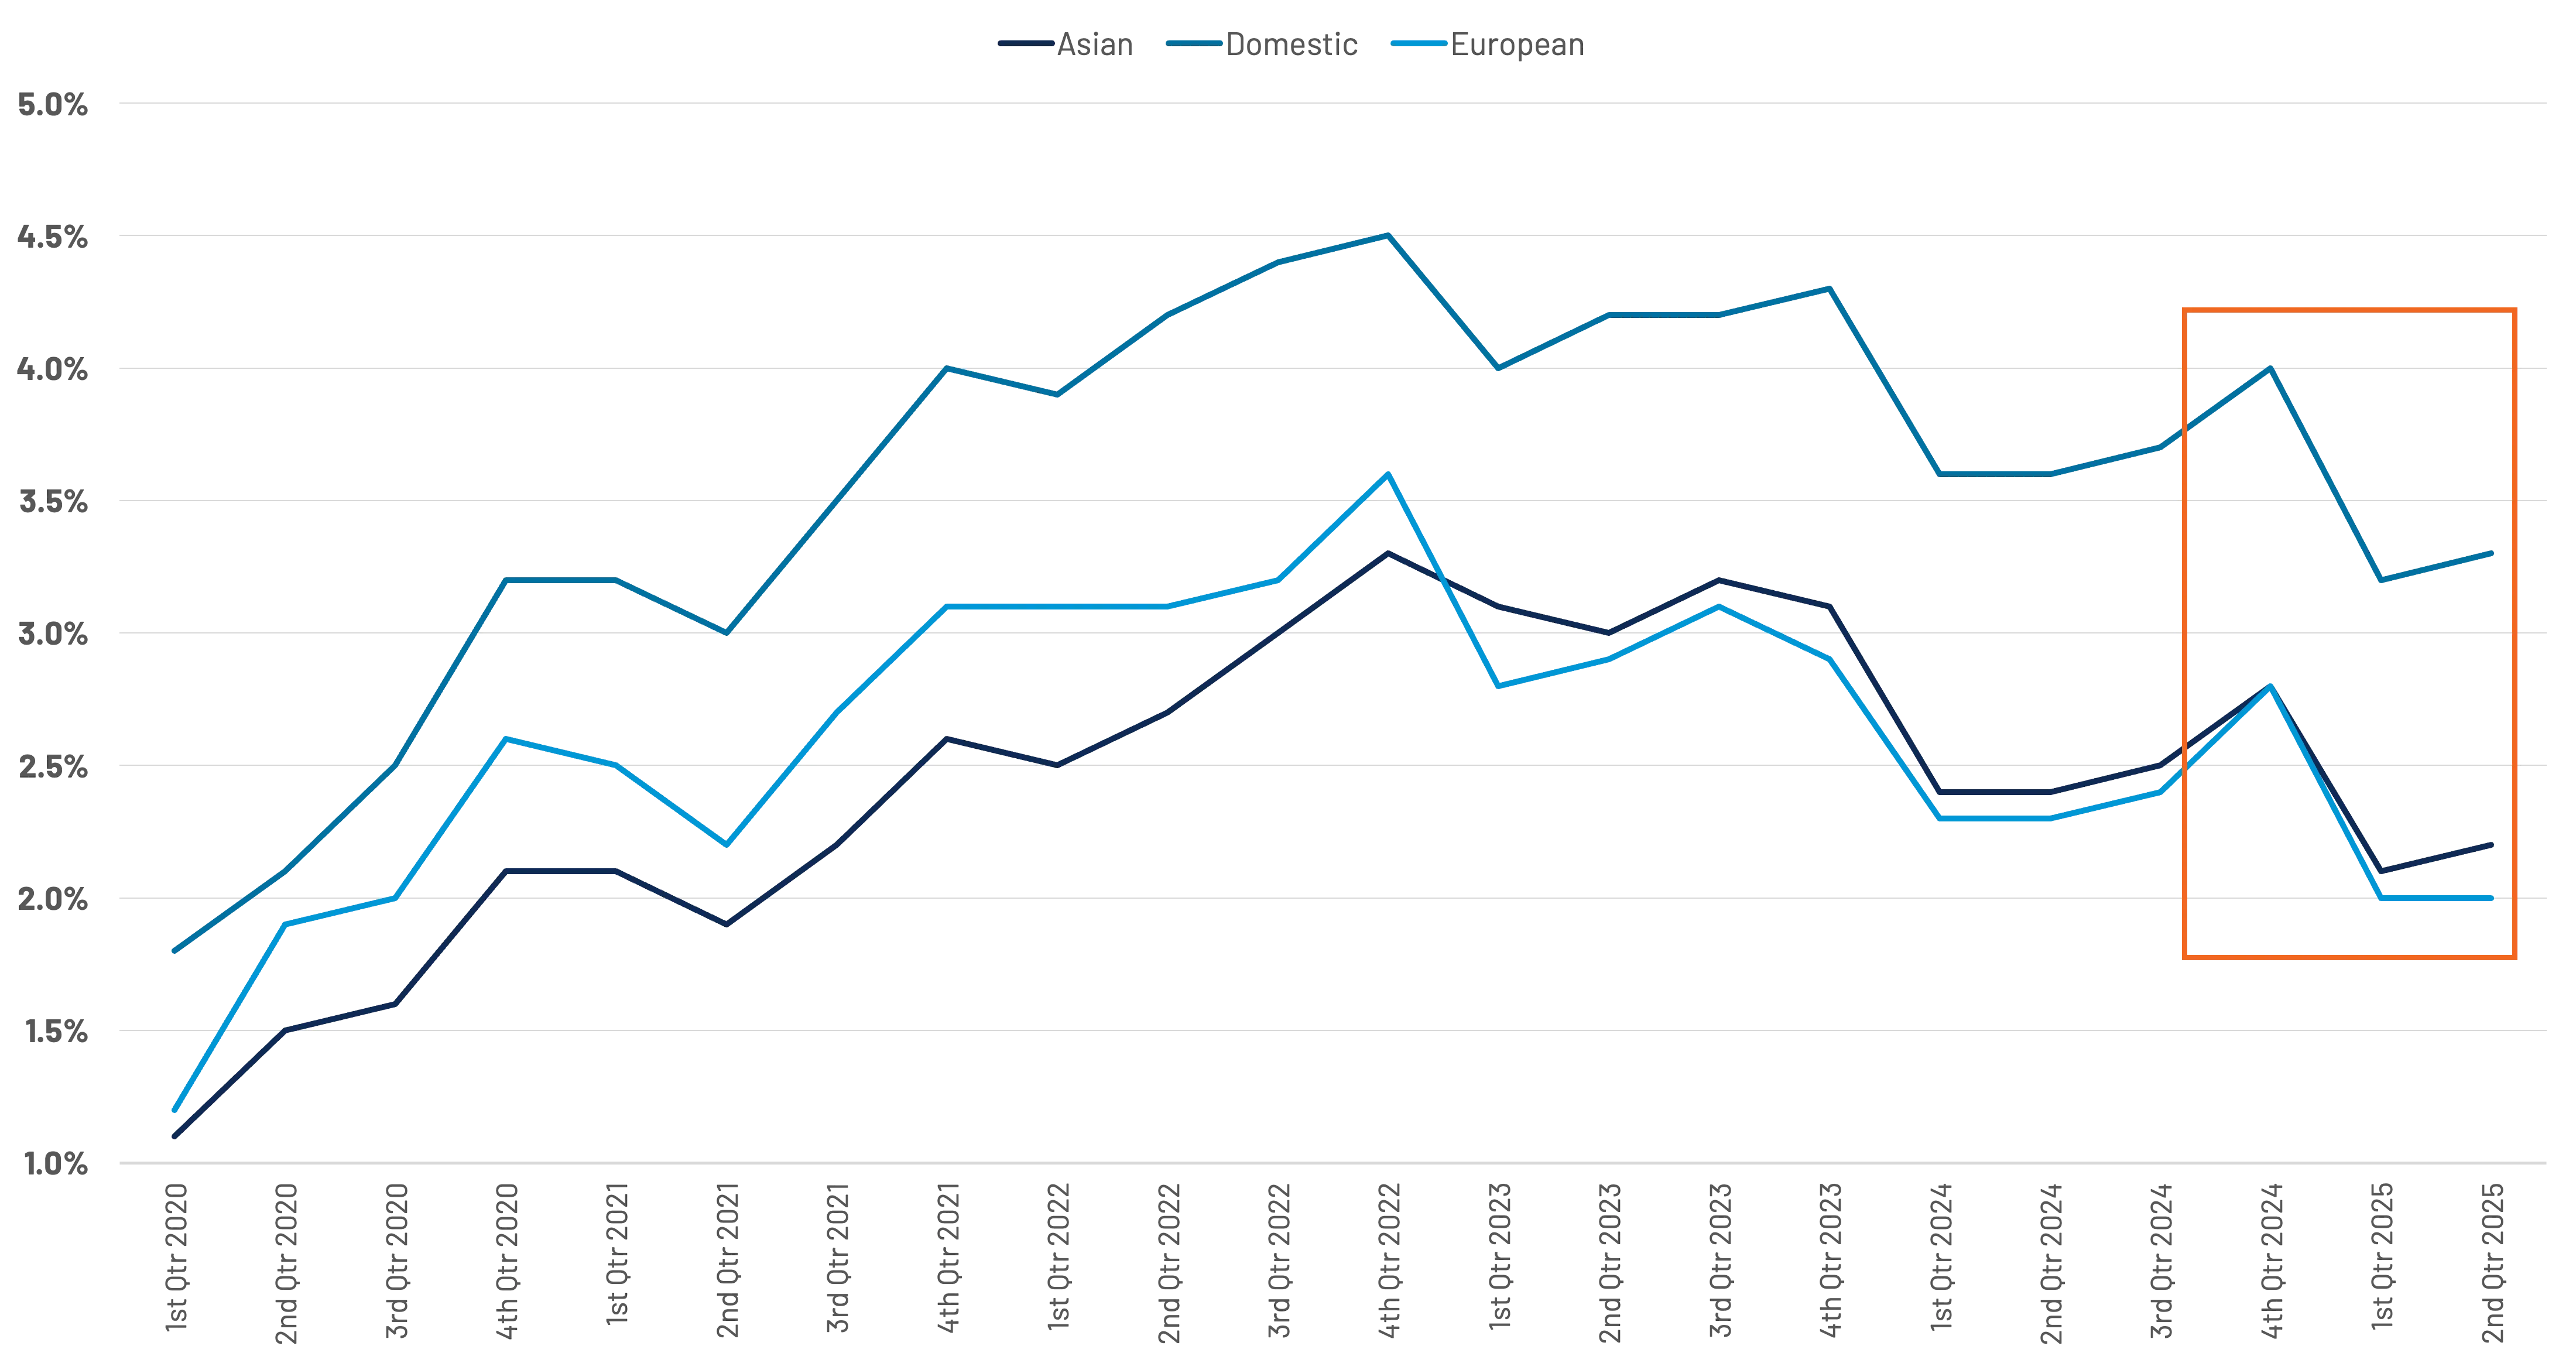
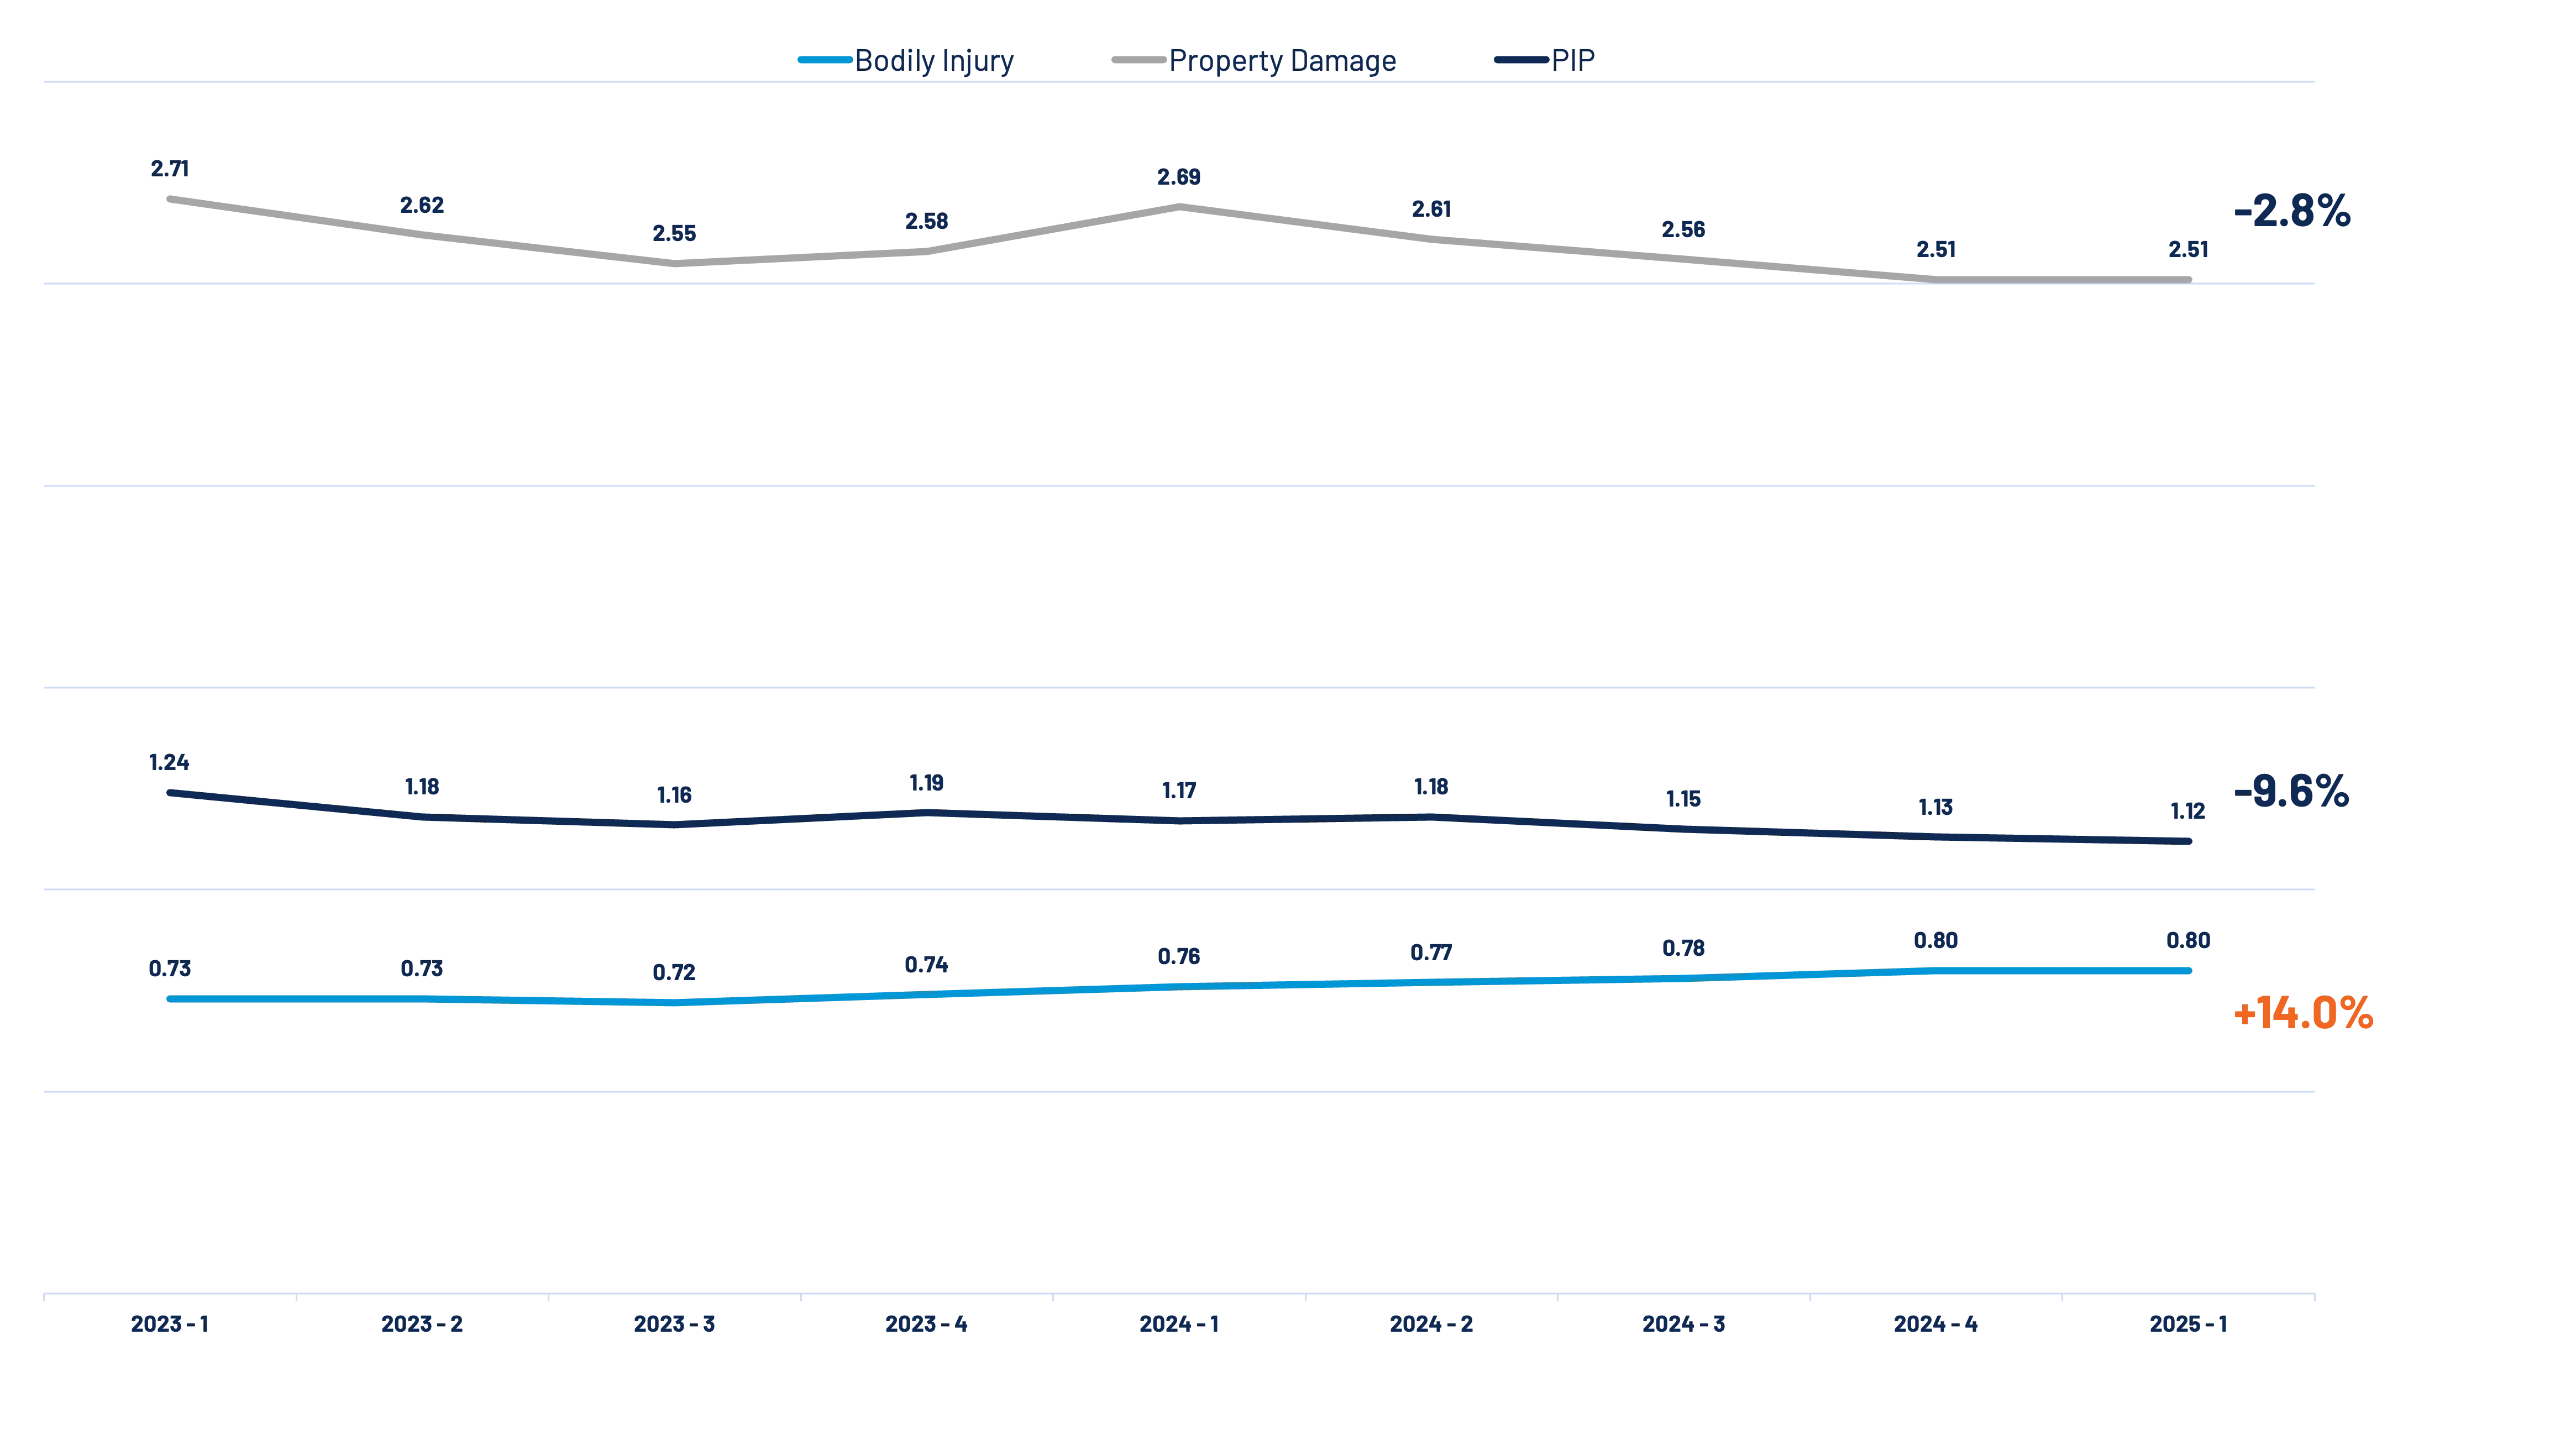
Bodily injury claim frequency has been increasing despite property damage and PIP claim frequency decreasing over the last 2 years. (Figure 1)
Average 3rd party bodily injury paid outcome is now $28.7K per injured party, which represents a 7% increase since Q1 2024 and a 35% increase since Q1 2021. (Figure 2)

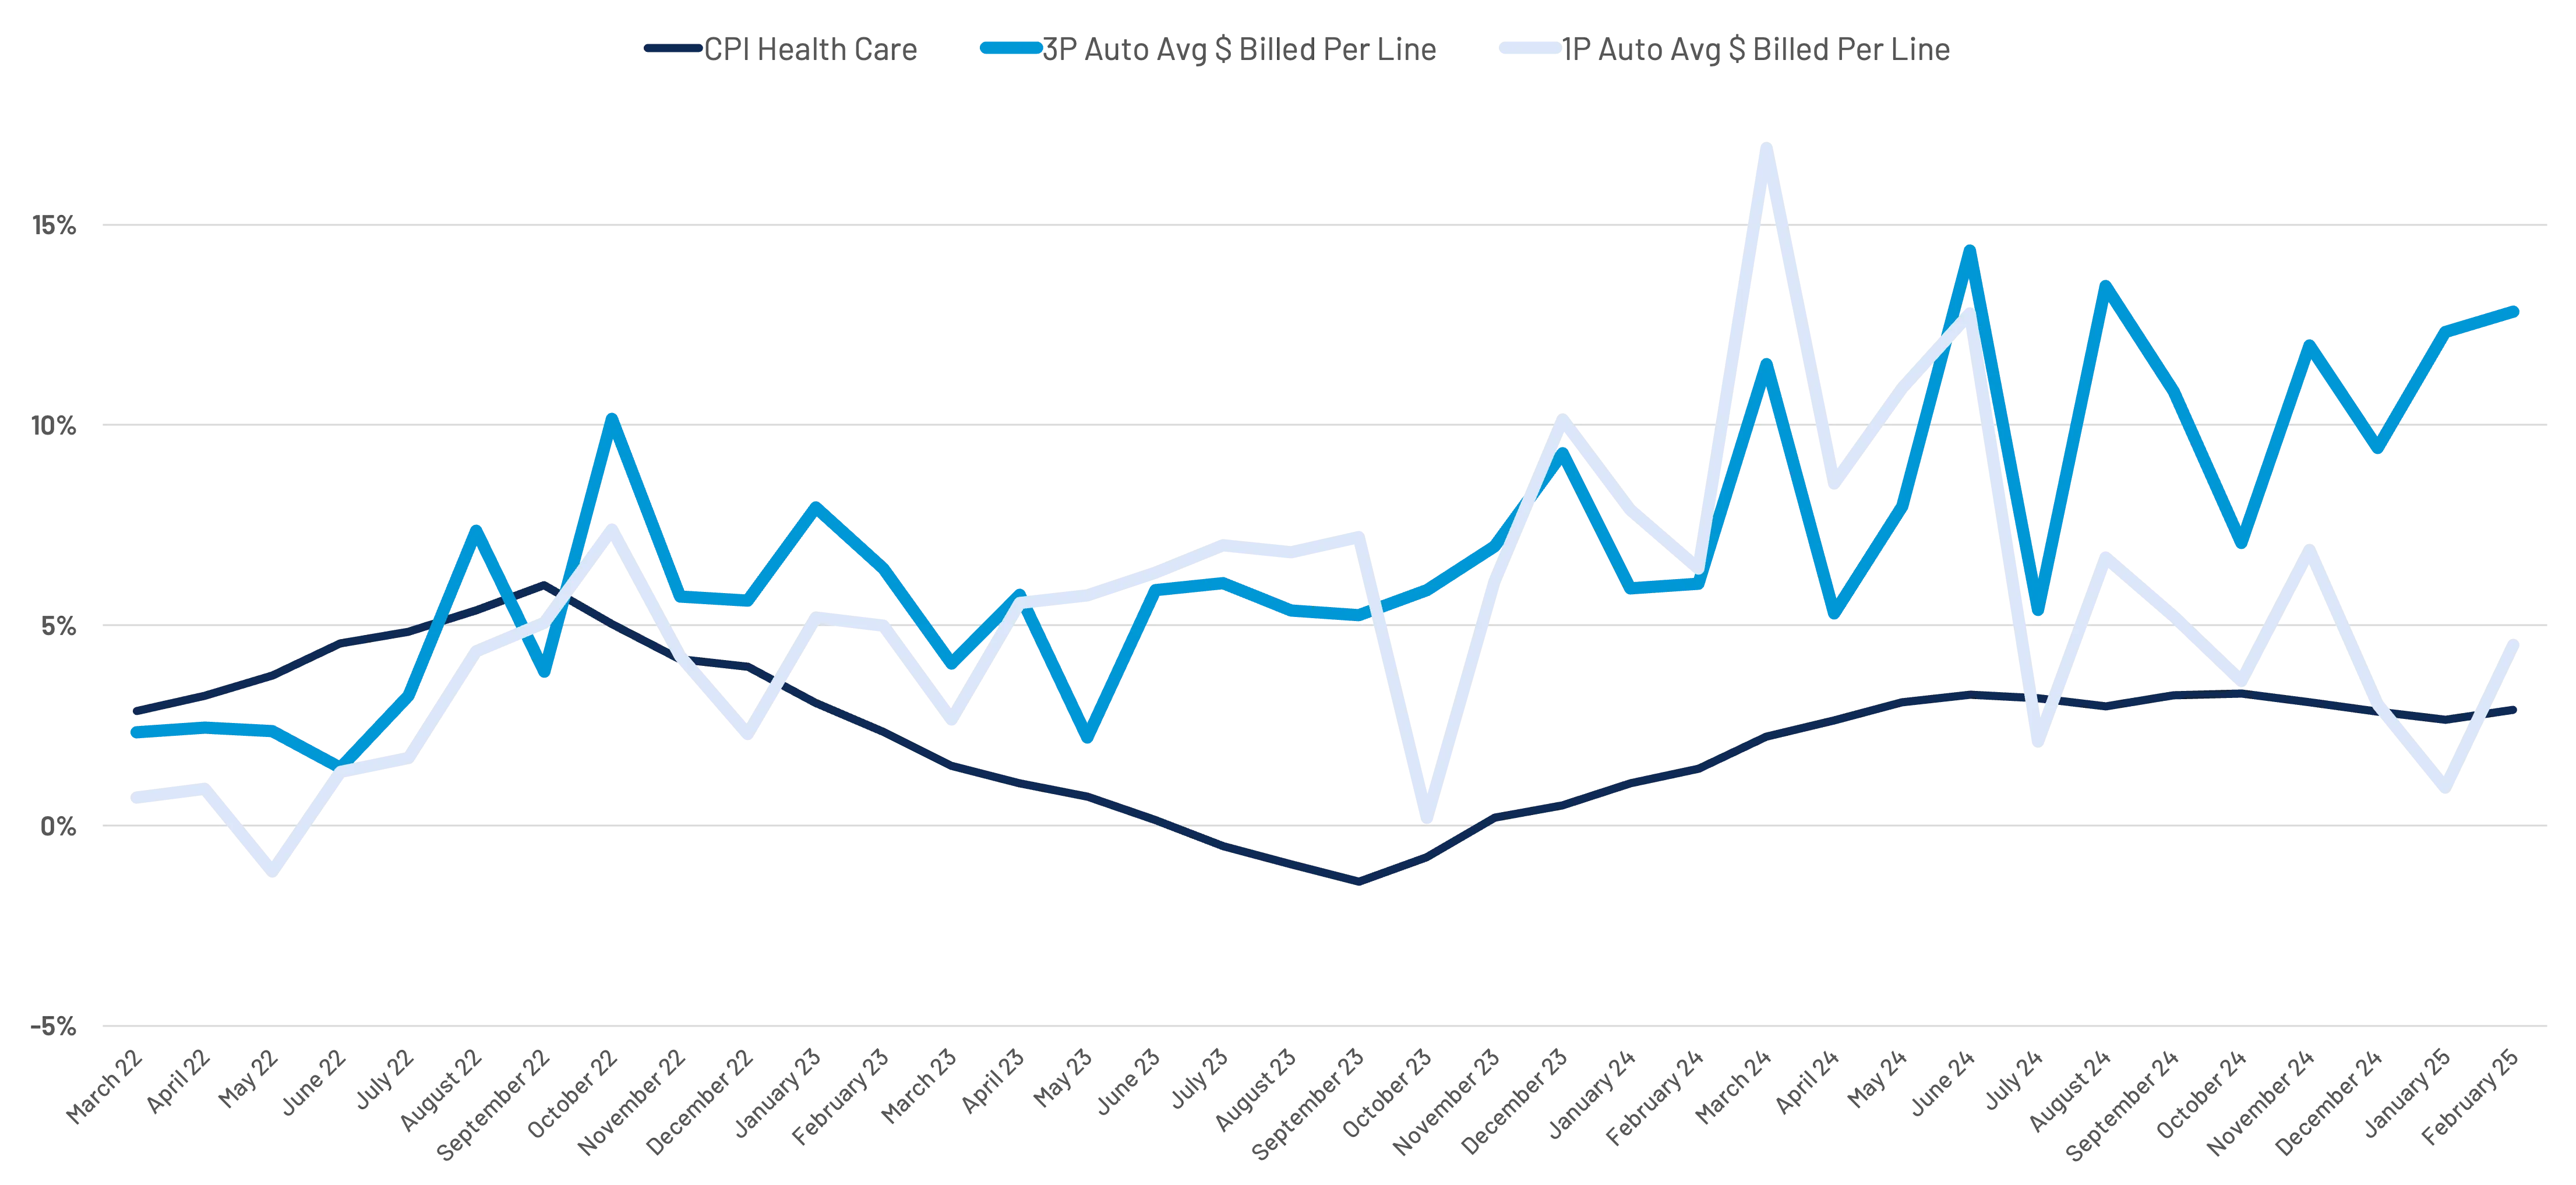
Third Party Auto Medical Billing inflation rates continue to outpace Consumer Price Index for Health Care, while First Party Medical Billing inflation rates are moving closer to CPI. (Figure 3)
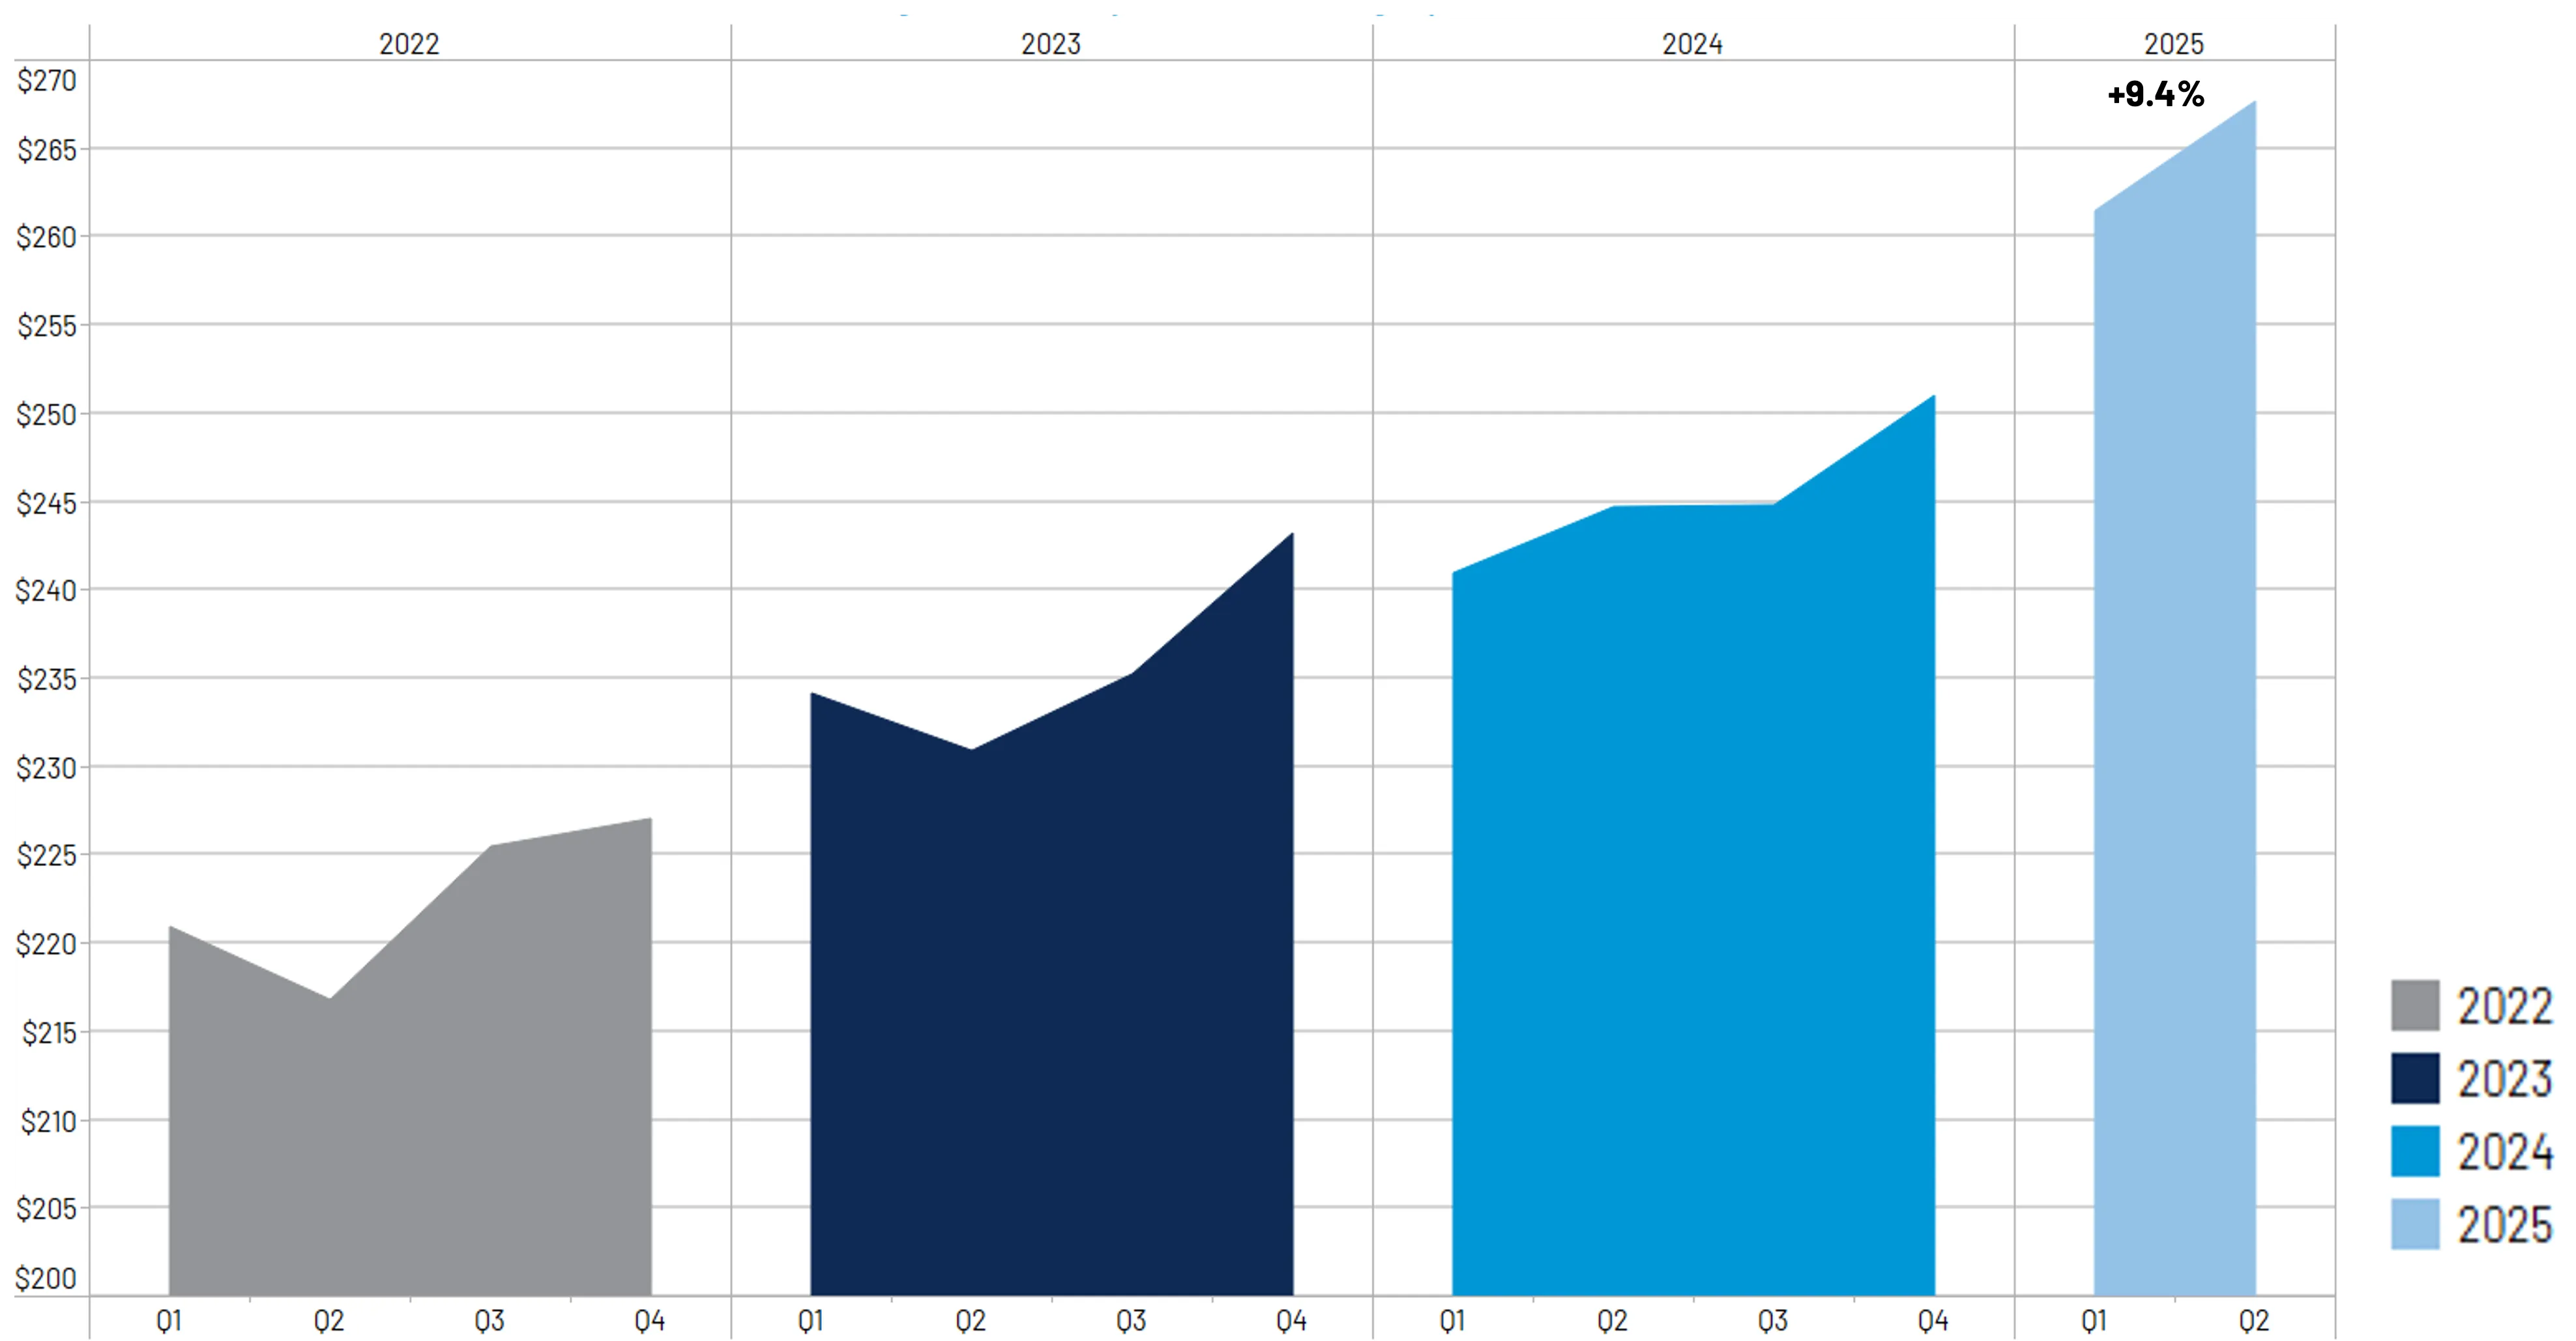
Third party bill line severity has increased 9.4% since Q2 2024. (Figure 4)
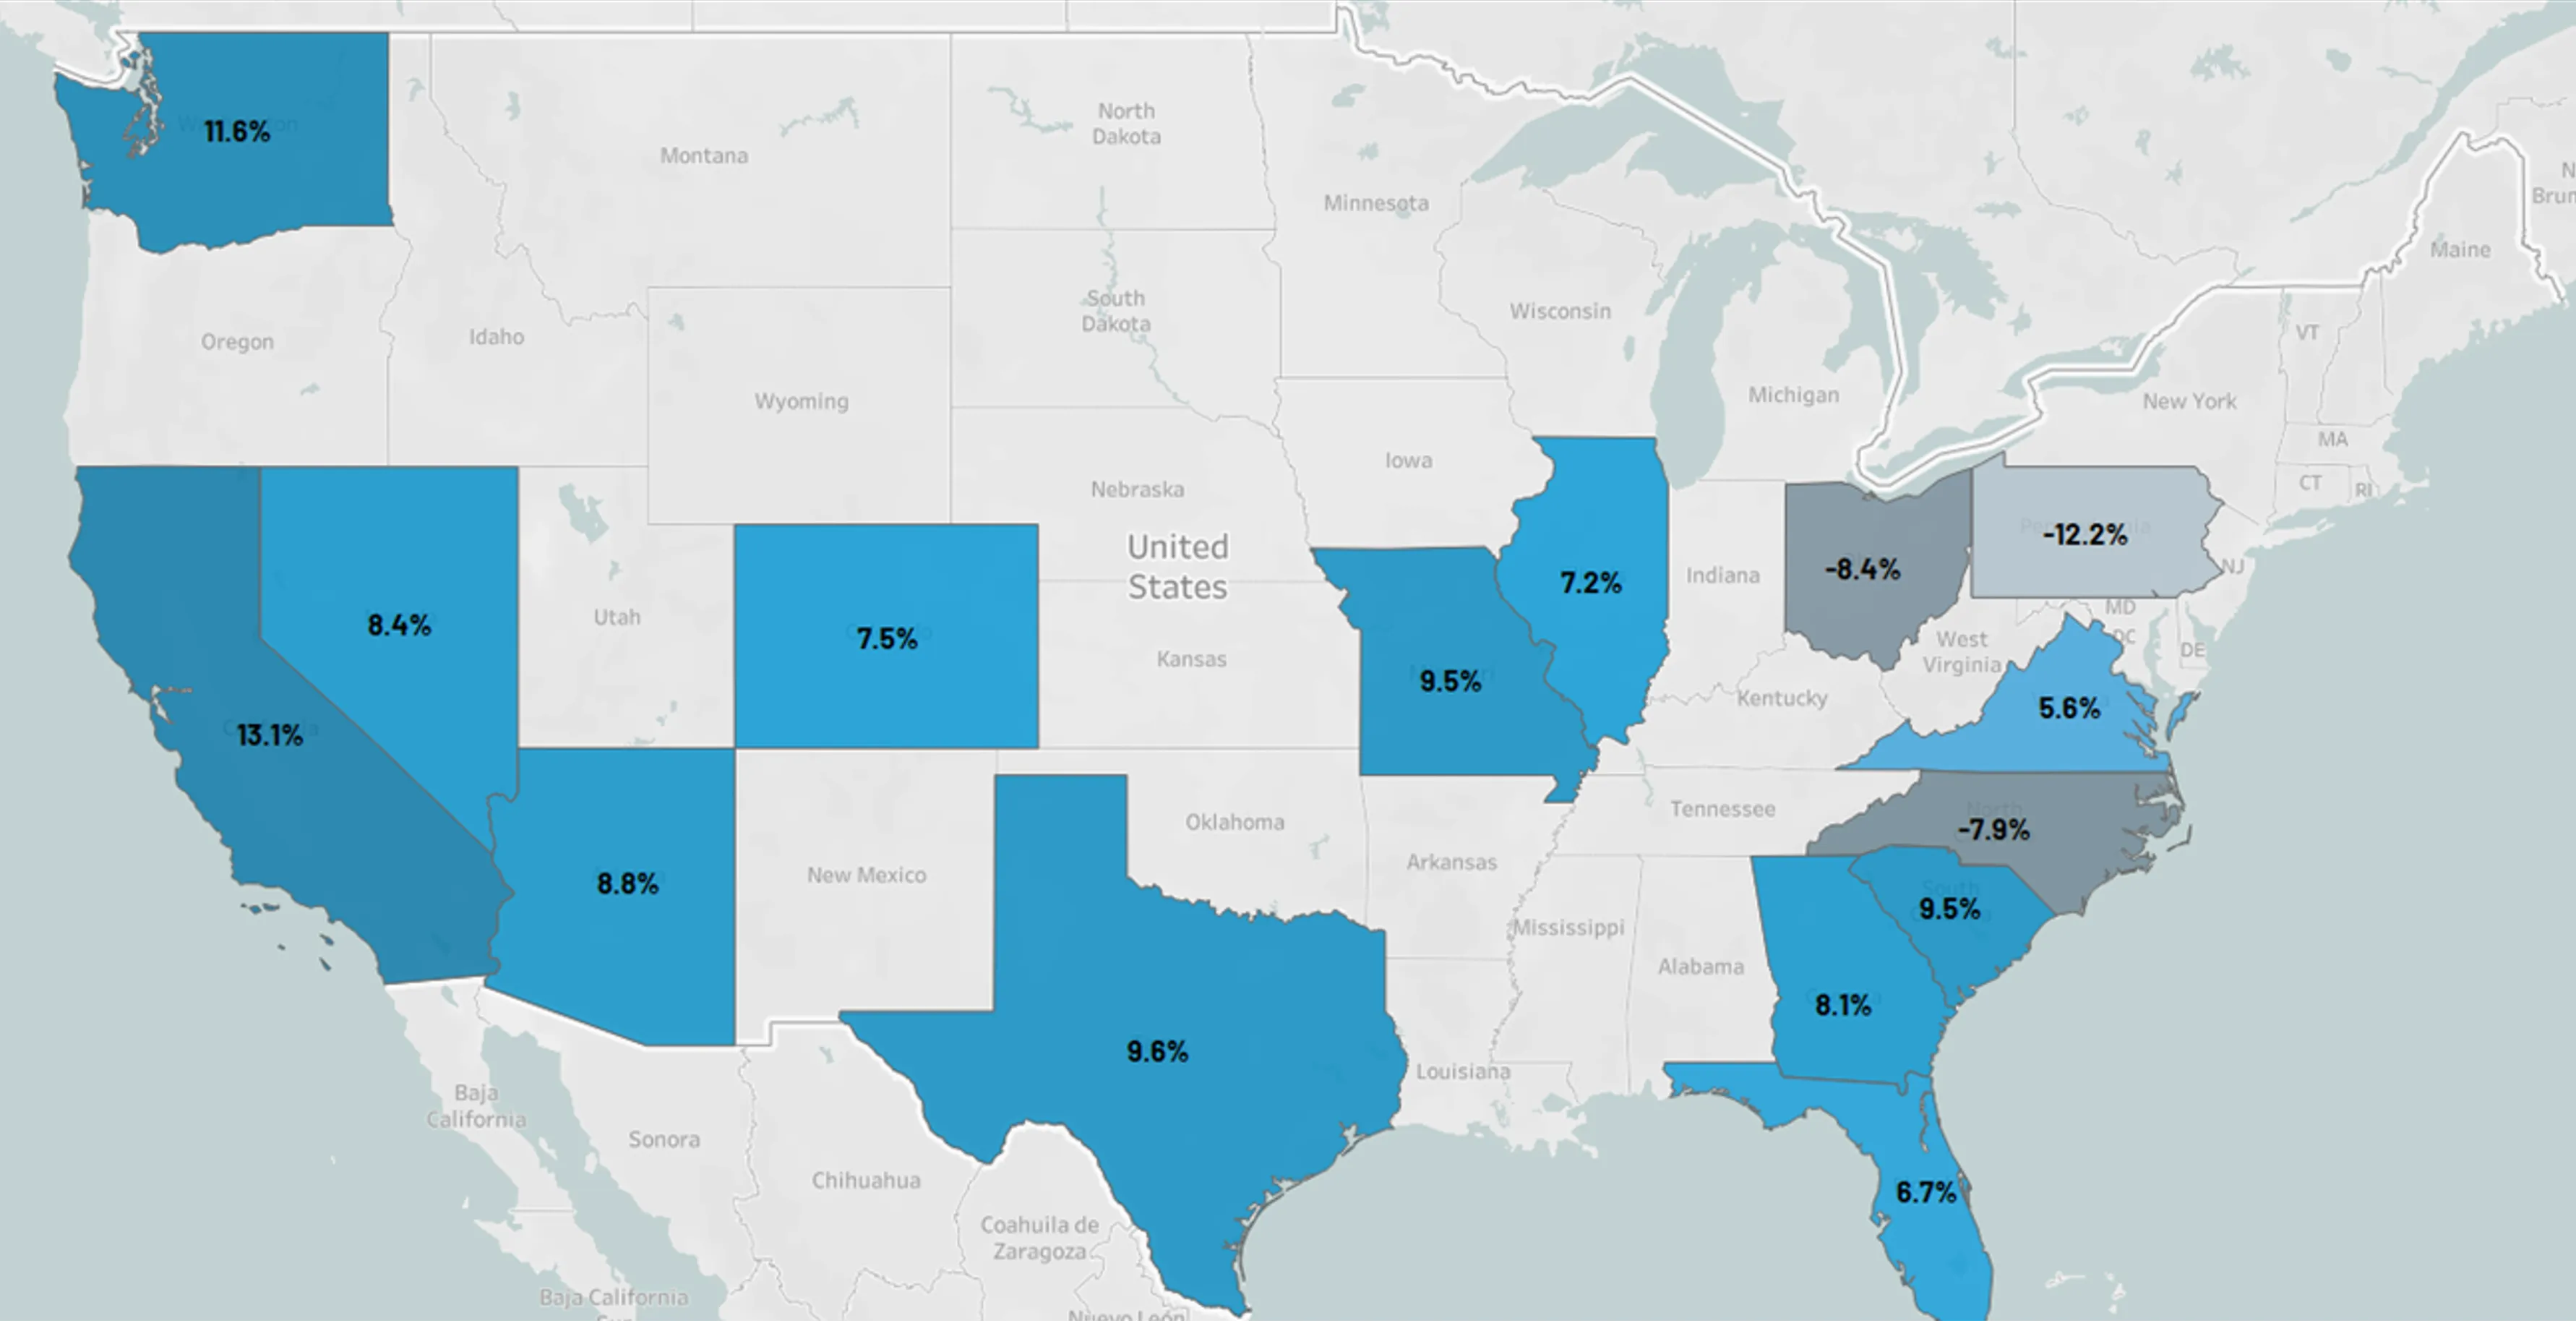
The largest severity increases in key volume states since H1 2024 have occurred in California, Washington, Texas, Missouri, and South Carolina. (Figure 5)
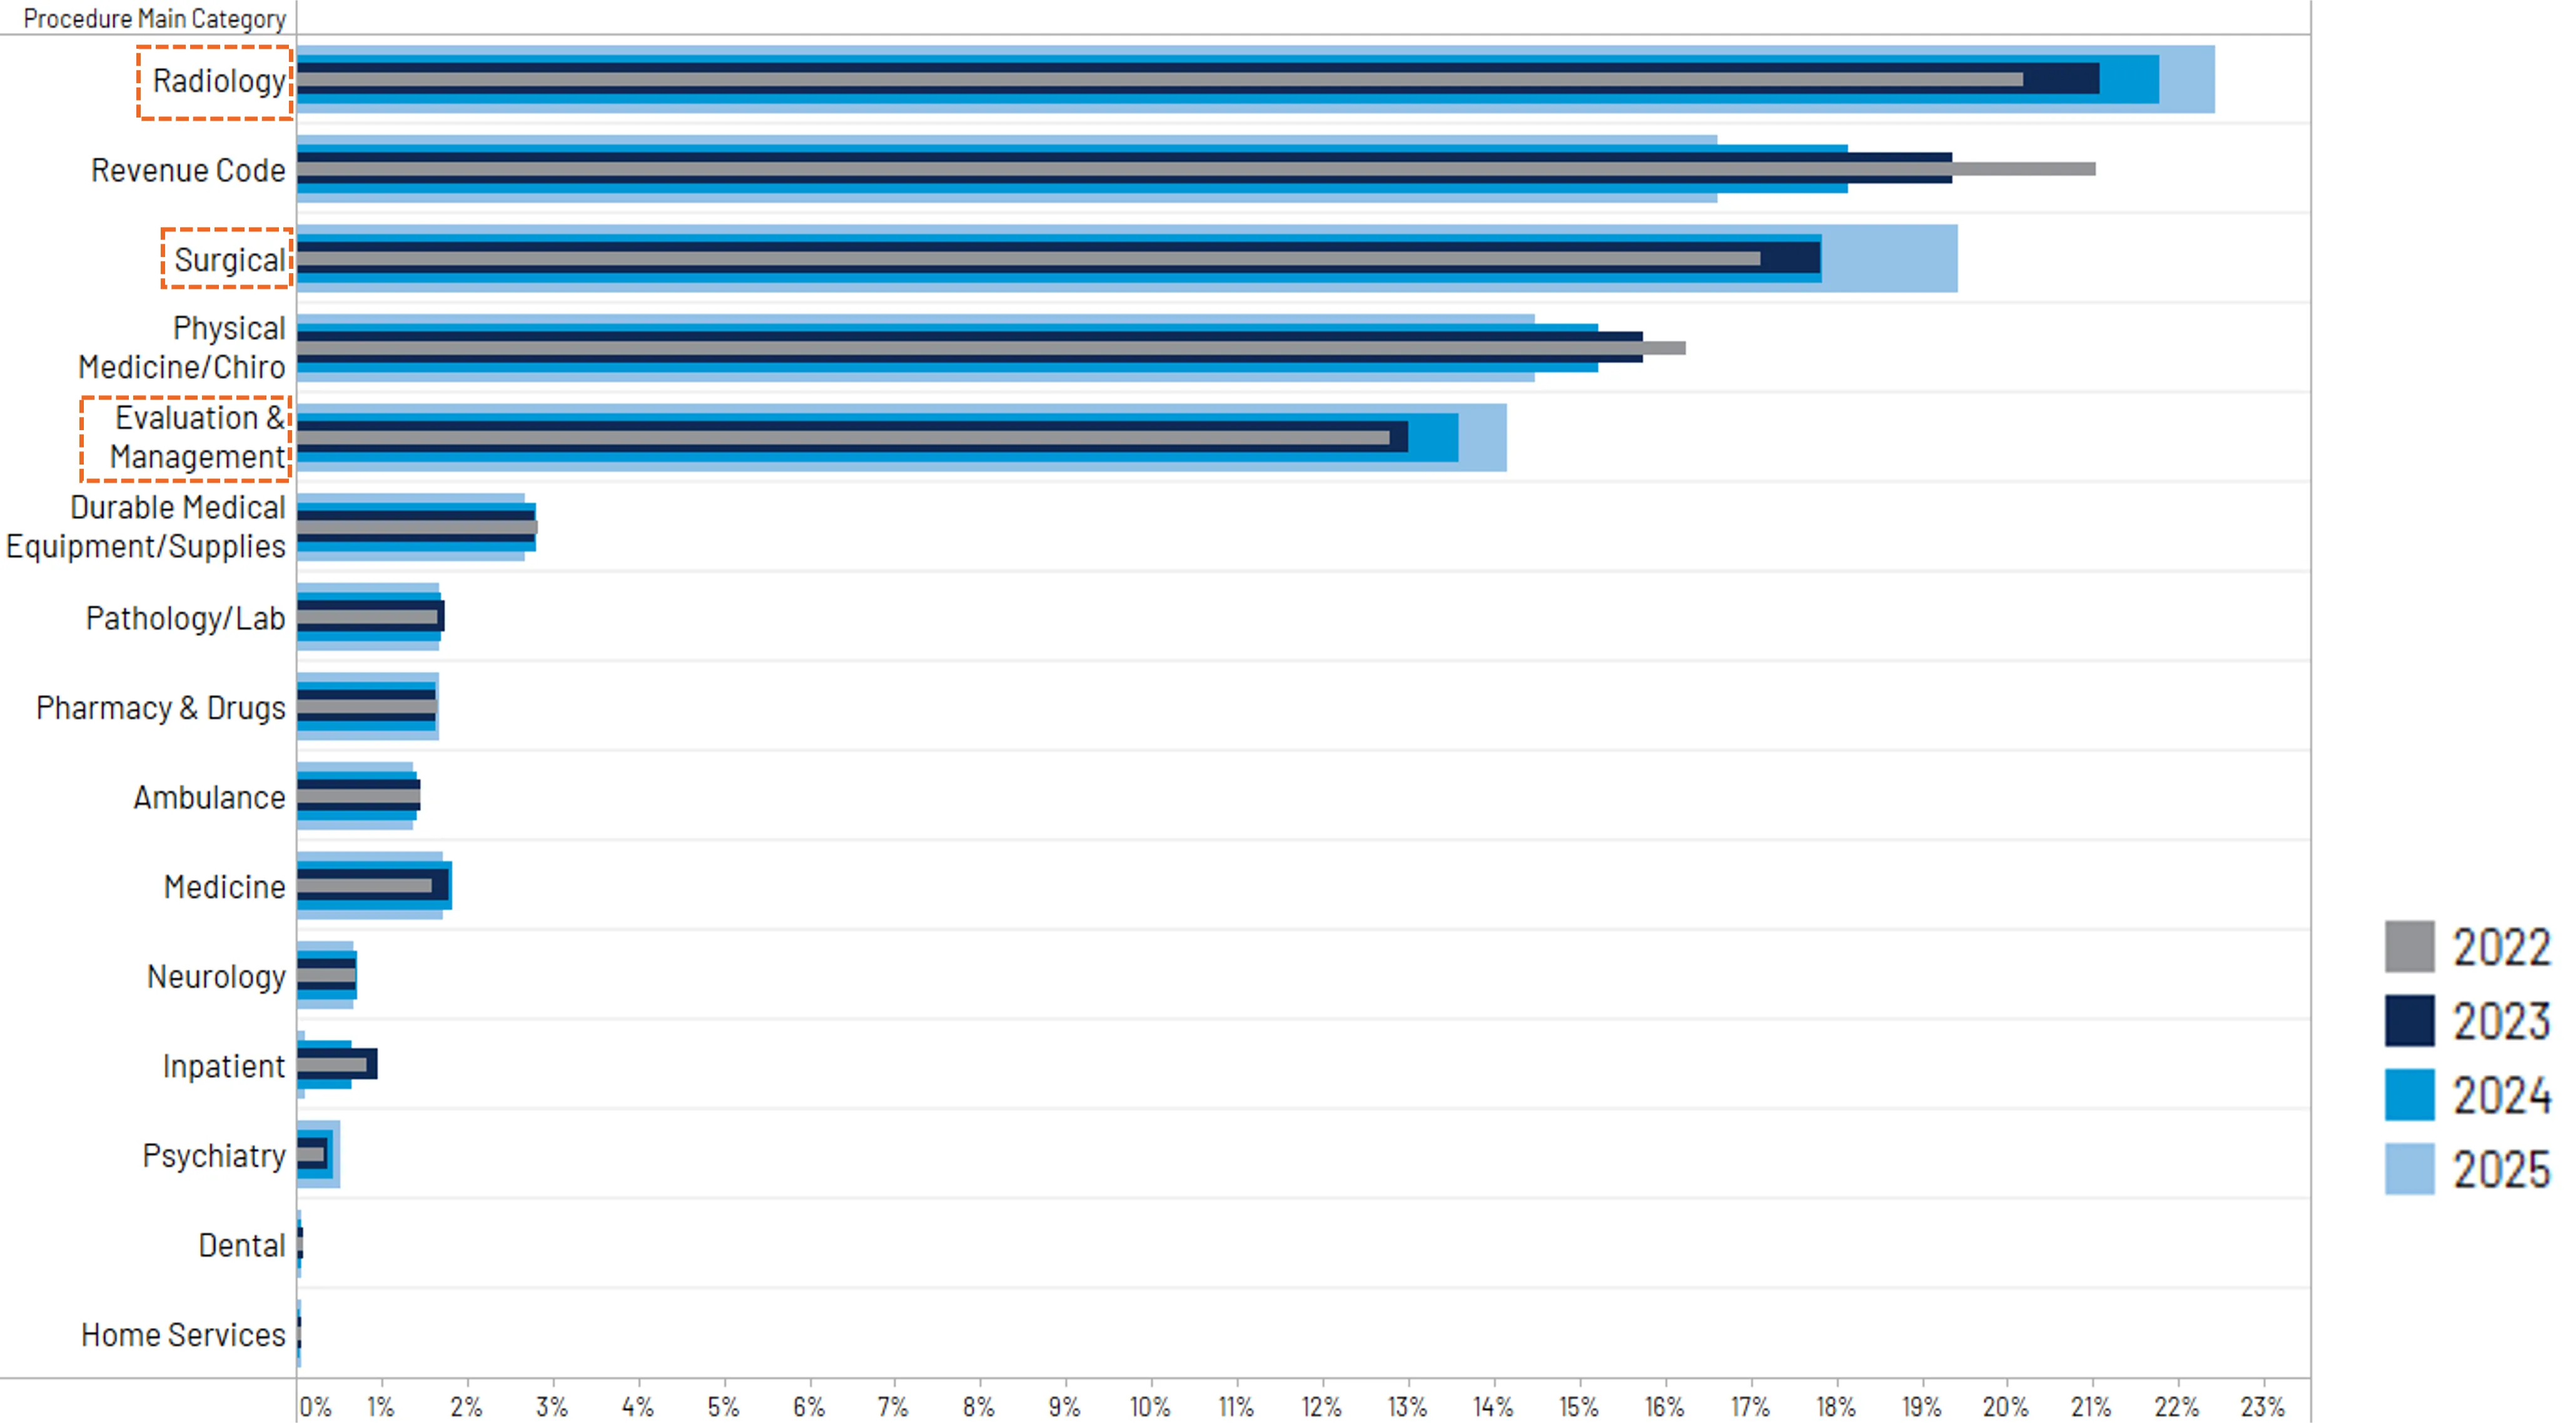
Distribution of procedure dollars shows increases in Radiology, Evaluation & Management, &Surgical as of H1 2025. (Figure 6)
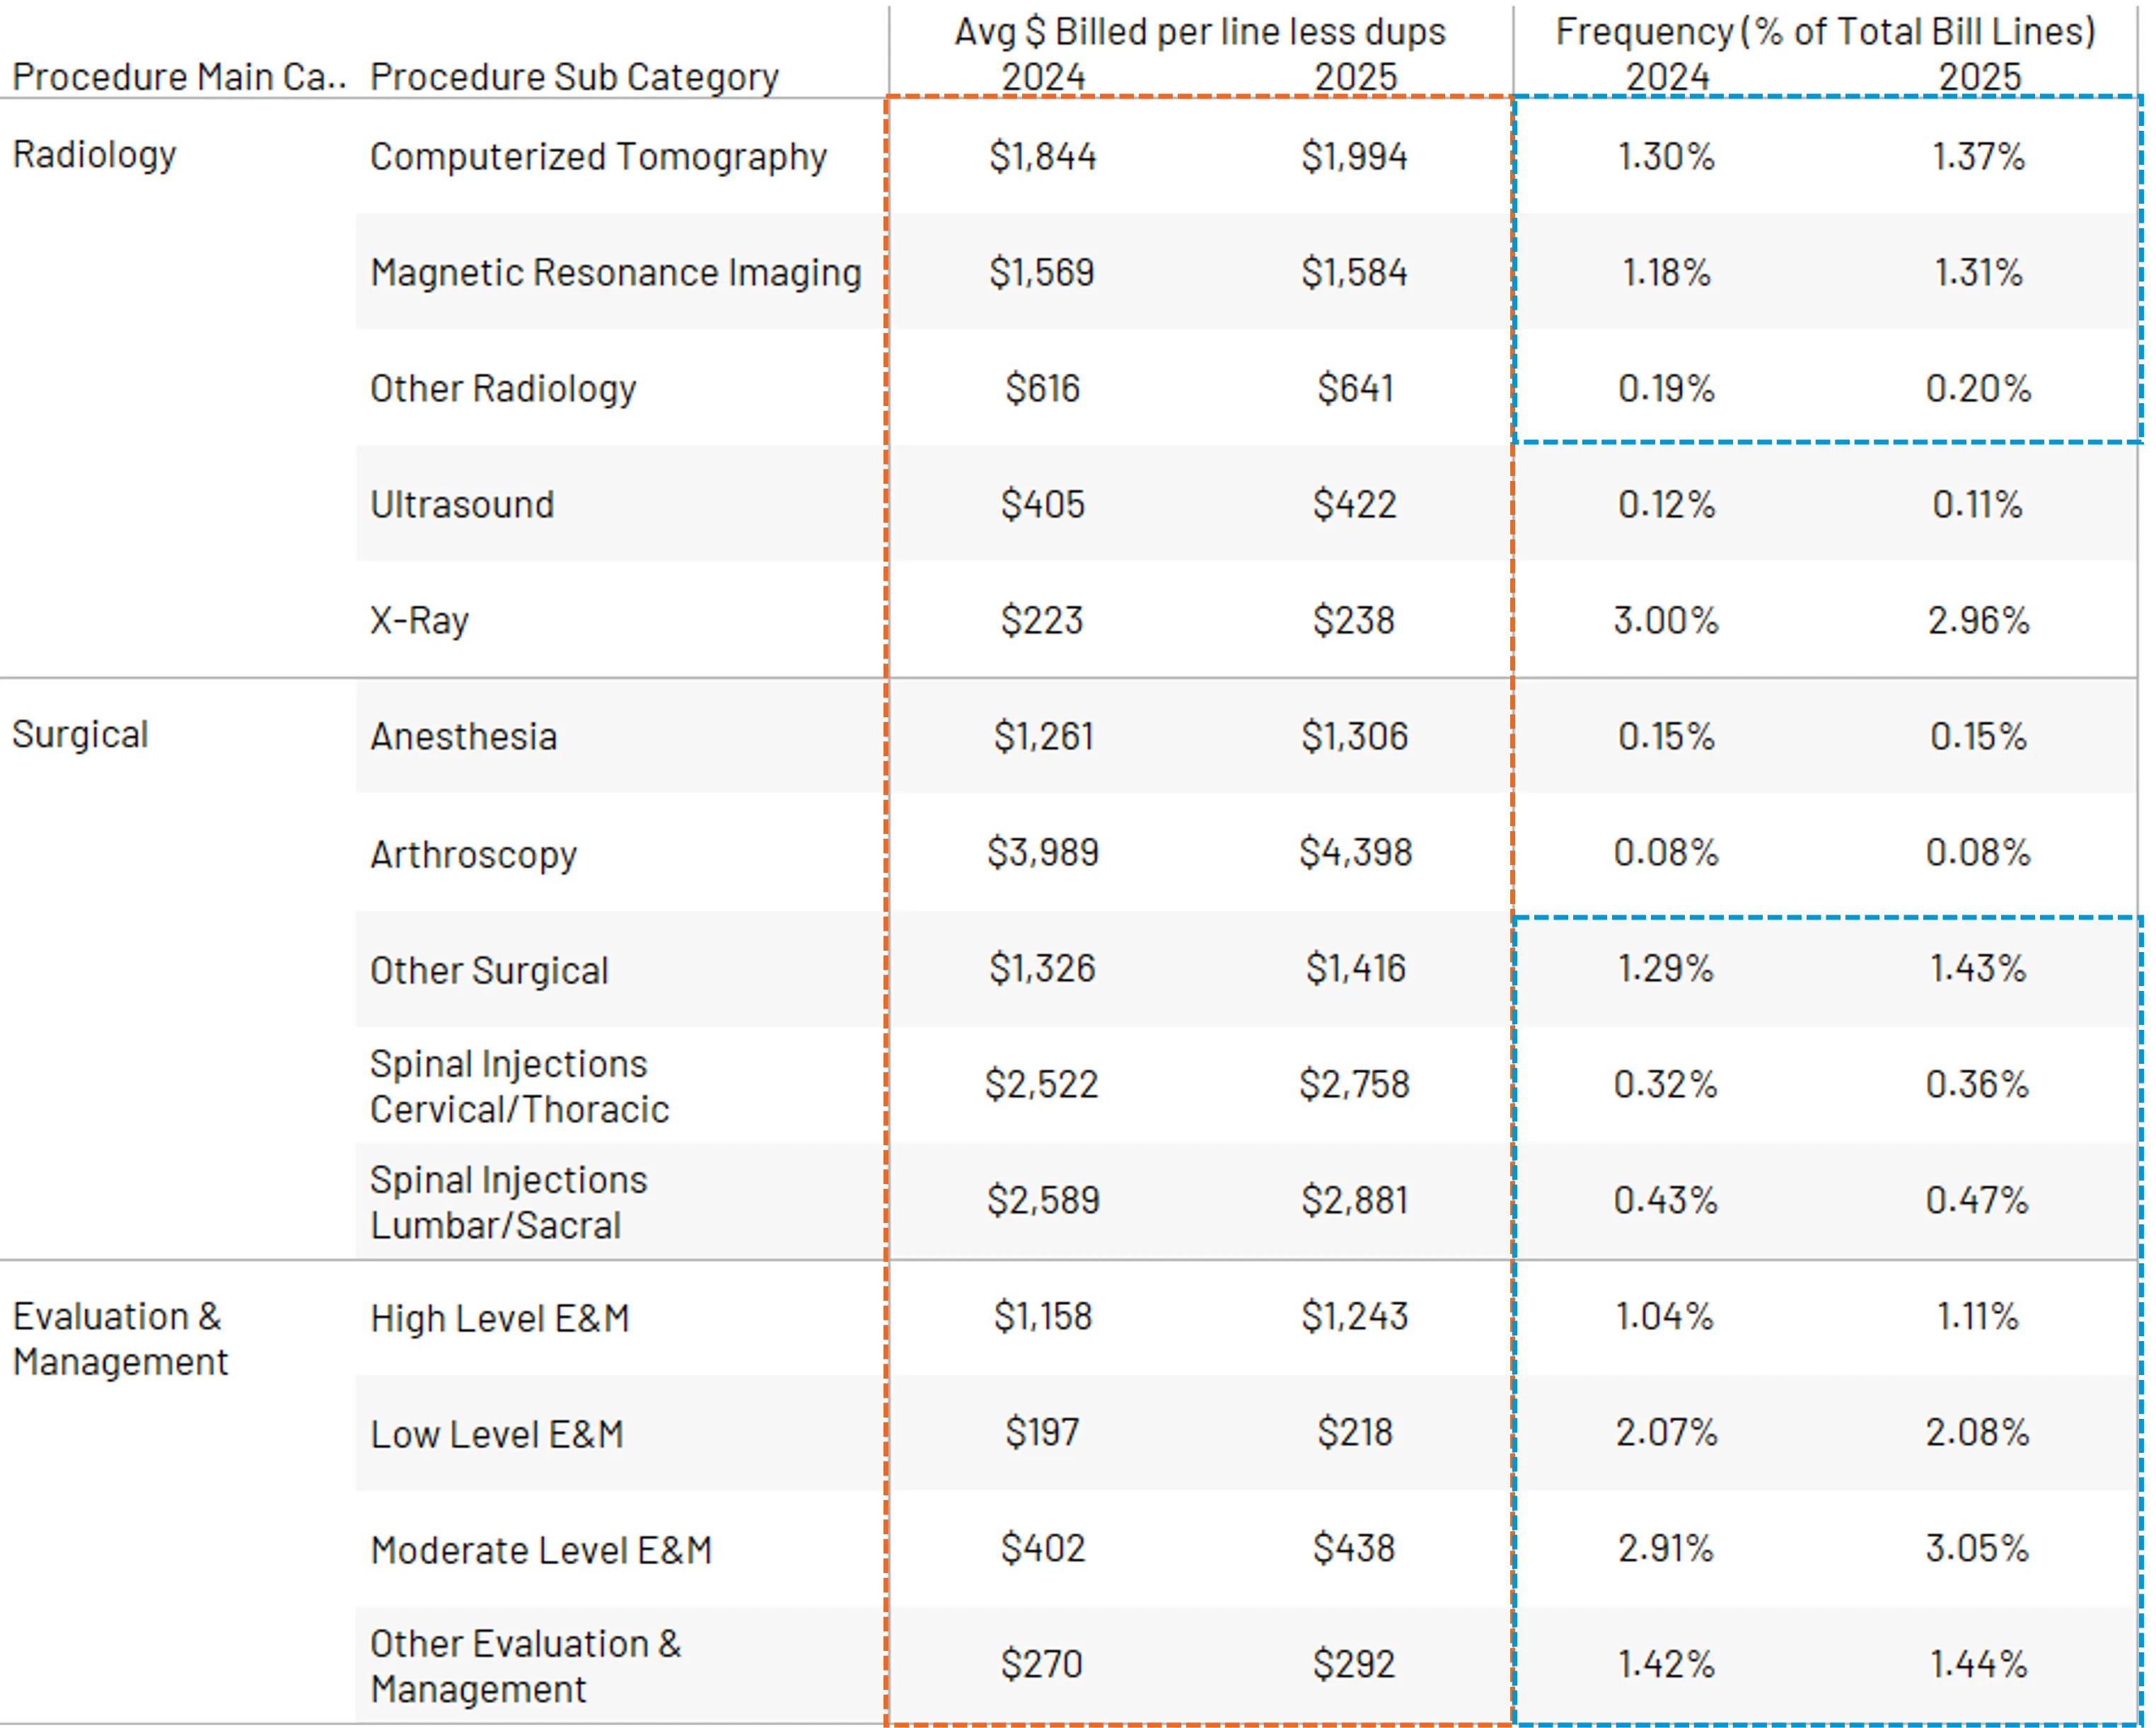
Drilling further into procedure category gains, price increases occurred in all subcategories, with bill frequency increases also occurring for CT Scans, MRIs, Surgeries, Injections, and Eval & Management. (Figure 7)
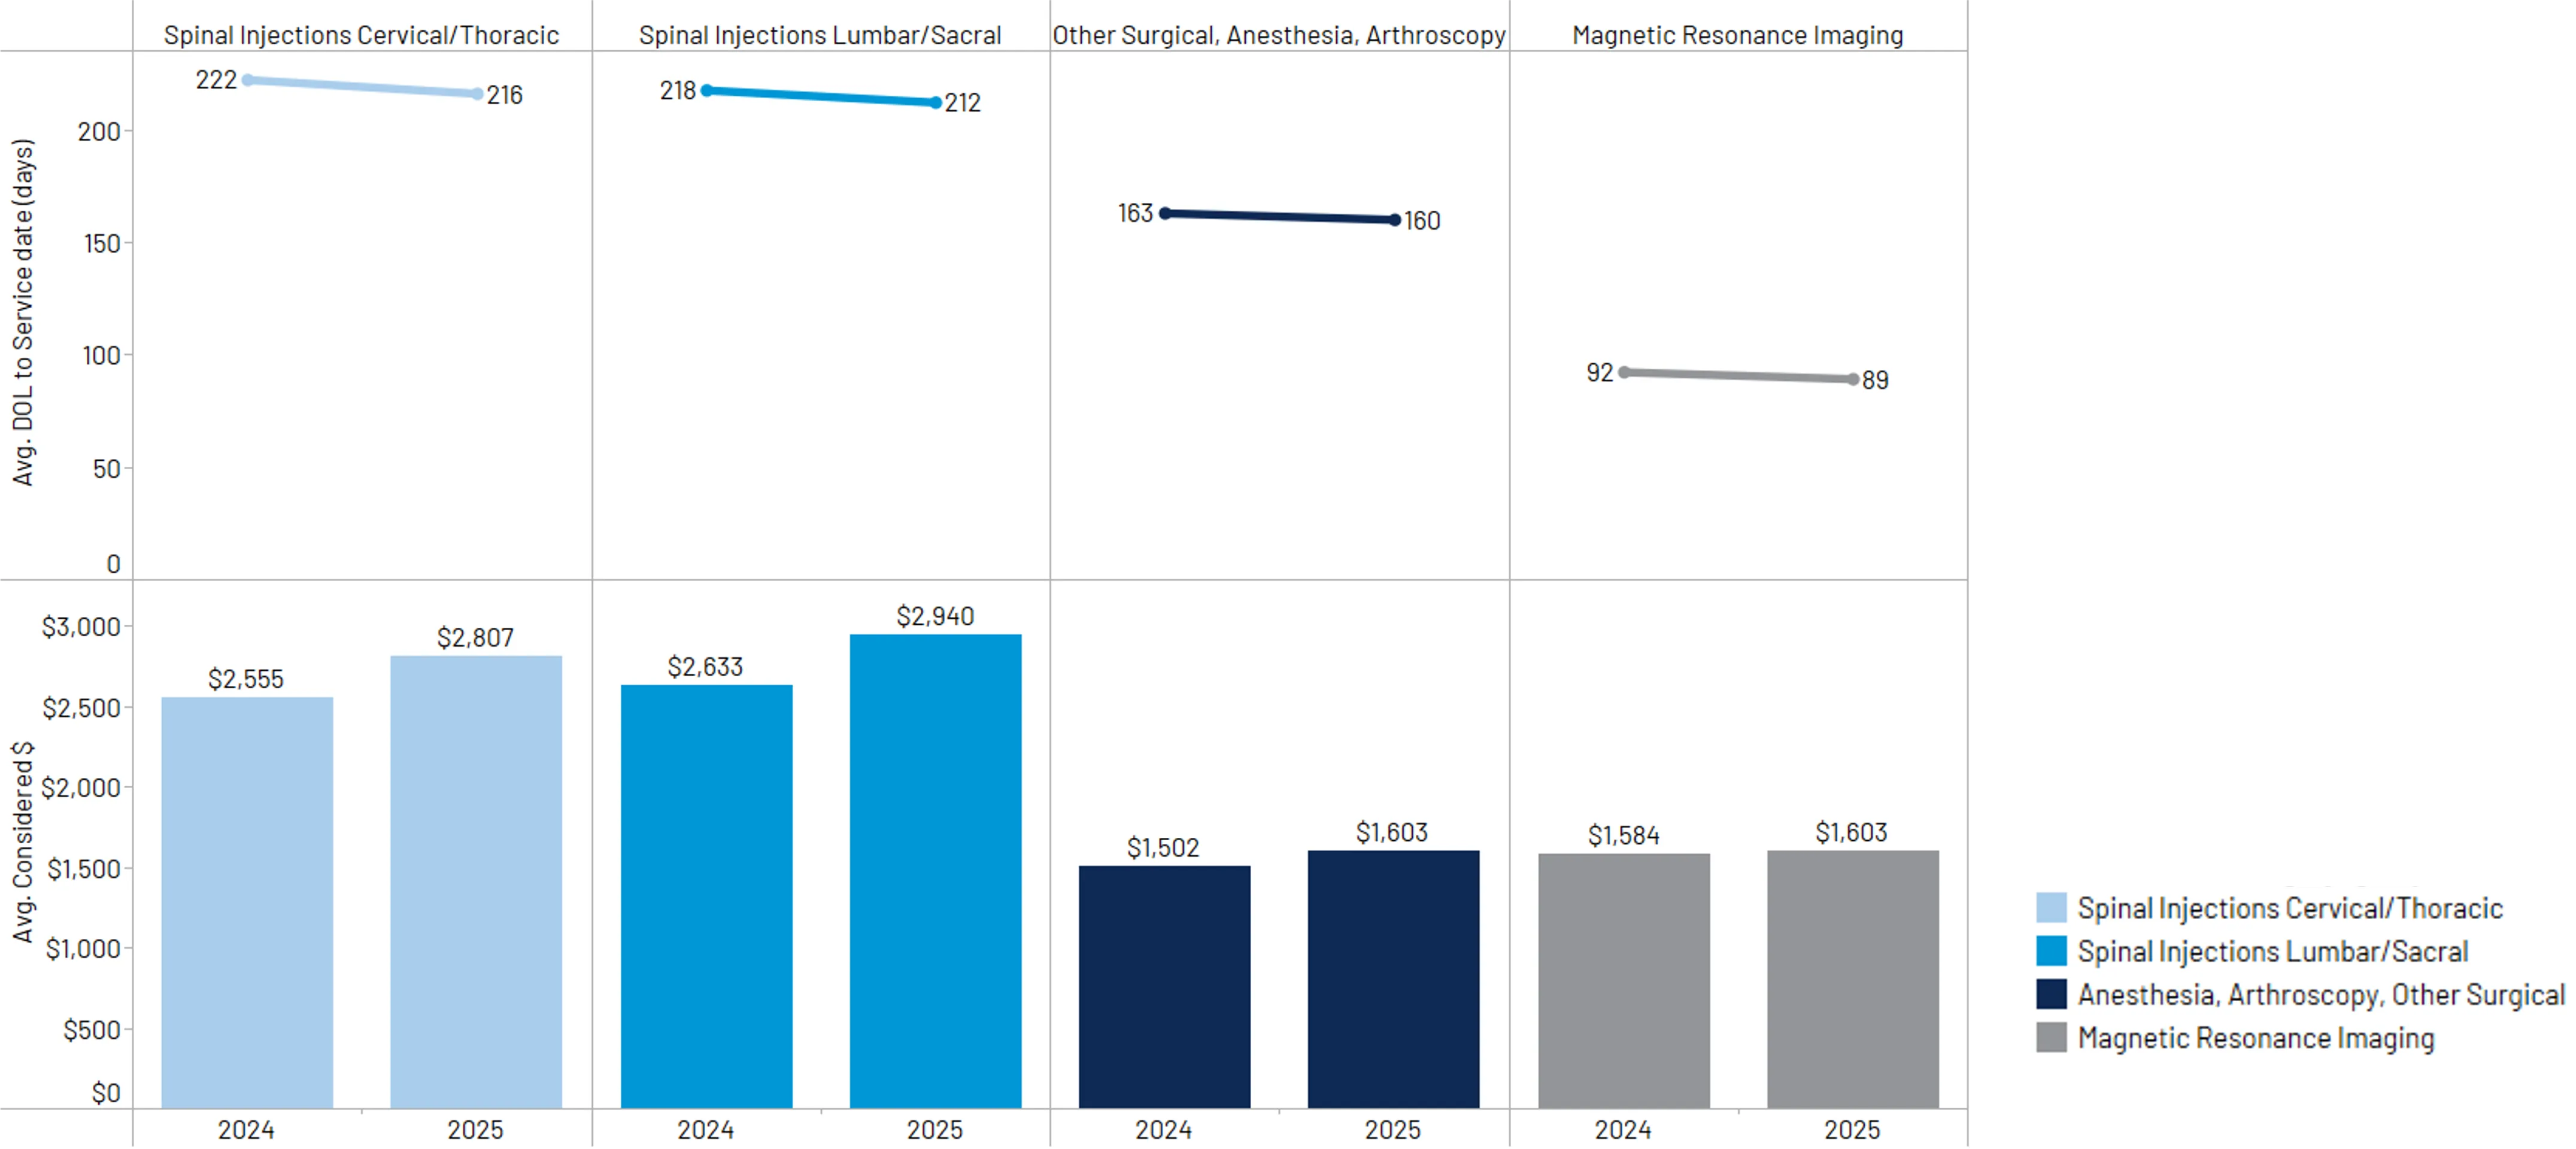
Average days between date of loss and treatment continues to decrease for outpatient surgery and diagnostic procedures, with notable cost increases on those same procedures. (Figure 8)
Despite cost increases, treatment complexity has remained static over the last few years. (Figure 9)
PRP procedures continue to increase rapidly in frequency. PRP code 0232T is now the 6th highest surgical procedure by total $ billed. The average claimant has three separate PRP procedures. (Figures 10 & 11)

The percentage of 3rd party claims submitted for injuries caused by an uninsured or underinsured motorist remains elevated. (Figure 12)
First Party Trends
PIP claim paid outcome per injured party has increased 10% since Q1 2024. (Figure 13)
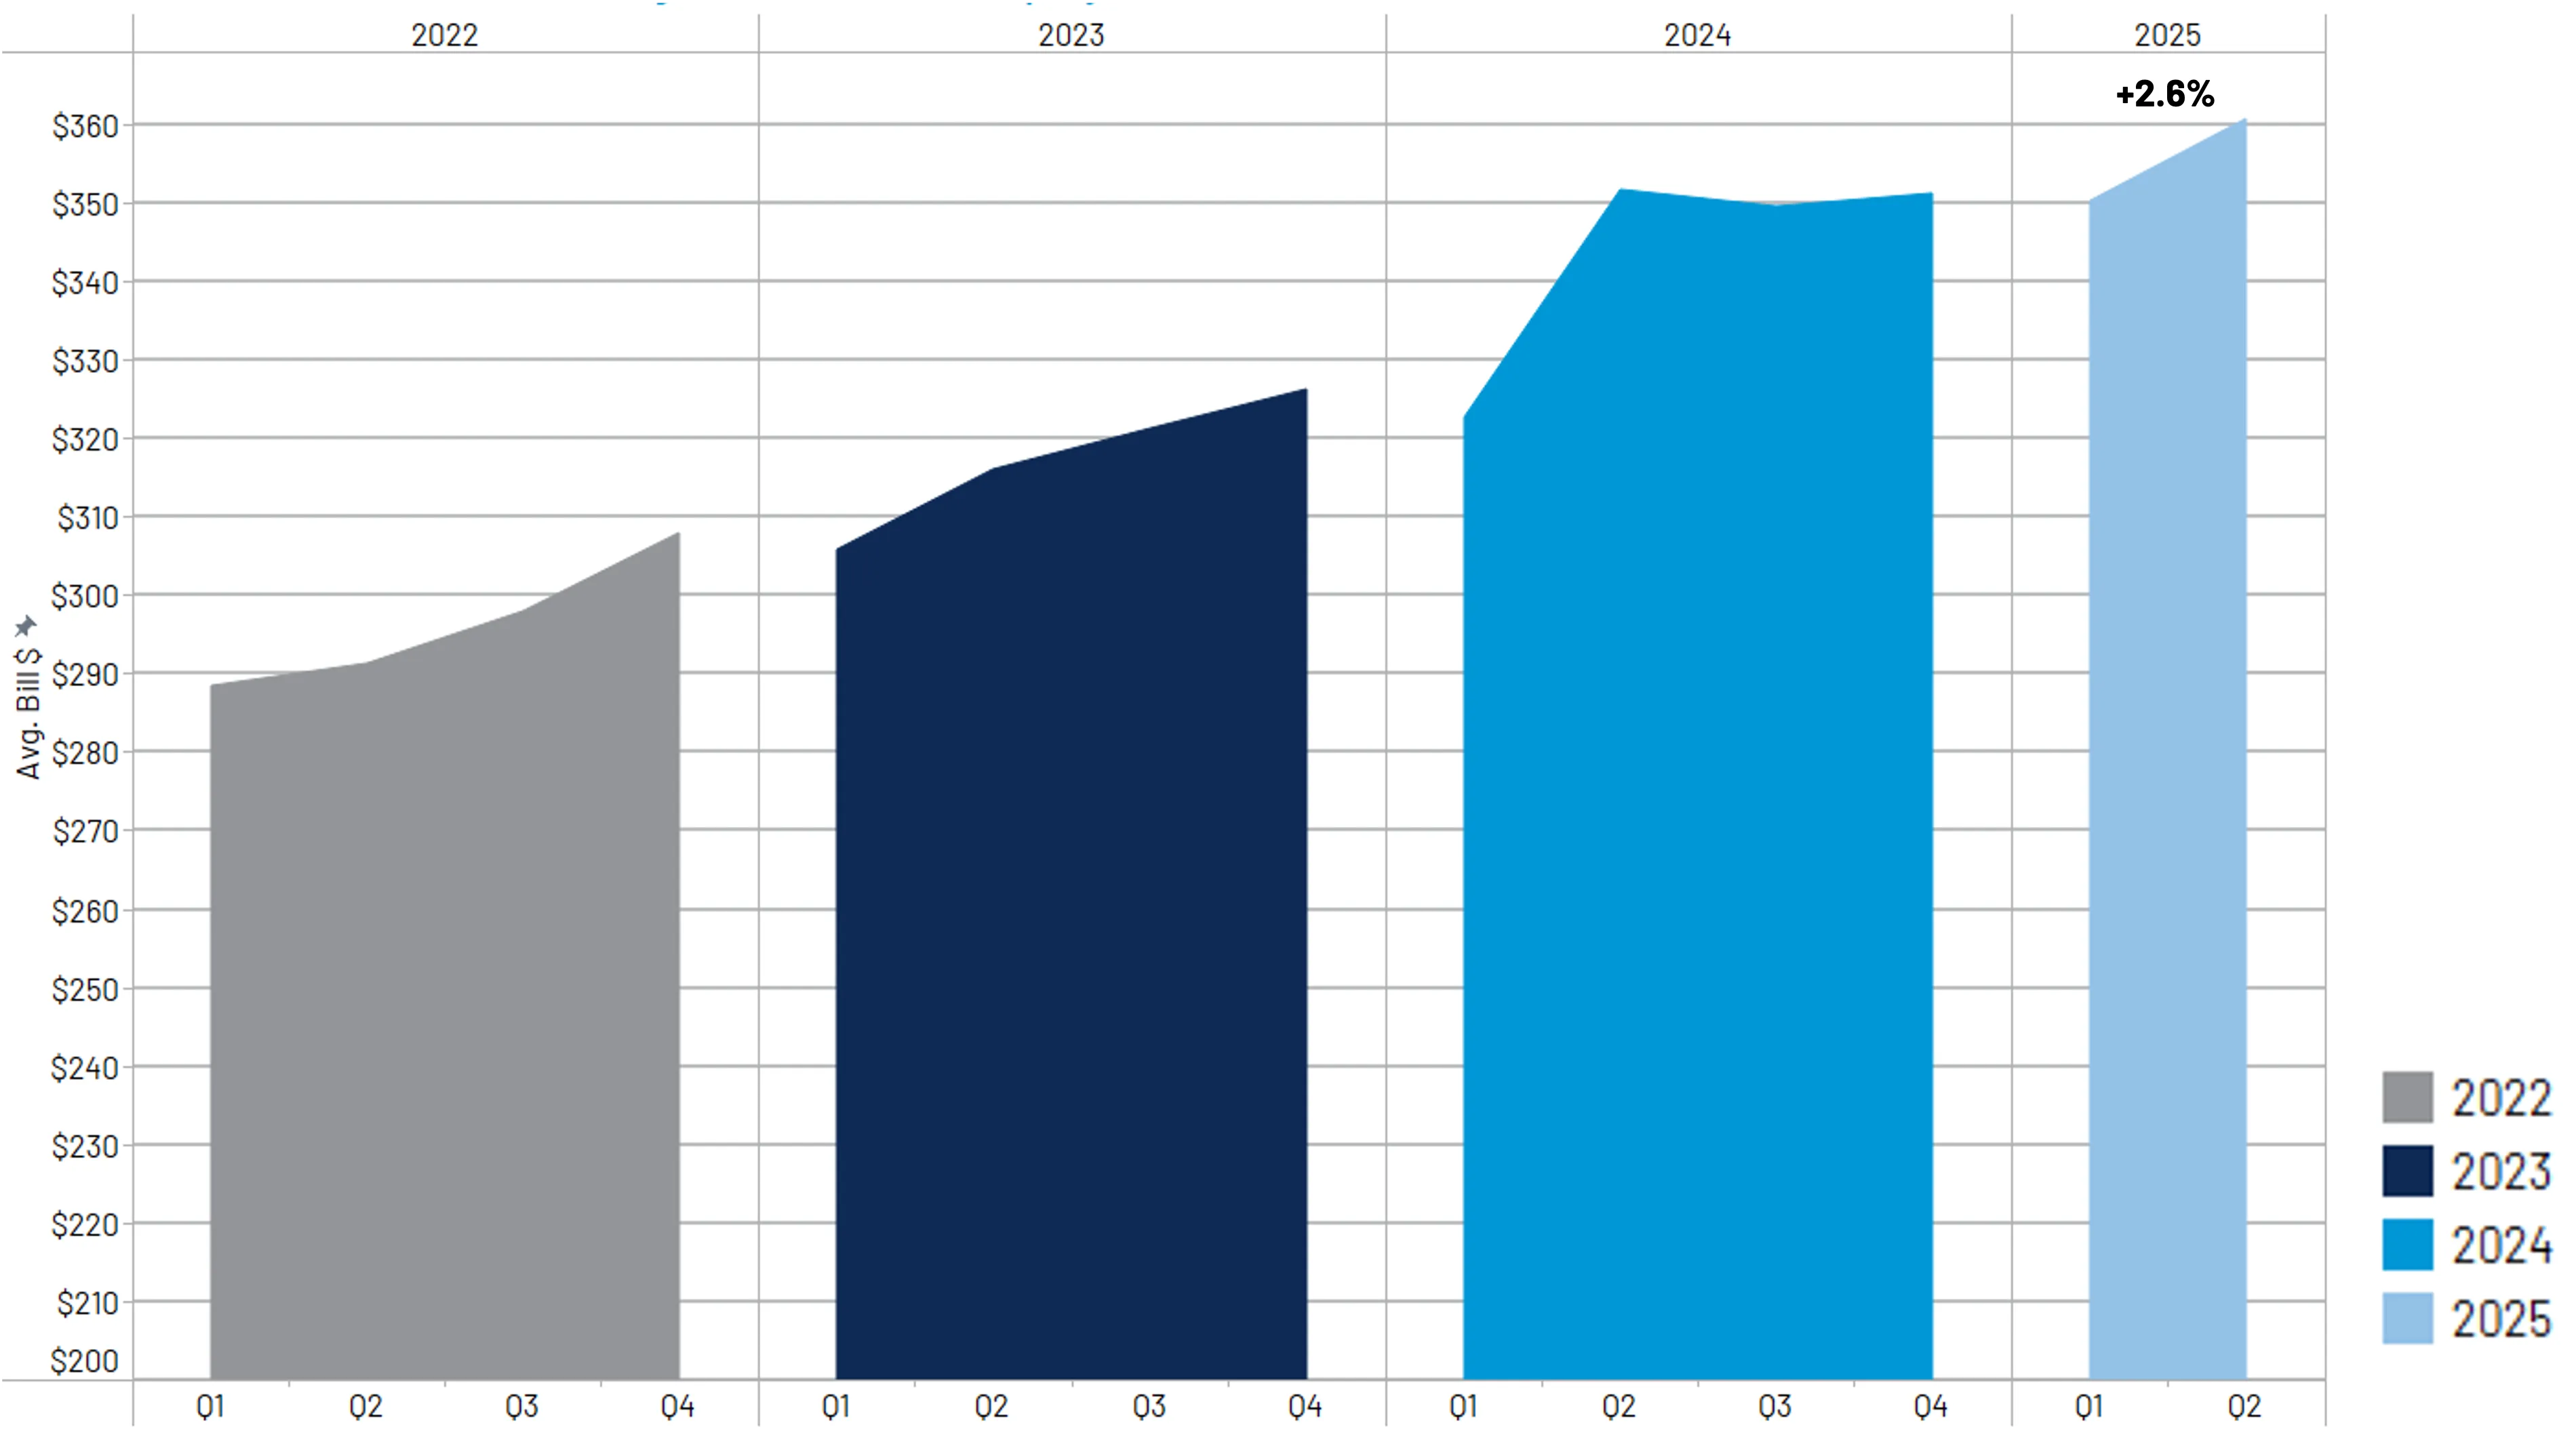
First party bill line severity has increased 2.6% since Q2 2024. (Figure 14)
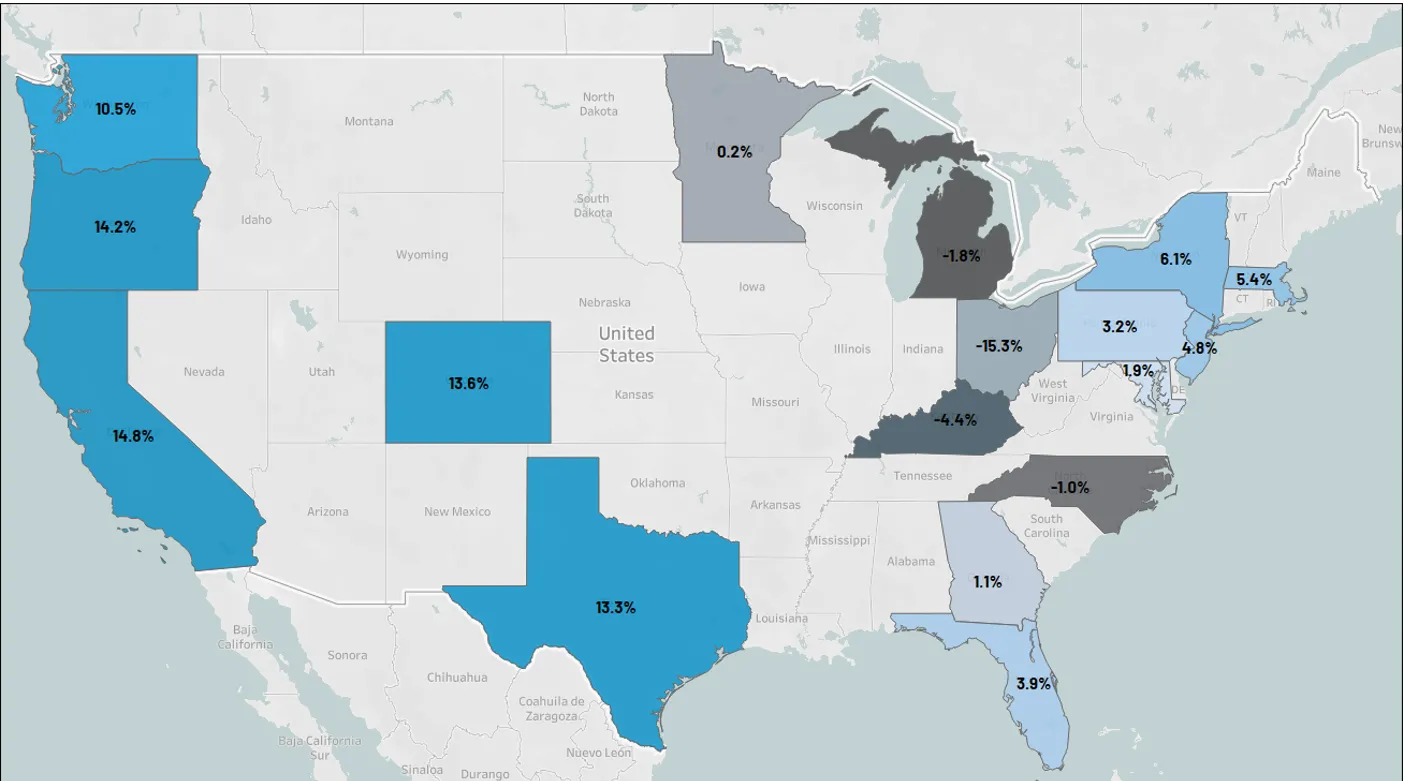
For key volume states, the most notable line level increases since H1 2024 have occurred in California, Oregon, Colorado, and Texas. (Figure 15)
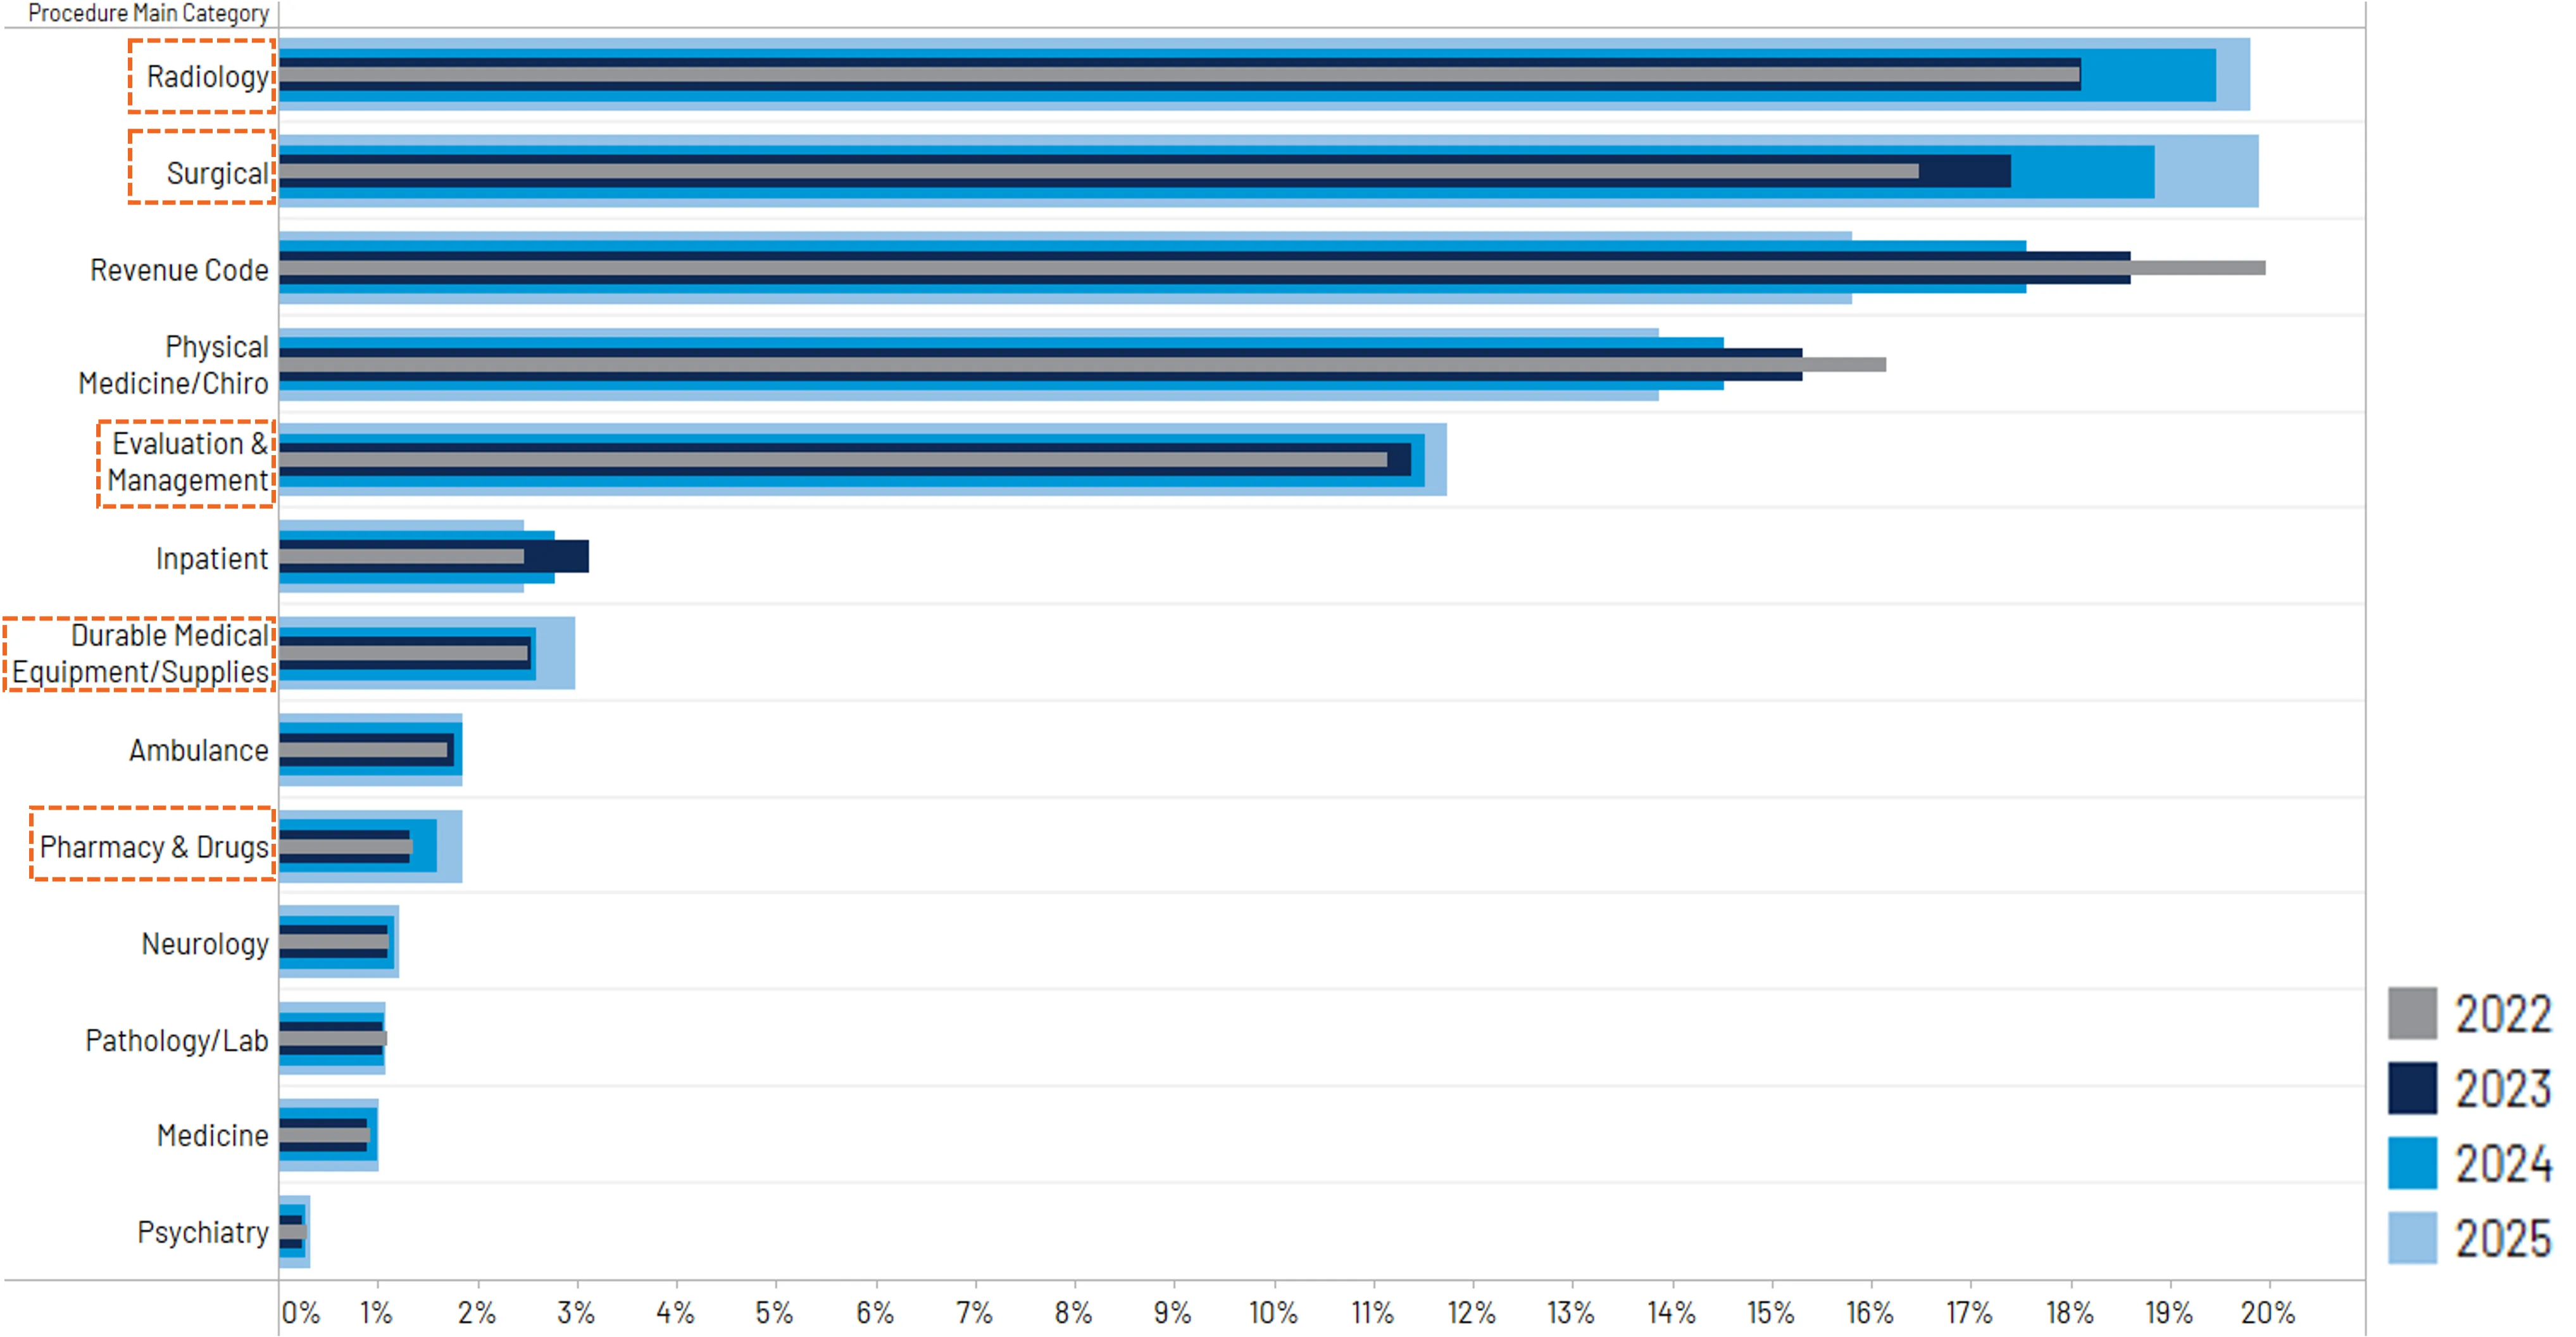
Distribution of procedure dollars shows notable increases in Radiology, Surgical, Eval & Mgmt, DME, and Pharmacy/Drug as of H1 2025. (Figure 16)
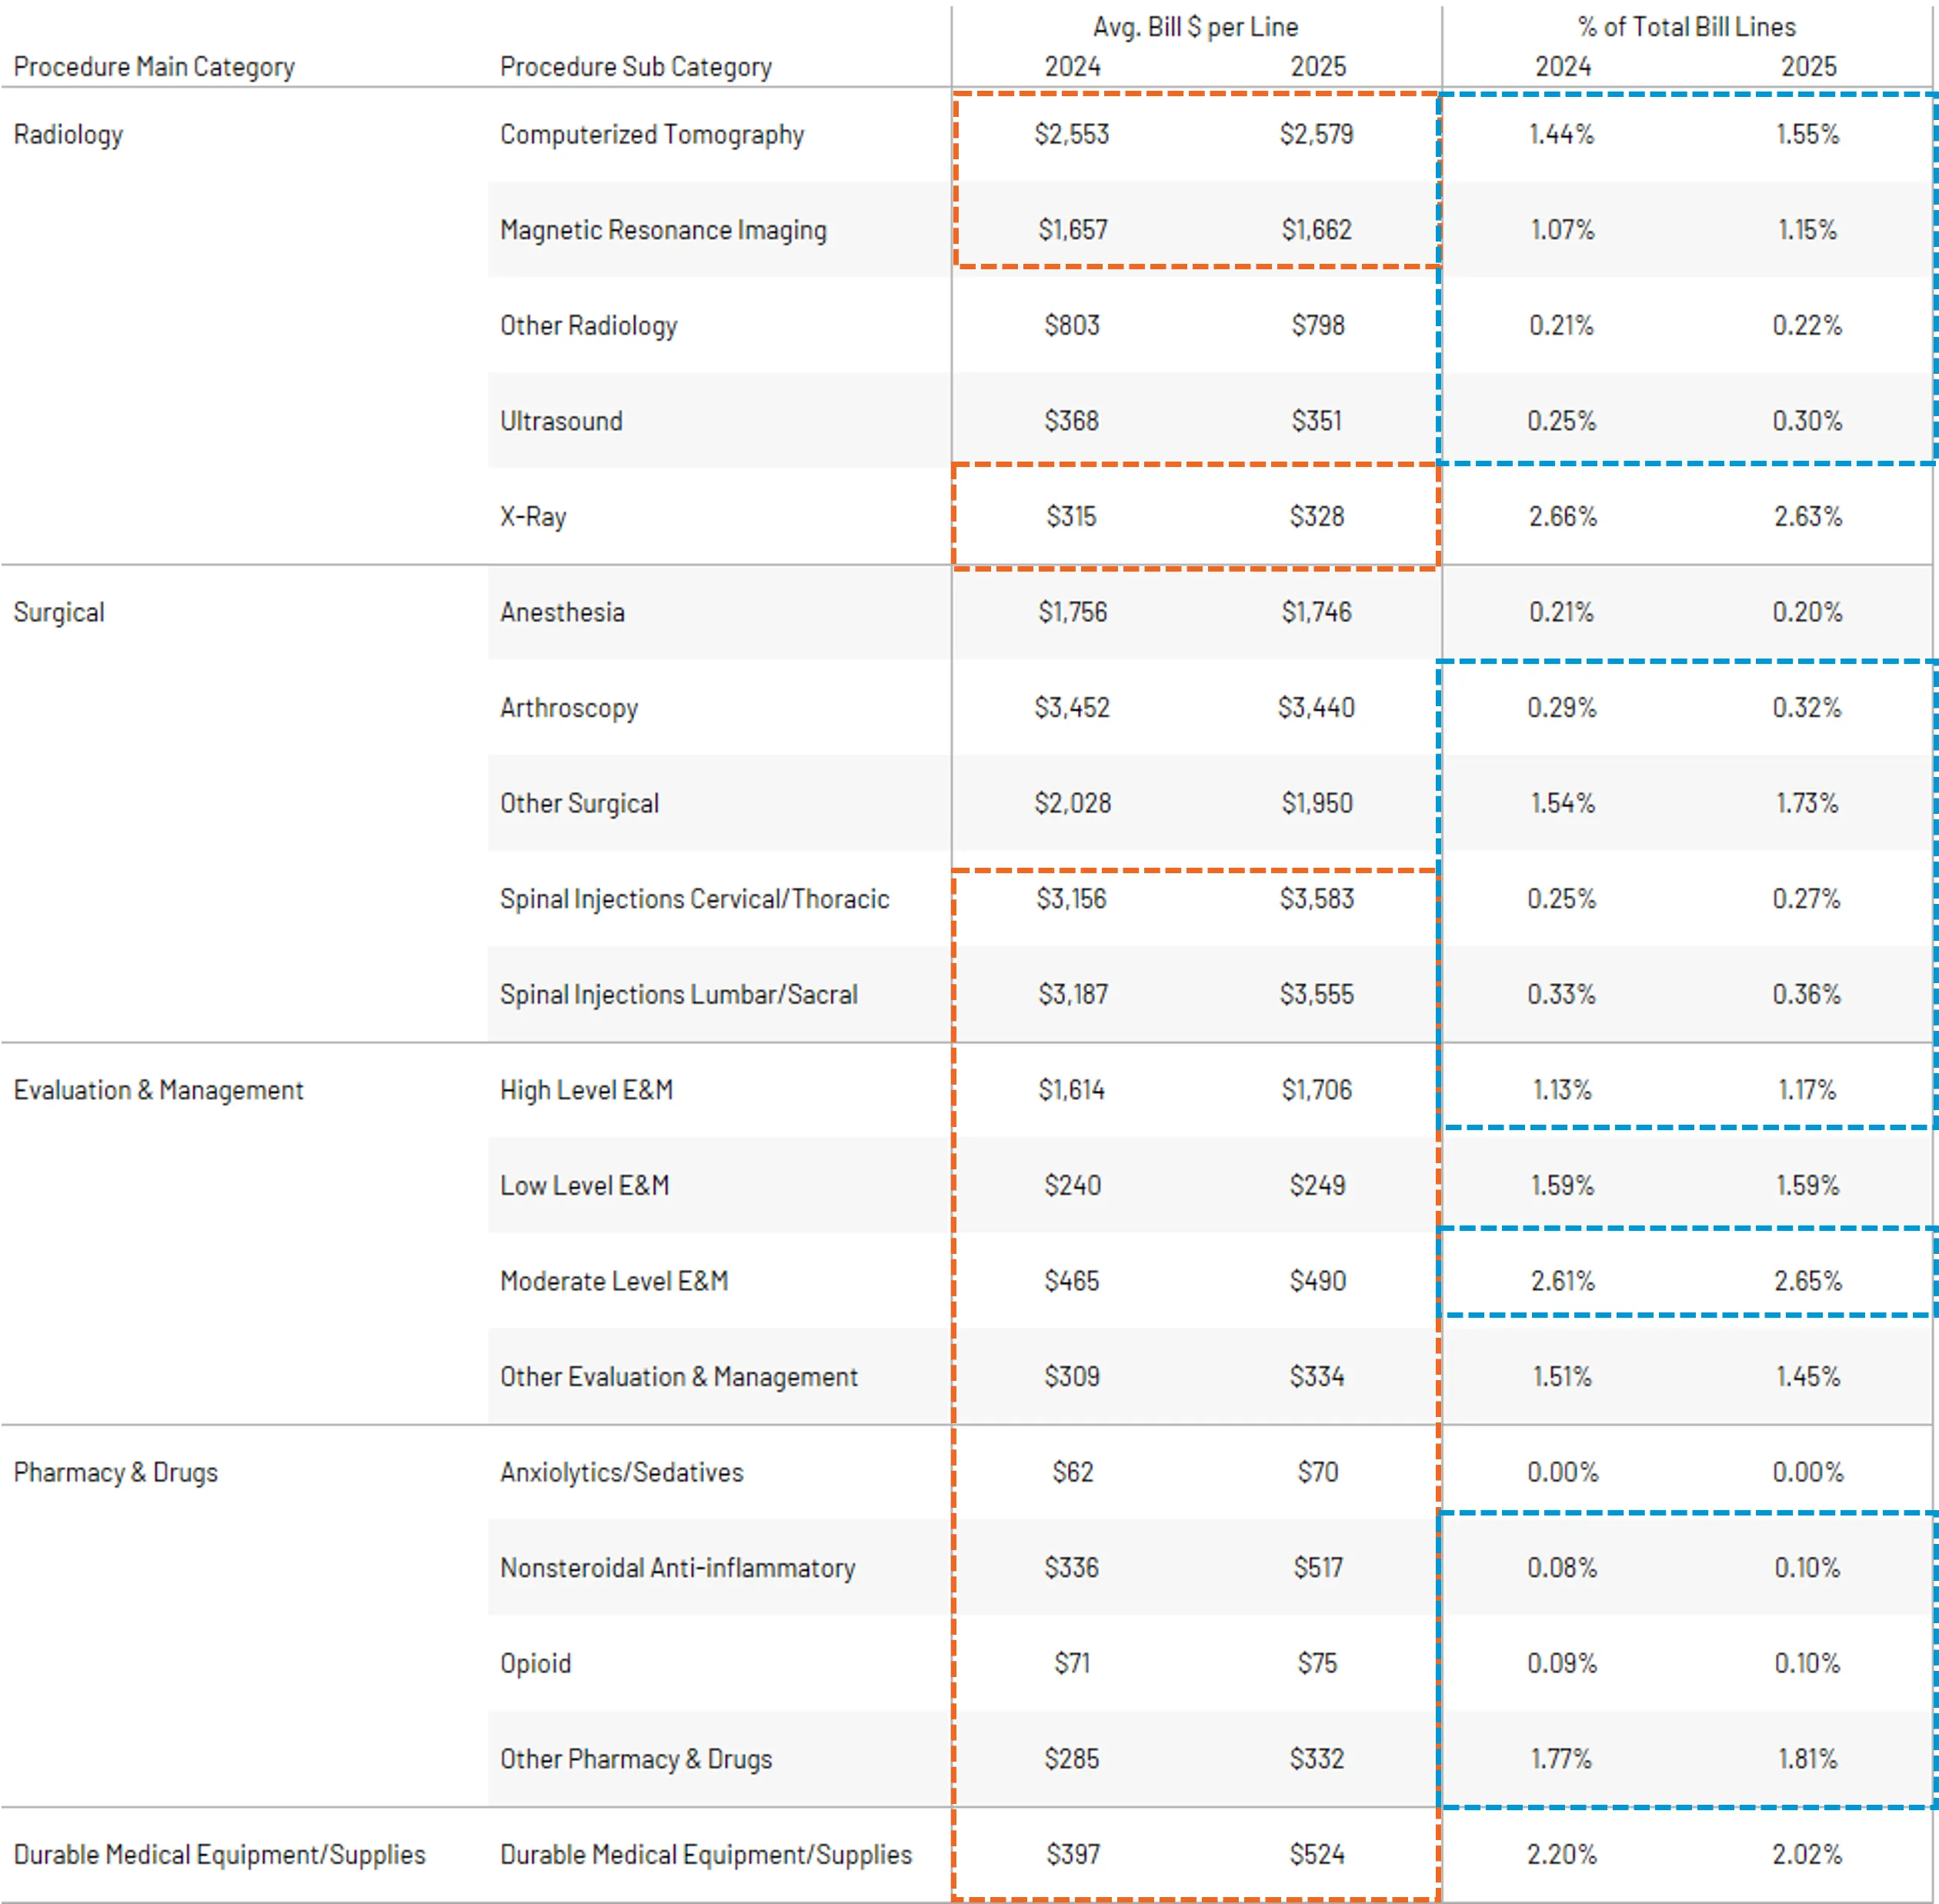
Drilling further into growth categories, movement is driven by both cost and frequency increases within most procedure subcategories. (Figure 17)
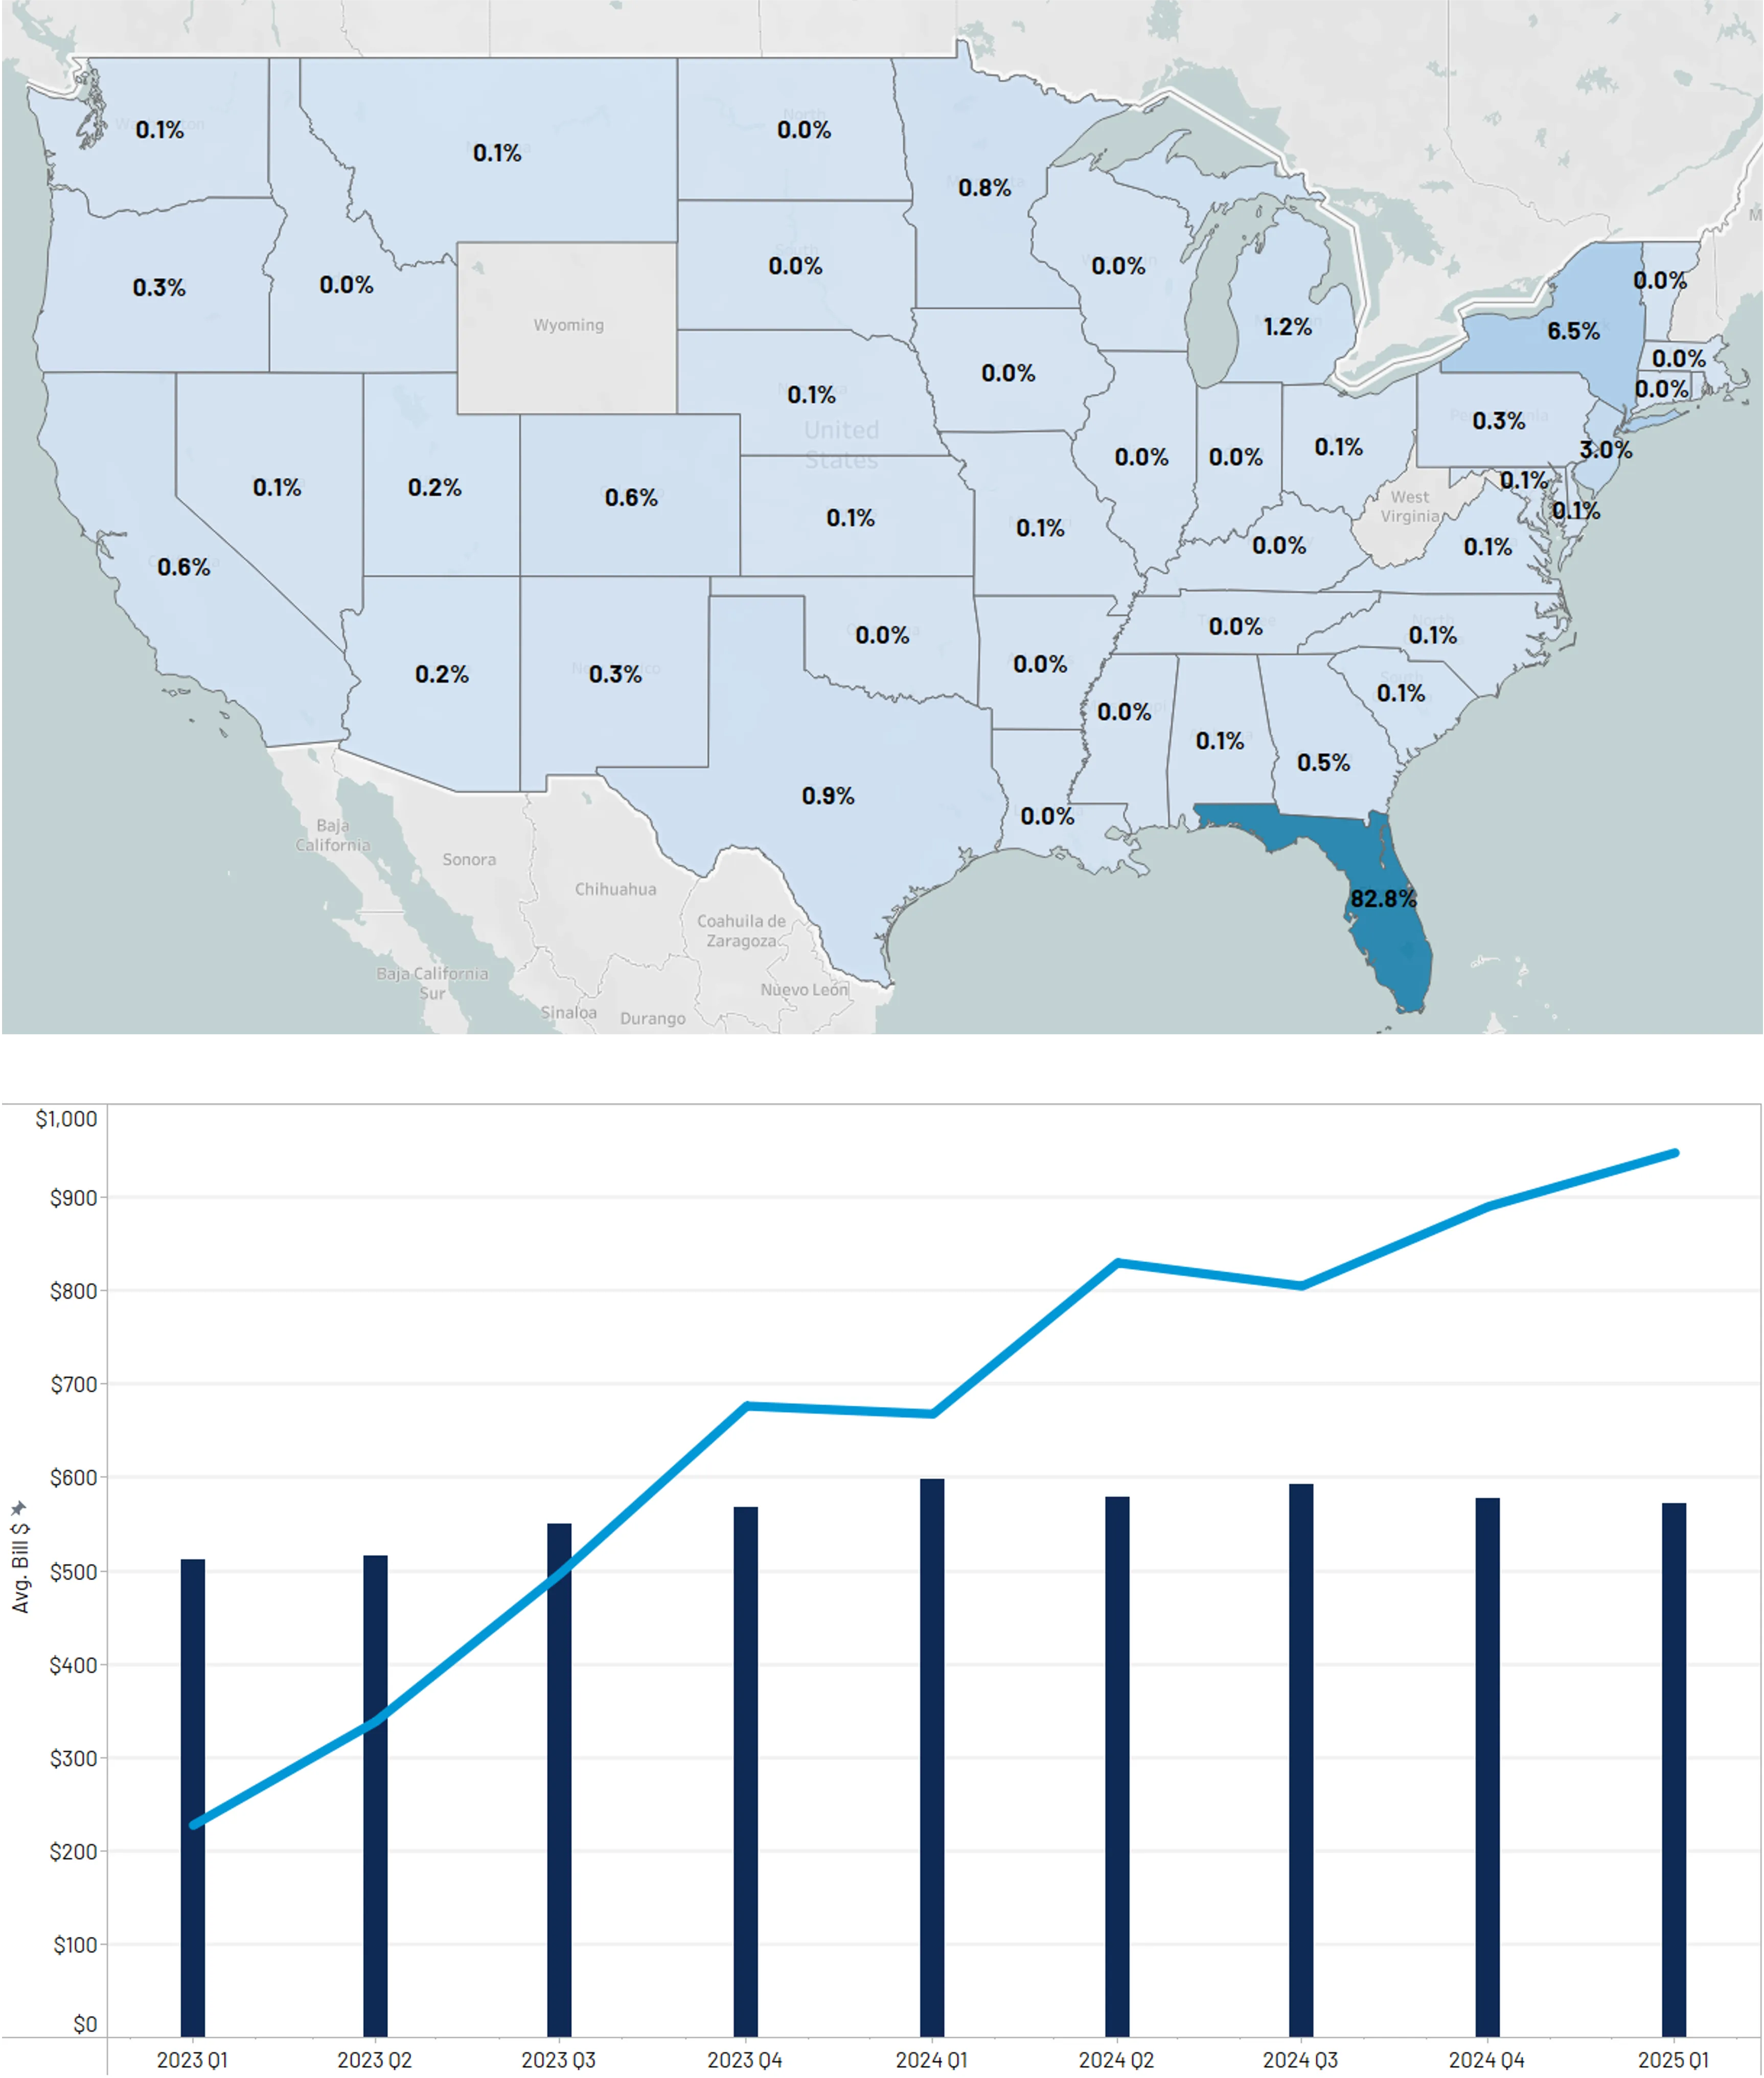
Extracorporeal Shockwave Therapy (ESWT) procedures are increasing in frequency. The vast majority of utilization is in Florida, where it is the second highest surgical code by $ billed with an average of 9 procedures per injured party.
Similar to PRP, this procedure is classified as experimental and not reimbursed by Medicare or most private insurance. (Figures 18 and 19)
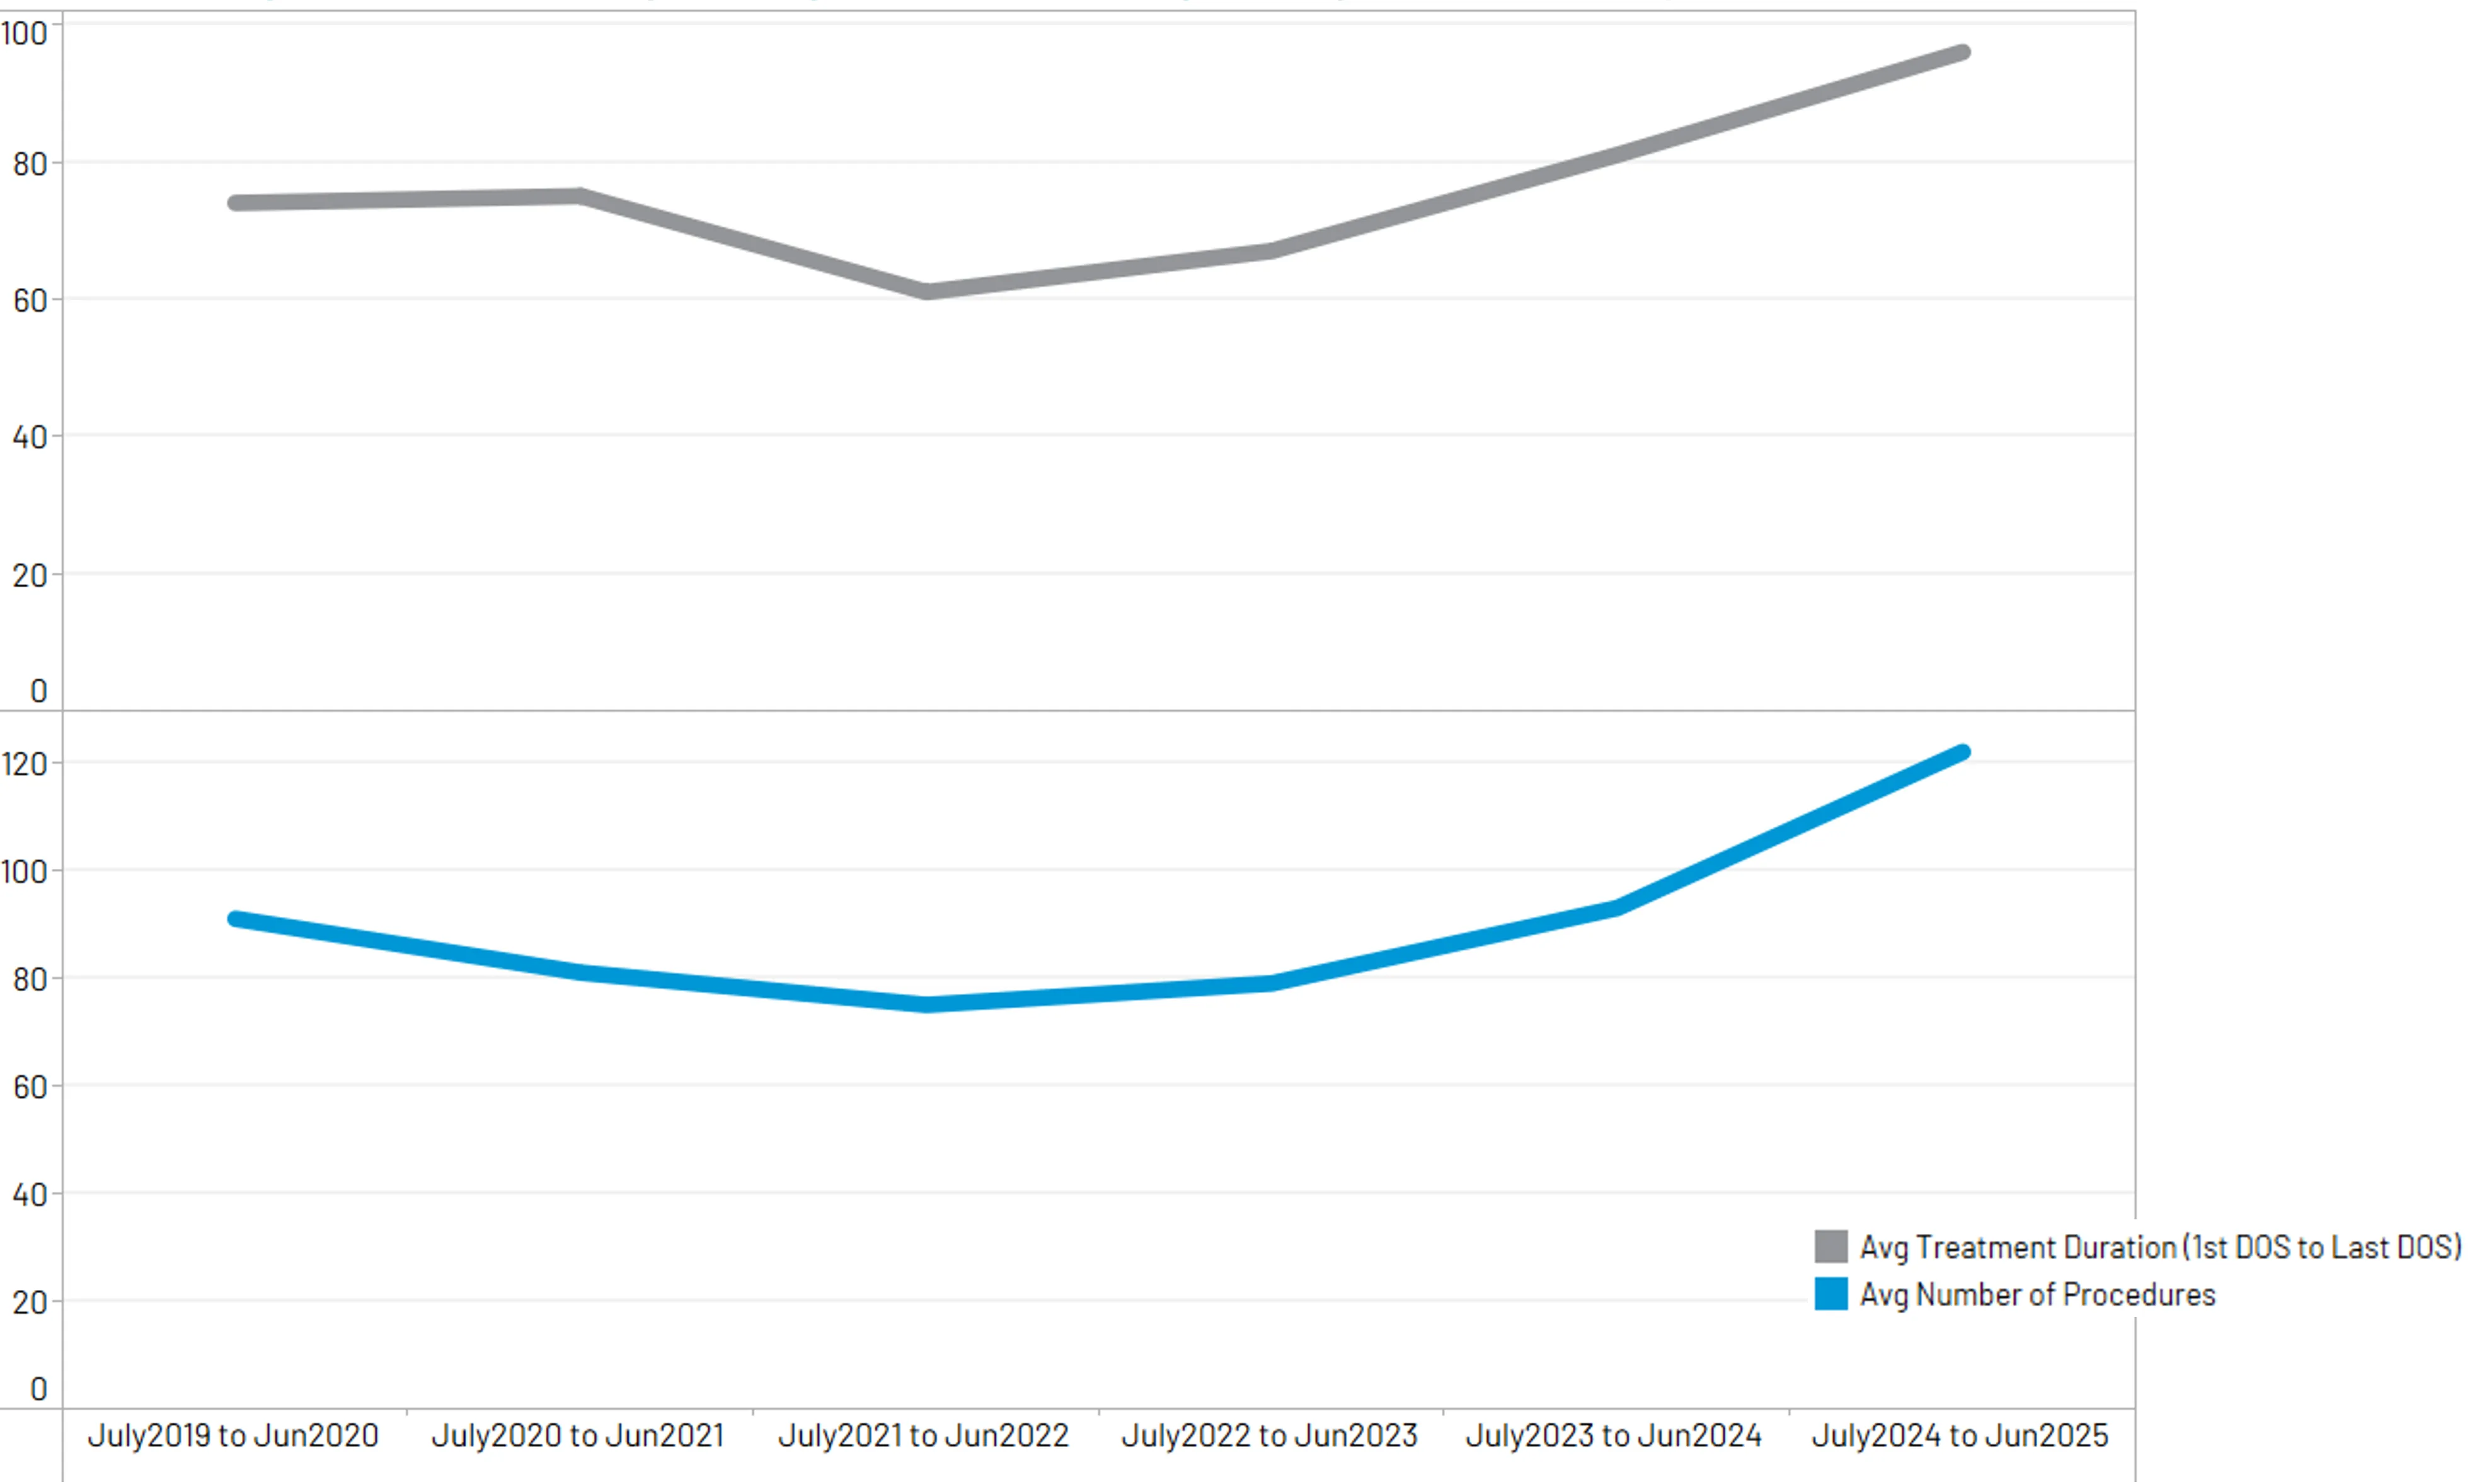
First party treatment complexity is on the rise. Average treatment duration has increased 19% over the last year, while procedure counts have increased 31%. (Figure 20)


Intelligent Solutions
Collision Repairers
Our solutions help repairers run more efficient body shop businesses, while making repair decisions simpler and faster.
Insurance Carriers
Our solutions help insurers make more confident decisions earlier, creating intelligent claims experiences that are more connected for their employees and more compassionate for their policyholders.
Auto Manufacturers
Our solutions help auto manufacturers enhance their consumers’ repair experiences, while connecting them to the industry’s largest repair network.
Get Your Complimentary Report