
Click here to receive monthly CCC Trends reports and other insights
2023 saw a continuation of the multi-year state of industry challenges and changes for the collision repair and insurance markets – one that requires both shops and carriers to explore new ways of operating and delivering on customer expectations.
This year-end report will take a broader look at three key trends that defined the industry in 2023, from the alarming rise in vehicle thefts and vandalism to the intricate impact of labor strikes and the changing dynamics of total cost of repairs.
As CCC continues to monitor this data, it’s clear that the auto repair and insurance sectors are navigating a complex terrain marked by significant shifts in consumer behavior, supply chain resilience, and market demands.
1. The Rise in Theft
One concerning trend we observed this year is the escalating U.S. vehicle theft rates. Despite a high recovery rate, the sheer volume of stolen vehicles poses a challenge for the insurance industry, with domestic pickups being particularly vulnerable.
According to NICB (the National Insurance Crime Bureau), vehicle thefts remained on the rise in the first half of 2023 – up 2% as compared to the first half of 2022. The U.S. saw over one million vehicles stolen in 2022 – the most since 2008 – and a year over year increase of 7%. Of those vehicles stolen, over 85% were recovered (34% on the same day of the theft).
According to CCC data, total losses as a result of theft have exceeded 3% of all total losses since the fourth quarter of 2021, peaking at over 4% in Q4 2022 (Figures 1 and 2). While many media outlets have focused on thefts associated with Hyundai and Kia, which have contributed to the rise, the data tell us that theft has been widespread regardless of vehicle type and origin.


Based on CCC data through Q3 2023, domestic pickups have the highest rates of total loss due to theft – over 6% for each of the past eight quarters (Figures 3 and 4). Similarly, NICB reported that full-size pickups represented 25% of the over one million vehicles stolen in 2022 (down from 33% in 2021).


Despite the high recovery rates for stolen vehicles, claims resulting from attempted thefts and other forms of vandalism are also on the rise. CCC repairable claims volume for vandalized vehicles was up almost 22% year-over-year in 2022 and is on pace to increase 10% in 2023. Total losses as a result of vandalism increased by 10% in 2022 and are on pace to see an increase of over 25% year-over-year.
Vehicles produced in Asia accounted for 48% of all repairable vandalism claims in 2020; that share increased to over 60% in 2022 and is over 68% through Q3 2023 (Figure 5). Asian autos 4 years or older have shown the greatest propensity for vandalism, which can be attributed to commonality and social media triggers which have prompted and perpetuated auto thefts.

Theft of catalytic converters also surged this year, leading to widespread concern and preventive measures.
NICB reported that 64,701 catalytic converter thefts took place in 2022; this is almost 4X the count in 2020. Per their report, catalytic converters contain valuable rare earth metals (platinum, rhodium, and palladium) and can fetch $50-250 or, for one from a hybrid, up to $800. Carfax reported that as many as 153,000 catalytic converter thefts might have occurred in 2022 – almost 90,000 more events occurring than claims reported (likely due to vehicles not having applicable insurance coverage for the loss or insureds electing against filing a claim).
Based on CCC's data, over 70% of catalytic converter claims in 2022 were for vehicles 7 or more years old; of those, 8.6% were total losses. Through the first half of 2023, 69.9% of catalytic converter claims were for vehicles 7 years or older, with 11.8% being deemed total losses. The average repairable catalytic converter claim had an average total cost of $1,415, made up primarily of replacement parts.
Numerous actions are being taken to prevent catalytic converter theft in legislatures and law enforcement across the county. Vehicle owners can prevent catalytic converter theft by being more aware of where they park, including well-lit areas and garages, and having VIN numbers etched onto their vehicle’s catalytic converter which can also be painted with bright high-heat paint.
A large national insurance carrier recently reported that catalytic converter thefts were down ~38% in 2023. However, it is unclear how much of that decline is related to an actual decrease in catalytic converter thefts, as this is based on filed claims.
2. The Impact of Strikes on Suppliers
The repercussions of the recent UAW strikes also rippled through the industry, underlining the critical role of suppliers and emphasizing the need for a more resilient supply chain.
Based on historical experience, the strikes could result in increased cycle times over the next few months and potential non-OEM part price increases.
Beyond the short-term impacts, the recent strikes highlighted the importance of suppliers. Suppliers account for 900,000 jobs in the automotive industry (six times the number of UAW workers at Ford, GM, and Stellantis combined) and represent 2.5% of GDP. At the onset of the strike, concerns about the impact to suppliers and long-term effects on the supply chain were voiced.
Gone are the days of raw material being transported into Michigan auto plants and seeing thousands of automobiles come out each day. More efficient, distributed operating models opened the door to the modern, global supply chain and the merits of on-time delivery. However, as we saw during the pandemic, this model is not immune to market pressures. Of the over 11,000 workers laid-off because of the UAW strikes, more than 3,400 were from suppliers.
In context, the strikes resulted in $10.4 billion in economic losses and underscored uncertainty in the automotive industry. Suppliers accounted for almost a third of the economic losses from the strike; current estimates put the impact of strikes on suppliers of $3.3 billion.
At the time of this writing, UAW workers have ratified contracts with Ford, GM, and Stellantis. Honda, Hyundai, Nissan, Subaru, Toyota, and Volkswagen have all increased wages for their U.S. plant workers on the heels of the aforementioned agreements.
3. The Vehicle Repair Cost Bubble
In the auto collision segment, total cost of repairs (TCOR) experienced subtle fluctuations this year, influenced by factors like vehicle age mix and economic variables.
CCC’s average TCOR has exhibited a modest increase in 2023, +4.6% through Q2, following the double-digit increases in 2021 and 2022 (+10.2% and 12.4% respectively). Only one of the key drivers of TCOR – labor – has had a major impact on TCOR thus far in 2023, while parts costs have remained relatively flat.
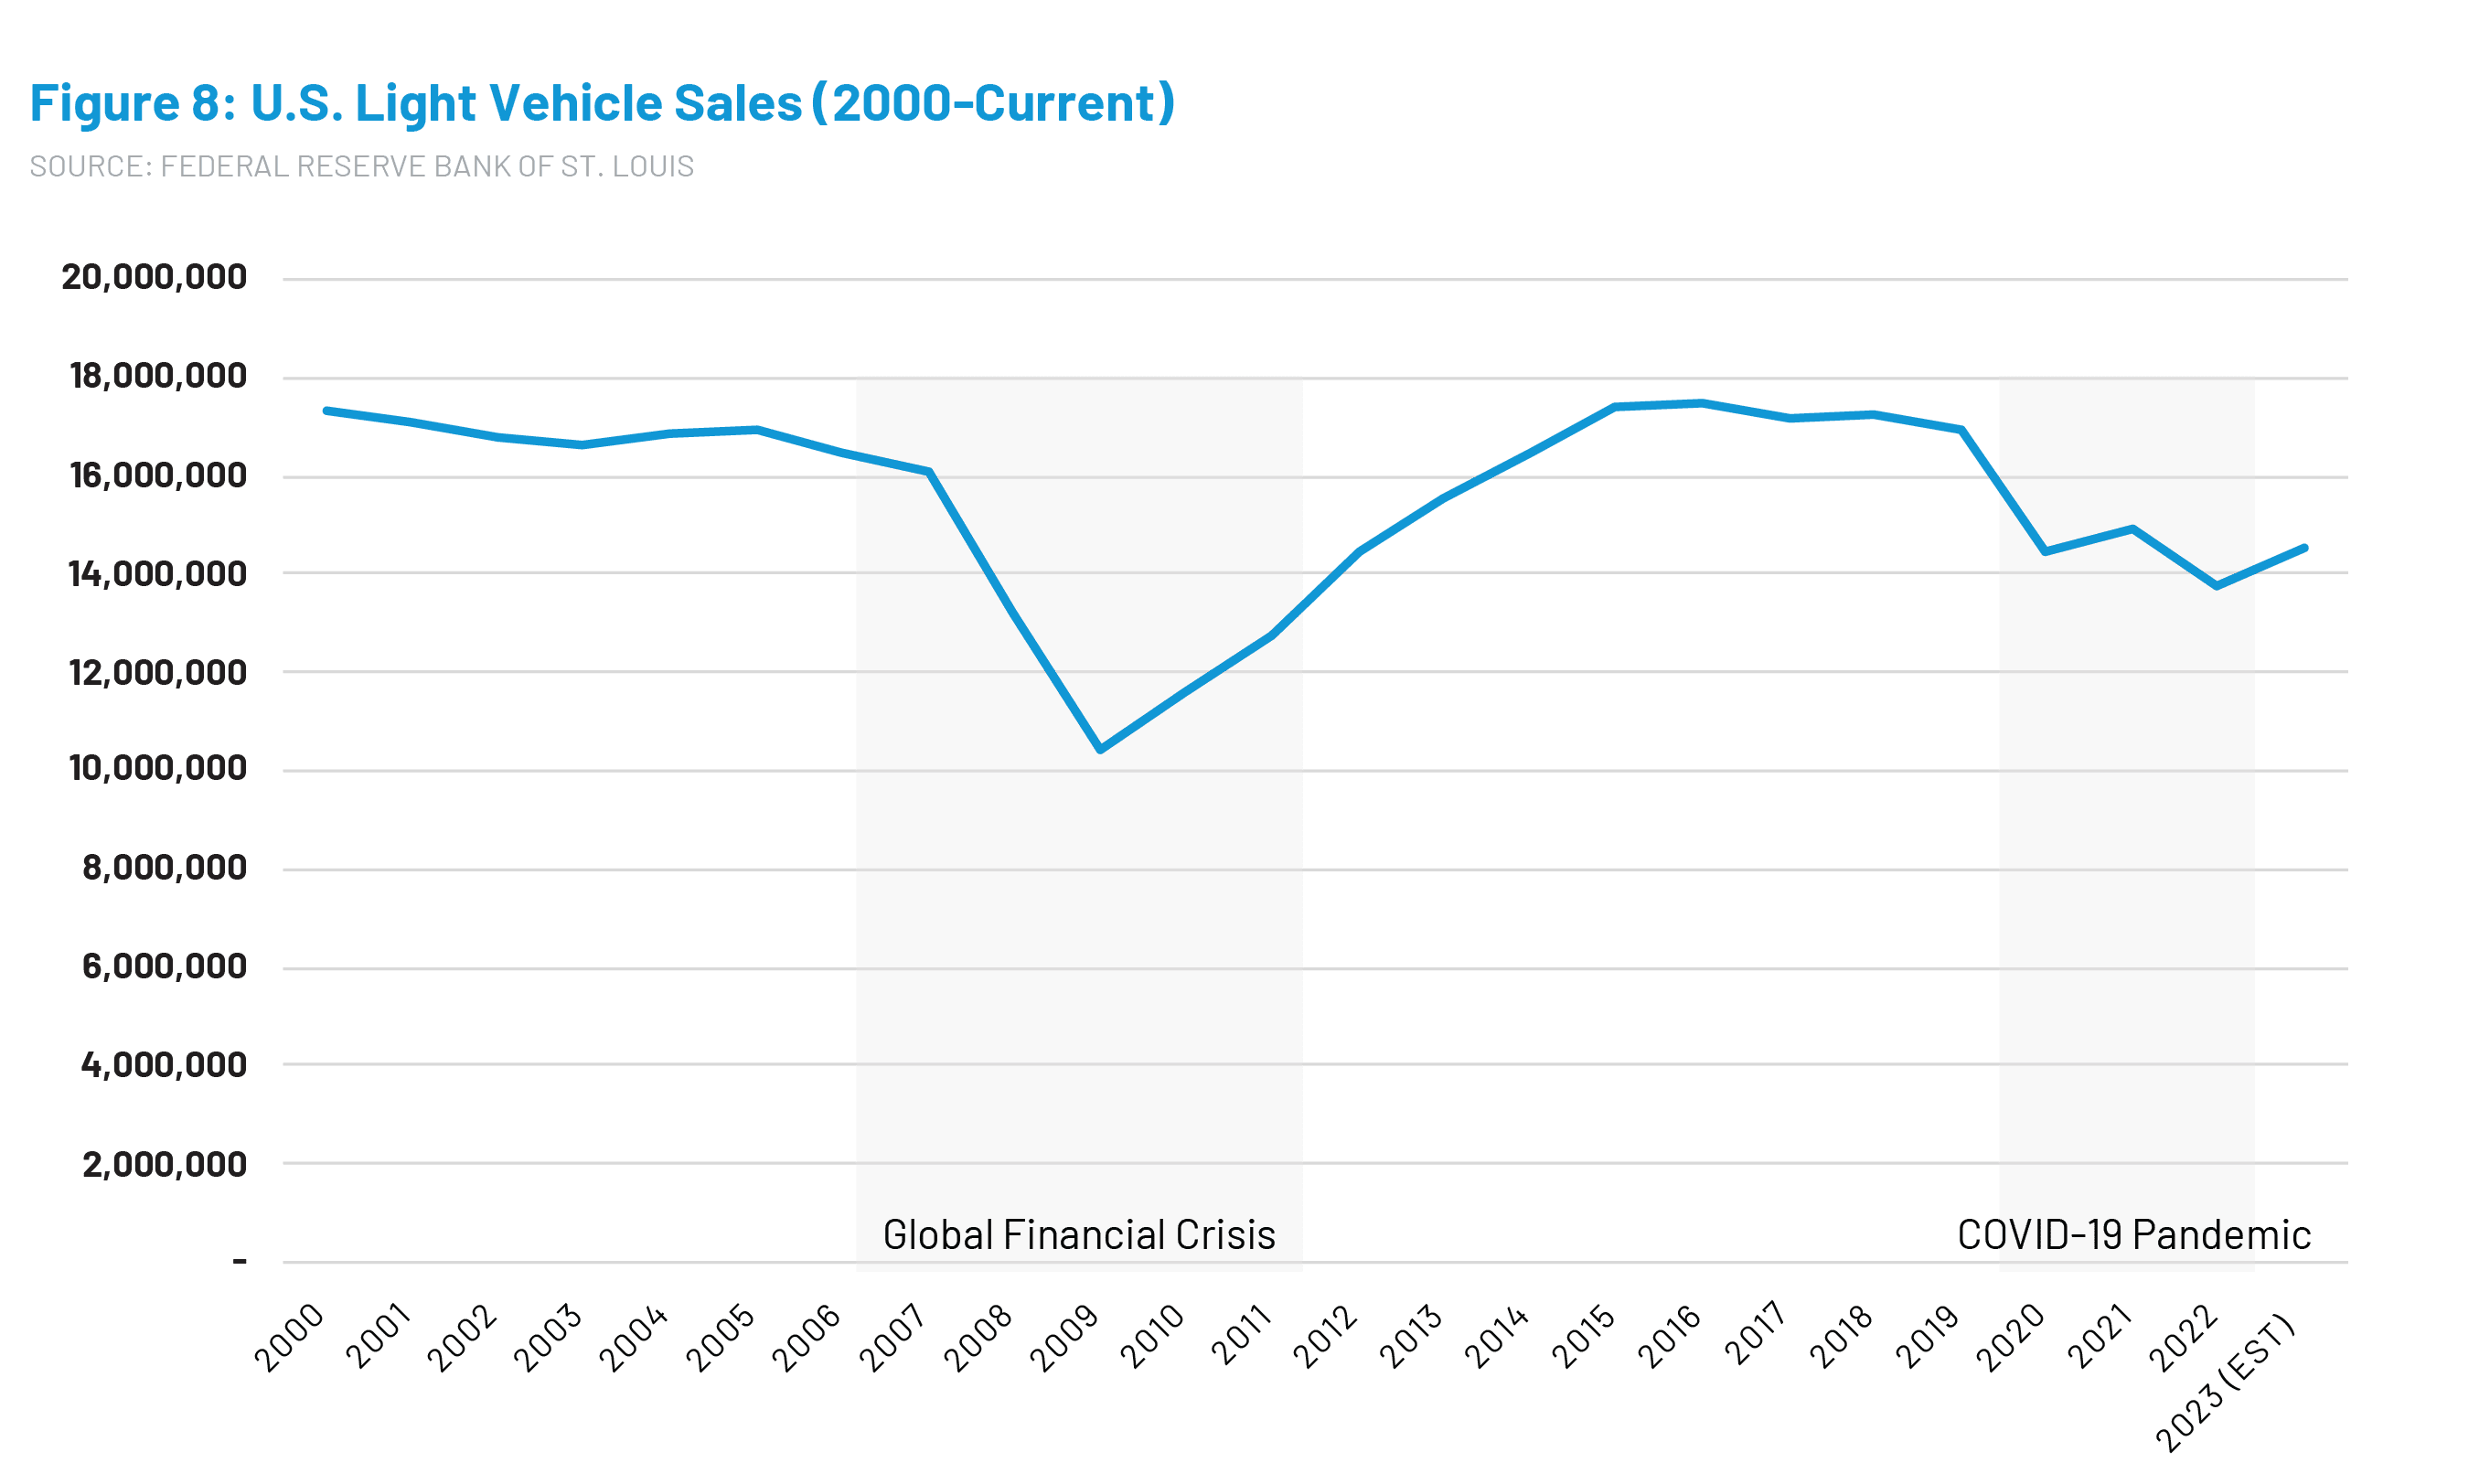
Beneath the surface of these highly aggregated numbers lurks a possible cause for concern for the coming years – increases in new vehicle sales and a shift in vehicle age mix. S&P Global Mobility reported that the average age for light vehicles was 12.5 years. This comes following a year that saw the lowest volume of new vehicle sales since the Financial Crisis (2007-2011), per the Federal Reserve Bank of St. Louis.
Since 2018, we have seen vehicles seven years or older account for an increasing share of overall repairable claims: from 35.5% in 2018 to 44.8% in 2023 (Figure 6).

Across all loss categories, the average TCOR is $4,451 through Q2 2023. Vehicles seven years or older have an average TCOR of $3,516 while the average TCOR for vehicles six years or newer is $5,211 - almost $1,700 more than vehicles seven years or older.
In other words, the aging vehicle pool is temporarily containing the average TCOR from ballooning even further. Had the vehicle age mix remained consistent with 2018, the average TCOR would currently stand at $4,657 (an additional +4.6% greater than current) (Figure 7).

A few factors that exacerbated vehicle maturity over the past few years are decreased miles driven, new vehicle production, new vehicle costs, and auto financing costs.
Miles driven continue to recover and are +2.4% year-over-year through August. While work arrangements are still in flux, companies continue to reconsider return-to-office protocols.
Average new vehicle prices remain around $48,000 with average APRs currently ranging from 7.4% to over 9% (Figures 8 and 9). 2022 new vehicle sales were at their lowest since the financial crisis, bottoming out in 2009 when 10.4 million new cars and light trucks were sold. New vehicle sales did not return to pre-recession levels, until 2014. An average of 17.1 million new cars and light trucks sold were annually between 2014 and 2019.

As new vehicle sales volume continues to increase, the mix of older vehicles should begin to recede in favor of newer vehicles, though this could take 5-7 years to be reflected in the vehicle mix. At a modest 5% year-over-year increase in new vehicle sales, we might not expect to see pre-pandemic sales volumes until 2026.
As we enter 2024, pay close attention to vehicle age mix shifts to stay ahead of the curve.
Preparing for 2024
As we approach 2024, these interconnected industry themes paint a vivid picture of the current state, urging stakeholders to adapt and innovate in the face of change. The insights gleaned from these year-end trends can help shops, carriers, and even policymakers toward more informed decisions.
Acknowledging the challenges posed by theft, supply chain disruptions, and shifting market dynamics is the first step toward devising proactive strategies. By staying vigilant and agile, the industry can harness insights to fortify its foundations, ensuring a resilient and prosperous future.
In the coming years, vigilance, adaptability, and a keen understanding of emerging trends will be paramount, enabling shops, carriers, and even policymakers to navigate the ever-changing landscape with confidence.
Click here to receive monthly CCC Trends reports and other insights
*Note: Where CCC Intelligent Solutions Inc. is cited as source, the data provided is an aggregation of industry data related to electronic appraisals communicated via CCC's electronic network or from total loss valuations processed by CCC.